As filed with the U.S. Securities and Exchange Commission on April 2, 2026.
Registration Statement No. 333-290714
UNITED STATES
SECURITIES AND EXCHANGE COMMISSION
Washington, D.C. 20549
__________________________________________
NO. 1
TO
FORM F-1
REGISTRATION STATEMENT
UNDER
THE SECURITIES ACT OF 1933
__________________________________________
__________________________________________
| | 1040 | Not Applicable | ||
| (State or other jurisdiction of | (Primary standard industrial | (I.R.S. Employer |
Namib Minerals
Suite 210, 2nd Floor, Windward III, Regatta Office Park, PO Box 500,
Grand Cayman, Cayman Islands, KY1-1106
Tel: (345) 769-4909
(Address, including zip code, and telephone number, including area code, of Registrant’s principal executive offices)
__________________________________________
Cogency Global Inc.
122 East 42nd Street, 18th Floor
New York, NY 10168
Tel: (212) 947-7200
(Name, address, including zip code, and telephone number, including area code, of agent for service)
__________________________________________
Copies to:
|
Barbara A. Jones, Esq. Greenberg Traurig, LLP Suite 1900 1840 Century Park Blvd. Los Angeles, CA 90067 Tel: (310) 586-7700 |
__________________________________________
Approximate date of commencement of proposed sale to the public: As soon as practicable after this Registration Statement becomes effective.
If any of the securities being registered on this Form are to be offered on a delayed or continuous basis pursuant to Rule 415 under the Securities Act of 1933, check the following box. ☒
If this Form is filed to register additional securities for an offering pursuant to Rule 462(b) under the Securities Act, check the following box and list the Securities Act registration statement number of the earlier effective registration statement for the same offering. ☐
If this Form is a post-effective amendment filed pursuant to Rule 462(c) under the Securities Act, check the following box and list the Securities Act registration statement number of the earlier effective registration statement for the same offering. ☐
If this Form is a post-effective amendment filed pursuant to Rule 462(d) under the Securities Act, check the following box and list the Securities Act registration number of the earlier effective registration statement for the same offering. ☐
Indicate by check mark whether the registrant is an emerging growth company as defined in Rule 405 of the Securities Act of 1933.
Emerging growth company
If an emerging growth company that prepares its financial statements in accordance with U.S. GAAP, indicate by check mark if the registrant has elected not to use the extended transition period for complying with any new or revised financial accounting standards† provided pursuant to Section 7(a)(2)(B) of the Securities Act.
____________
† The term “new or revised financial accounting standard” refers to any update issued by the Financial Accounting Standards Board to its Accounting Standards Codification after April 5, 2012.
This Post-Effective Amendment No. 1 to Form F-1 shall hereafter become effective in accordance with Section 8(c) of the Securities Act of 1933, as amended (the Securities Act”), on such date as the Securities and Exchange Commission, acting pursuant to Section 8(c) of the Securities Act, may determine.
EXPLANATORY NOTE
This Post-effective Amendment No. 1 to the Registration Statement on Form F-1 (File No. 333-290714) (as amended, the “Registration Statement”) of Namib Minerals (the “Registrant”), which became effective pursuant to Section 8(a) of the Securities Act on October 23, 2025, is being filed pursuant to the undertakings in Item 9 of Form F-1 and includes the Registrant’s audited consolidated financial statements as of December 31, 2025 and 2024 and for each year in the three-year period ended December 31, 2025, and certain other updates.
No additional securities are being registered under this Post-effective Amendment No. 1. The applicable registration fees were paid at the time of the original filing of the Registration Statement.
The information in this preliminary prospectus is not complete and may be changed. A registration statement relating to these securities has been filed with the Securities and Exchange Commission. The Selling Shareholder may not sell these securities until such registration statement is effective. This preliminary prospectus is not an offer to sell or the solicitation of an offer to buy these securities, and there shall not be any sale of these securities in any jurisdiction in which such offer, solicitation, or sale would be unlawful.
SUBJECT TO COMPLETION, DATED APRIL 2, 2026
PRELIMINARY PROSPECTUS
![]()
Namib Minerals
Up to 1,750,000 Ordinary Shares by the Selling Shareholder
This prospectus relates to the offer and sale from time to time by Cohen & Company Securities, LLC (the “Selling Shareholder”) of up to 1,750,000 ordinary shares, par value $0.0001 per share (the “Ordinary Shares”), of Namib Minerals (the “Company”) that may be issued pursuant to the Amended and Restated Promissory Note with a face value of $3.5 million (the “Promissory Note”), dated as of December 9, 2025, issued by the Company to the Selling Shareholder. The Company issued the Promissory Note to the Selling Shareholder in connection with amounts due and payable for previously provided investment banking services. The Ordinary Shares that may be sold by the Selling Shareholder are collectively referred to in this prospectus as the “Resale Shares.” The Selling Shareholder is a registered broker dealer and may be deemed to be an “underwriter” within the meaning of the Securities Act of 1933, as amended (the “Securities Act”). The Selling Shareholder has informed the Company that it does not have any written or oral agreement or understanding, directly or indirectly, with any person to distribute any Ordinary Shares.
Pursuant to the terms of the Promissory Note, the Company will pay the Selling Shareholder, at its discretion, in either cash or Ordinary Shares with the issue price of the Ordinary Shares (the “Issue Price”) being calculated as the lesser of (i) 95% of the closing price on the Nasdaq Stock Market LLC (“Nasdaq”) of the Ordinary Shares on the Trading Day (as defined herein) immediately preceding the applicable payment date and (ii) the arithmetic average of the Daily VWAP (as defined herein) for the five (5) Trading Days ending on the Trading Day immediately preceding the applicable payment date. A significant portion of the Ordinary Shares being registered for resale may be acquired by the Selling Shareholder at prices below the current market price of our Ordinary Shares. As a result, investors may experience substantial dilution and a decline in the value of the Ordinary Shares they purchase from the Selling Shareholder in this offering as a result of future issuances made by us to the Selling Shareholder in the event the Issue Price at issuance is lower than the price such investors paid for their shares. The actual number of Ordinary Shares issuable by us under the Promissory Note will vary depending on the then-current market price of our Ordinary Shares at the times of issuance. As of April 1, 2026, the Company has issued 805,228 Ordinary Shares to the Selling Shareholder under the Promissory Note.
We are registering the resale of the Ordinary Shares covered by this prospectus pursuant to the registration rights that we have granted to the Selling Shareholder in connection with the Promissory Note. We will not receive any proceeds from the sale of the Resale Shares by the Selling Shareholder.
We do not know when or in what amount the Selling Shareholder may sell the Resale Shares hereunder following the effective date of the registration statement of which this prospectus forms a part. The Resale Shares being offered for resale pursuant to this prospectus by the Selling Shareholder represent approximately 3.2% of Ordinary Shares outstanding (assuming all such shares are issued). For information on securities eligible for future sale, including securities not covered by this resale prospectus, see the sections entitled “Risk Factors” and “Securities Eligible for Future Sale” in this prospectus.
We will bear all costs, expenses and fees in connection with the registration of the resale of the Resale Shares. The Selling Shareholder will bear all commissions and discounts, if any, attributable to its sales of the Resale Shares. This prospectus also covers any additional securities that may become issuable by reason of share splits, share dividends or similar transactions.
Our registration of the securities covered by this prospectus does not mean that the Selling Shareholder will offer or sell any Ordinary Shares. The Selling Shareholder may offer and sell the securities covered by this prospectus in a number of different ways and at varying prices. We provide more information about how the Selling Shareholder may sell the shares in the section entitled “Plan of Distribution.”
You should read this prospectus and any prospectus supplement or amendment carefully before you invest in the Ordinary Shares.
Our Ordinary Shares are listed on the Nasdaq Global Market under the symbol “NAMM,” and our Warrants are listed on the Nasdaq Capital Market under the symbol “NAMMW.” On March 31, 2026, the closing trading prices of our Ordinary Shares and Warrants were $2.31 and $0.135, respectively.
Investing in our Ordinary Shares or Warrants involves a high degree of risk. Before buying any Ordinary Shares or Warrants you should carefully read the discussion of material risks of investing in such securities in “Risk Factors” beginning on page 7 of this prospectus.
NEITHER THE U.S. SECURITIES AND EXCHANGE COMMISSION NOR ANY STATE SECURITIES COMMISSION HAS APPROVED OR DISAPPROVED OF THESE SECURITIES OR DETERMINED IF THIS PROSPECTUS IS TRUTHFUL OR COMPLETE. ANY REPRESENTATION TO THE CONTRARY IS A CRIMINAL OFFENSE.
This prospectus is dated , 2026.
TABLE OF CONTENTS
|
Page |
||
|
ii |
||
|
iii |
||
|
iv |
||
|
v |
||
|
x |
||
|
xiii |
||
|
1 |
||
|
6 |
||
|
7 |
||
|
39 |
||
|
40 |
||
|
41 |
||
|
42 |
||
|
78 |
||
|
MANAGEMENT’S DISCUSSION AND ANALYSIS OF FINANCIAL CONDITION AND RESULTS OF OPERATIONS |
85 |
|
|
103 |
||
|
107 |
||
|
113 |
||
|
114 |
||
|
SECURITY OWNERSHIP OF CERTAIN BENEFICIAL OWNERS AND MANAGEMENT |
129 |
|
|
131 |
||
|
132 |
||
|
139 |
||
|
140 |
||
|
140 |
||
|
140 |
||
|
141 |
||
|
F-1 |
i
ABOUT THIS PROSPECTUS
This document, which forms part of a registration statement on Form F-1 filed with the SEC by the Company, constitutes a prospectus of the Company under Section 5 of the Securities Act of 1933, as amended (the “Securities Act”).
Neither we nor the Selling Shareholder have authorized anyone to provide any information or to make any representations other than the information contained in this prospectus, any amendment or supplement to this prospectus or in any free writing prospectus prepared by or on behalf of us or to which we may have referred you. We and the Selling Shareholder take no responsibility for, and can provide no assurance as to the reliability of, any other information that others may give you. We and the Selling Shareholder have not authorized any other person to provide you with different or additional information. Neither we nor the Selling Shareholder are making an offer to sell the securities covered by this prospectus in any jurisdiction where the offer or sale is not permitted. This offering is being made in the United States and elsewhere solely on the basis of the information contained in this prospectus. You should assume that the information appearing in this prospectus is accurate only as of the date on the front cover of this prospectus, regardless of the time of delivery of this prospectus or any sale of the securities covered by this prospectus. Our business, financial condition, results of operations and prospects may have changed since the date on the front cover of this prospectus. This prospectus is not an offer to sell or the solicitation of an offer to buy our securities in any circumstances under which such offer or solicitation is unlawful.
We are an “emerging growth company” as defined in the Jumpstart Our Business Startups Act of 2012 and are therefore eligible to take advantage of certain reduced reporting requirements otherwise applicable to other public companies.
For investors outside the United States: Neither we nor the Selling Shareholder have done anything that would permit this offering or the possession or distribution of this prospectus in any jurisdiction where action for those purposes is required, other than in the United States. Persons outside the United States who come into possession of this prospectus must inform themselves about, and observe any restrictions relating to, this offering of securities covered by this prospectus and the distribution of this prospectus outside the United States.
Our Company is incorporated in the Cayman Islands, and we are a “foreign private issuer” under the rules of the SEC. As a foreign private issuer, we are not required to file periodic reports and financial statements with the SEC as frequently or as promptly as domestic registrants whose securities are registered under the Exchange Act. Moreover, three of our directors and executive officers are not residents of the United States, and all or a substantial portion of the assets of such persons are located outside the United States. As a result, it may not be possible for investors to effect service of process within the United States upon us or upon such persons or to enforce against them judgments obtained in U.S. courts, including judgments in actions predicated upon the civil liability provisions of the federal or state securities laws of the United States. We have been advised by our legal counsel in the Cayman Islands that it is uncertain as to whether the courts in the Cayman Islands would entertain original actions based on U.S. federal or state securities laws or enforce judgments from U.S. courts against us or our officers and directors which originated from actions alleging civil liability under U.S. federal or state securities laws. See “Enforceability of Civil Liabilities” for additional information.
ii
MARKET AND INDUSTRY DATA
Unless otherwise indicated, information contained in this prospectus or incorporated into this prospectus by reference regarding the Company’s industry and the regions in which it operates, including market research, estimates, and forecasts, is based on information obtained from industry publications and reports and forecasts provided to the Company by third-party sources. In some cases, the Company does not expressly refer to the sources from which this information is derived. This information is subject to significant uncertainties and limitations and is based on assumptions and estimates that may prove to be inaccurate. Neither we nor the Selling Shareholder can guarantee the accuracy or completeness of any such information contained in this prospectus or incorporated into this prospectus by reference. You are therefore cautioned not to give undue weight to this information.
The Company has not independently verified the accuracy or completeness of any such information. Similarly, internal surveys, industry forecasts and market research, which the Company believes to be reliable based upon its management’s knowledge of the industry, have not been independently verified. While the Company believes that the market data, industry forecasts and similar information included in this prospectus are generally reliable, such information is inherently imprecise. In addition, assumptions and estimates of the Company’s future performance and growth objectives and the future performance of its industry and the markets in which it operates are necessarily subject to a high degree of uncertainty and risk due to a variety of factors, including those discussed under the headings “Risk Factors,” “Cautionary Note Regarding Forward-Looking Statements,” and “Management’s Discussion and Analysis of Financial Condition and Results of Operations” in this prospectus.
iii
FINANCIAL STATEMENT PRESENTATION
References to “U.S. dollars” and “US$” in this prospectus are to United States dollars, the legal currency of the United States. Discrepancies in any table between totals and sums of the amounts listed are due to rounding. Certain amounts and percentages have been rounded; consequently, certain figures may add up to be more or less than the total amount and certain percentages may add up to be more or less than 100% due to rounding. In particular and without limitation, amounts expressed in millions contained in this prospectus have been rounded to a single or two decimal places for the convenience of readers.
The historical financial statements of Namib Minerals are prepared in accordance with IFRS Accounting Standards, as issued by International Accounting Standards Board (“IFRS”). Namib Minerals’ fiscal year ends on December 31 of each year, as does its reporting year. Namib Minerals was incorporated on May 27, 2024, and its initial fiscal year ended on December 31, 2024. Namib Minerals’ most recent fiscal year ended on December 31, 2025. See Note 2 to Namib Minerals’ audited financial statements as of December 31, 2025, and 2024 and for each year in the three-year period ended December 31, 2025, included elsewhere in this prospectus, for a discussion of the basis of presentation of Namib Minerals’ financial statements.
iv
TECHNICAL MINING INFORMATION AND SPECIAL TERMS
Cautionary Note Regarding Presentation of Mineral Reserve and Mineral Resource Estimates
On October 31, 2018, the SEC adopted Subpart 1300 (17 CFR 229.1300) of Regulation S-K (“Regulation S-K 1300”), along with the amendments to related rules and guidance, in order to modernize the property disclosure requirements for mining registrants under the Securities Act and the Exchange Act. Registrants engaged in mining operations must comply with Regulation S-K 1300 for fiscal years beginning on or after January 1, 2022. Mineral resource and mineral reserve estimates were prepared by the Company based on available data at the time of calculation and are inherently uncertain, involve subjective judgment about many relevant factors and may be materially affected by, among other things, environmental, permitting, legal, title, taxation, socio-political, marketing, or other relevant risks, uncertainties, contingencies and factors. Until mineral deposits are actually mined and processed, mineral resources and mineral reserves must be considered as estimates only.
The Company owns three mines, of which only the How Mine is currently in commercial operation. There is no commercial production at the Mazowe Mine or the Redwing Mine, as each mine has been on care and maintenance since August 2018 and April 2019, respectively.
The Company has inferred, indicated, and measured mineral resources, and certain of the indicated and measured mineral resources are classified as probable and proven mineral reserves. An inferred mineral resource has a lower level of confidence than that of an indicated or measured mineral resource and may not be converted to a mineral reserve. You are cautioned that, except for that portion of mineral resources classified as mineral reserves, mineral resources do not have demonstrated economic viability. Specifically, inferred mineral resources have a high degree of uncertainty as to their existence and as to whether they can be economically or legally mined. Under Regulation S-K 1300, estimates of inferred mineral resources may not form the basis of an economic analysis. It cannot be assumed that all or any part of an inferred mineral resource will ever be upgraded to a higher category. Such upgrade would require a significant amount of exploration. Therefore, you are cautioned not to assume that all or any part of an inferred mineral resource can be economically or legally mined, or that it will ever be upgraded to a higher category. Likewise, you are cautioned not to assume that all or any part of measured or indicated mineral resources not already classified as mineral reserves will ever be upgraded to mineral reserves.
Special Mining Terms
“Assay” means chemical test performed on a sample of ores or minerals to determine the amount of valuable metals contained.
“BIF” means Banded Iron Formation.
“Carbon-in-plant” or “CIP” means gold is leached conventionally from a slurry of gold ore with cyanide in agitated tanks. The leached slurry passes into the CIP circuit where carbon granules are mixed with the slurry and gold is absorbed onto the carbon. The carbon granules are separated from the slurry and treated to remove gold.
“Care and maintenance” means the processes and conditions on a closed mine site where there is potential to recommence operations at a later date.
“Concentrate” means a clean product which has been upgraded sufficiently for downstream processing or sale.
“Contained gold” means the total gold or copper content (tons multiplied by grade) of the material being described.
“Cut-off grade” or “COG” means the grade (i.e., the concentration of metal or mineral in rock) that determines the destination of the material during mining. For purposes of establishing “prospects of economic extraction,” the cut-off grade is the grade that distinguishes material deemed to have no economic value (it will not be mined in underground mining or if mined in surface mining, its destination will be the waste dump) from material deemed to have economic value (its ultimate destination during mining will be a processing facility). Other terms used in similar fashion as cut-off grade include net smelter return, pay limit, and break-even stripping ratio.
“Cyanidation” means a method of extracting exposed gold grains from crushed or ground ore by dissolving it in a weak cyanide solution. May be carried out in tanks inside a mill or in heaps of ore out of doors.
v
“Decline” means an inclined underground access way.
“Deposit” means an informal term for an accumulation of mineralization or other valuable earth material of any origin.
“Development” means the process of accessing an orebody through shafts or tunneling in underground mining.
“Dilution” means unmineralized rock that is, by necessity, removed along with ore during the mining process that effectively lowers the overall grade of the ore.
“Diorite” means an igneous rock formed by the solidification of molten material (magma).
“Dyke” means a long and relatively thin body of igneous rock that, while in the molten state, intruded a fissure in older rocks.
“Economically viable” means, when used in the context of Mineral Reserve determination, that the Qualified Person has determined, using a discounted cash flow analysis, or has otherwise analytically determined, that extraction of the Mineral Reserve is economically viable under reasonable investment and market assumptions.
“Elution” means the removal of the gold from the activated carbon before the zinc precipitation stage.
“Exploration” means activities associated with ascertaining the existence, location, extent, or quality of mineralized material, including economic and technical evaluation of mineralized material.
“Feasibility Study” means a comprehensive technical and economic study of the selected development option for a mineral project that includes appropriately detailed assessments of applicable modifying factors together with any other relevant operational factors and detailed financial analysis that are necessary to demonstrate at the time of reporting that extraction is reasonably justified (economically mineable). The results of the study may reasonably serve as the basis for a final decision by a proponent or financial institution to proceed with, or finance, the development of the project. The confidence level of the study will be higher than that of a prefeasibility study.
“Flotation” means a concentration of gold and gold-hosting minerals into a small mass by various techniques (e.g. collectors, frothers, agitation, air-flow) that collectively enhance the buoyancy of the target minerals, relative to unwanted gangue, for recovery into an over-flowing froth phase.
“Footwall” means the underlying side of a fault, orebody or stope.
“Geological” means relating to the study of rocks which compose the earth.
“Grade” means the quantity of ore contained within a unit weight of mineralized material generally expressed in grams per metric tonne (g/t) or ounce per short ton for gold bearing material.
“Greenschist” means a schistose metamorphic rock whose green color is due to the presence of chlorite, epidote or actinolite.
“Indicated Mineral Resource” means that part of a Mineral Resource for which quantity, grade or quality, densities, shape and physical characteristics are estimated with sufficient confidence to allow the application of modifying factors in sufficient detail to support mine planning and evaluation of the economic viability of the deposit. Geological evidence is derived from adequately detailed and reliable exploration, sampling and testing and is sufficient to assume geological and grade or quality continuity between points of observation.
“Inferred Mineral Resource” means that part of a Mineral Resource for which quantity and grade or quality are estimated based on limited geological evidence and sampling. Geological evidence is sufficient to imply, but not verify, geological and grade or quality continuity. An Inferred Mineral Resource has a lower level of confidence than that applying to an Indicated Mineral Resource and must not be converted to a Mineral Reserve. It is reasonably expected that the majority of an Inferred Mineral Resource could be upgraded to an Indicated Mineral Resource with continued exploration.
“Initial assessment (also known as concept study, scoping study, conceptual study and preliminary economic assessment)” means a preliminary technical and economic study of the economic potential of all or parts of mineralization to support the disclosure of Mineral Resource. The initial assessment must be prepared by a Qualified
vi
Person and must include appropriate assessments of reasonably assumed technical and economic factors, together with any other relevant operational factors, that are necessary to demonstrate at the time of reporting that there are reasonable prospects for economic extraction. An initial assessment is required for disclosure of Mineral Resource but cannot be used as the basis for disclosure of Mineral Reserve.
“Level” means the workings or tunnels of an underground mine that are on the same horizontal plane.
“Life-of-mine” or “LOM” means number of years for which an operation is planning to mine and treat ore and is taken from the current mine plan.
“Measured Mineral Resource” means that part of a Mineral Resource for which quantity, grade or quality, densities, shape, and physical characteristics are estimated with confidence sufficient to allow the application of modifying factors to support detailed mine planning and final evaluation of the economic viability of the deposit. Geological evidence is derived from detailed and reliable exploration, sampling and testing and is sufficient to confirm geological and grade or quality continuity between points of observation. A Measured Mineral Resource has a higher level of confidence than that applying to either an Indicated or an Inferred Mineral Resource. It may be converted to either a Proven Mineral Reserve or a Probable Mineral Reserve.
“Measures” means conversion factors from metric units to U.S. units are provided below.
|
Metric Unit |
U.S. Equivalent |
|||
|
1 tonne |
= 1 t |
= 1.10231 short tons |
||
|
1 meter |
= 1 m |
= 3.28084 feet |
||
|
1 hectare |
= 1 ha |
= 2.47105 acres |
“Metallurgy” means the science and art of separating metals and metallic minerals from their ores by mechanical and chemical processes.
“Milling/mill” means the communition of the ore, although the term has come to cover the broad range of machinery inside the treatment plant where the gold is separated from the ore.
“Mineral” means a naturally occurring homogeneous substance having definite physical properties and chemical composition and, if formed under favorable conditions, a definite crystal form.
“Mineral Reserve” means the economically mineable part of a Measured and/or Indicated Mineral Resource. It includes diluting materials and allowances for losses, which may occur when the material is mined or extracted and is defined by studies at prefeasibility or feasibility level as appropriate that include application of modifying factors. Such studies demonstrate that, at the time of reporting, extraction could reasonably be justified. The reference point at which Mineral Reserves are defined, usually the point where the ore is delivered to the processing plant, must be stated. It is important that in all situations where the reference point is different, such as for a saleable product, a clarifying statement is included to ensure that the reader is fully informed as to what is being reported.
“Mineral Resource” means a concentration or occurrence of solid material of economic interest in or on the Earth’s crust in such form, grade or quality and quantity that there are reasonable prospects for eventual economic extraction. The location, quantity, grade, continuity and other geological characteristics of a Mineral Resource are known, estimated or interpreted from specific geological evidence and knowledge, including sampling.
“Mineralization” means the presence of a target mineral in a mass of host rock.
“Modifying Factors” means considerations used to convert Mineral Resources to Mineral Reserves. These include, but are not restricted to, mining, processing, metallurgical, infrastructure, economic, marketing, legal, environmental, social, and governmental factors.
vii
“MSZ” means Mineralized Shear Zones.
“Mt” or “tonne” means metric tonne, a metric measurement of weight equivalent to 1,000 kilograms or 2,204.6 pounds.
“Ore” means a mixture of mineralized material from which at least one of the contained minerals can be mined and processed at an economic profit.
“Orebody” means a well-defined mass of mineralized material of sufficient mineral content to make extractions economically viable.
“Ounce” means one Troy ounce, which equals 31.1035 grams.
“Prefeasibility Study” means a comprehensive study of a range of options for the technical and economic viability of a mineral project that has advanced to a stage where a preferred mining method, in the case of underground mining, or the pit configuration, in the case of an open-pit, is established and an effective method of mineral processing is determined. It includes a financial analysis based on reasonable assumptions on the modifying factors and the evaluation of any other relevant factors which are sufficient for a competent person, acting reasonably, to determine if all or part of the Mineral Resource may be converted to a Mineral Reserve at the time of reporting. A prefeasibility study is at a lower confidence level than a feasibility study.
“Probable Mineral Reserve” means the economically mineable part of an Indicated, and in some circumstances, a Measured Mineral Resource. The confidence in the modifying factors applying to a Probable Mineral Reserve is lower than that applying to a Proven Mineral Reserve.
“Productivity” means an expression of labor productivity based on the ratio of ounces of gold produced per month to the total number of employees in mining operations.
“Proven Mineral Reserve” means the economically mineable part of a Measured Mineral Resource. A Proven Mineral Reserve implies a high degree of confidence in the modifying factors.
“QP” or “Qualified Person” means, in respect of the Company’s material properties, is an individual who is (1) a mineral industry professional with at least five years of relevant experience in the type of mineralization and type of deposit under consideration and in the specific type of activity that person is undertaking on behalf of the registrant; and (2) an eligible member or licensee in good standing of a recognized professional organization at the time the technical report is prepared. Regulation S-K 1300 details further recognized professional organizations and also relevant experience.
“Quartz” means a mineral compound of silicon and oxygen.
“Recovered grade” means the recovered mineral content per unit of ore treated.
“Reef” means a gold-bearing sedimentary horizon, normally a conglomerate band, which may contain economic levels of gold.
“Regulation S-K 1300” means the Subpart 1300 of Regulation S-K (17 CFR § 229.1300) which contains the SEC’s mining property disclosure requirements for mining registrants.
“Run-of mine” or “ROM” means the unprocessed mined material which consists of the rock, minerals, middlings, contamination, and impurities.
“Sampling” means taking small pieces of rock at intervals along exposed mineralization for assay (to determine the mineral content).
“SAMREC (2016)” means South African Code for the Reporting of Exploration Results, Mineral Resources and Mineral Reserves 2016 edition.
viii
“Shaft” means a structure that provides principal access to the underground workings for transporting personnel, equipment, supplies, ore and waste. A shaft is also used for ventilation and as an auxiliary exit. It is equipped with a surface hoist system that lowers and raises conveyances for men, material, and ore in the shaft. A shaft generally has more than one conveyancing compartment.
“Smelting” means a thermal processing whereby molten metal is liberated from beneficiated mineral or concentrate with impurities separating as lighter slag.
“Stockpile” means a store of unprocessed ore.
“Stope” means the underground excavation within the orebody where the main gold production takes place.
“Strike” means the direction, or bearing from true north, of a vein or rock formation measured on a horizontal surface.
“Tailings” means finely ground rock of low residual value from which valuable minerals have been extracted is discarded and stored in a designed dam facility.
“Tonnage” means quantities where the ton or tonne is an appropriate unit of measure. Typically used to measure reserves of gold-bearing material in situ or quantities of ore and waste material mined, transported or milled.
“Trend” means the arrangement of a group of ore deposits or a geological feature or zone of similar grade occurring in a linear pattern.
“Underground mining” means the extraction of rocks, minerals and industrial materials, other than coal, oil and gas, from the earth by developing entries or shafts from the surface to the seam or deposit before recovering the product by underground extraction methods.
“Waste” means material that contains insufficient mineralization for consideration for future treatment and, as such, is discarded.
“Yield” means the actual grade of ore realized after the mining and treatment process.
ix
FREQUENTLY USED TERMS
In this document:
“BMC” means Bulawayo Mining Company Limited, a private company incorporated under the laws of England and Wales.
“Business Combination” means the transactions contemplated by the Business Combination Agreement.
“Business Combination Agreement” means the Business Combination Agreement, dated as of June 17, 2024, as amended, and as may be further amended, by and among Red Rock, Greenstone, the Company, SPAC Merger Sub, and Greenstone Merger Sub.
“Cayman Islands Companies Act” means the Companies Act (As Revised) of the Cayman Islands.
“Closing” means the consummation of the Business Combination.
“Closing Date” means June 5, 2025.
“Code” means the Internal Revenue Code of 1986, as amended.
“Company” or “Namib Minerals” means Namib Minerals, an exempted company limited by shares incorporated under the laws of the Cayman Islands.
“Company Board” means the board of directors of the Company.
“Company Organizational Documents” means the second amended and restated memorandum and articles of association of the Company, as amended, modified, or supplemented from time to time.
“Continental” means Continental Stock Transfer & Trust Company, a limited purpose trust company, as the Company’s transfer agent and warrant agent.
“COVID-19” means the novel coronavirus known as SARS-CoV-2 or COVID-19, and any evolutions, mutations thereof or related or associated epidemics, pandemic, or disease outbreaks.
“Daily VWAP” means, for any Trading Day, the per share volume-weighted average price of the Ordinary Shares as displayed under the heading “Bloomberg VWAP” on the Bloomberg page for the Company (or, if such page is not available, its equivalent successor page) in respect of the period from the scheduled open of trading until the scheduled close of trading of the primary trading session on such Trading Day (or, if such volume-weighted average price is unavailable, the market value of one Ordinary Shares on such Trading Day, determined, using a volume-weighted average price method, by a nationally recognized independent investment banking firm selected by the Selling Shareholder). The Daily VWAP will be determined without regard to after-hours trading or any other trading outside of the regular trading session.
“DRC” means the Democratic Republic of Congo.
“Earnout Period” means the period between the Closing Date and the eighth (8th) anniversary of the Closing Date.
“Earnout Shares” means up to 30,000,000 Ordinary Shares that may be issued by the Company to the Former Greenstone Shareholders during the Earnout Period pursuant to the terms of the Business Combination Agreement.
“Exchange Act” means the Securities Exchange Act of 1934, as amended.
“Fidelity” means Fidelity Gold Refinery (Private) Limited, a company which is controlled by the Zimbabwean authorities.
“Former Greenstone Shareholders” means the holders of Greenstone’s ordinary shares immediately prior to the Business Combination.
“Founder Shares” mean the Class B common stock of Red Rock, par value $0.0001 per share.
x
“Greenstone” means Greenstone Corporation, an exempted company limited by shares incorporated under the laws of the Cayman Islands.
“Greenstone Merger Sub” means Cayman Merger Sub Ltd., an exempted company limited by shares incorporated under the laws of the Cayman Islands and previously a direct wholly-owned subsidiary of the Company prior to the Business Combination.
“HCG” means Hennessy Capital Group LLC, a Delaware limited liability company.
“How Mine” means the gold mine that is owned and operated by the How Mining Company in the entire mining area under the How Mine Lease, being the mining operations, the gold processing plant operations, and all operations and activities incidental thereto and related infrastructure established to access and mine minerals.
“How Mine Lease” means the mining lease by and between the Mining Affairs Board of Zimbabwe and the How Mining Company.
“How Mining Company” means Bulawayo Mining Company (Private) Limited, a Zimbabwe private limited company.
“IASB” means the International Accounting Standards Board.
“IFRS” means the International Financial Reporting Standards, as issued by the International Accounting Standards Board.
“Initial Shareholders” mean holders of Founder Shares before the Business Combination, which include (i) the SPAC Sponsor, with such limited liability company member interests being beneficially owned by Daniel J. Hennessy and Thomas D. Hennessy, the son of Daniel J. Hennessy, as the managing members of HCG, (ii) Anna Brunelle, (iii) Sidney Dillard, (iv) Walter Roloson, (v) John Zimmerman, and (vi) Rick Fearon.
“IPO” means Red Rock’s initial public offering of its units, consummated on October 1, 2021.
“Khumalo” means Mzilikazi Godfrey Khumalo.
“Mazowe Mine” means the gold mine being, and to be, redeveloped, constructed, owned and operated by the Mazowe Mining Company in the entire mining area under the Mazowe Mine Lease, being the mining operations, the gold processing plant operations, and all operations and activities incidental thereto and related infrastructure established to access and mine minerals.
“Mazowe Mine Lease” means the mining lease by and between the Mining Affairs Board of Zimbabwe and the Mazowe Mining Company.
“Mazowe Mining Company” means Mazowe Mining Company (Private) Limited, a Zimbabwe private limited company (formerly known as Gold Fields of Mazowe (Private) Limited).
“Nasdaq” means The Nasdaq Stock Market LLC.
“PCAOB” means the Public Company Accounting Oversight Board and any division or subdivision thereof.
“Polar” means Polar Multi-Strategy Master Fund.
“Polar Shares” means 880,000 Ordinary Shares that were issued to Polar in a private placement pursuant to the Polar Subscription Agreements.
“Polar Subscription Agreements” means (1) a certain subscription agreement, dated October 13, 2023, by and among Red Rock, HCG, the SPAC Sponsor and Polar (“Polar Subscription Agreement I”) and (2) a certain subscription agreement, dated January 16, 2024, by and among Red Rock, the SPAC Sponsor, Daniel J. Hennessy and Polar (“Polar Subscription Agreement II”).
“Promissory Note” means that certain Amended and Restated Promissory Note, dated December 9, 2025, with a face value of $3.5 million, issued by the Company to the Selling Shareholder.
“RBZ” means the Reserve Bank of Zimbabwe.
xi
“Red Rock” or “SPAC” means Red Rock Acquisition Corporation, a Delaware corporation formerly known as Hennessy Capital Investment Corp. VI.
“Redwing Mine” means the gold mine being, and to be, redeveloped, constructed, owned, and operated by the Redwing Mining Company in the entire mining area under the Redwing Mine Lease, being the mining operations, the gold processing plant operations, and all operations and activities incidental thereto, and related infrastructure established to access and mine minerals.
“Redwing Mine Lease” means the mining lease between the Mining Affairs Board of Zimbabwe and the Redwing Mining Company.
“Redwing Mining Company” means Redwing Mining Company (Private) Limited, a Zimbabwe private limited company.
“Registration Rights and Lock-up Agreement” means that certain registration rights and lock-up agreement, dated June 5, 2025, by and among Namib Minerals, Red Rock, the Initial Shareholders and the other securityholders party thereto.
“RTG” means the Zimbabwe dollar.
“Sarbanes-Oxley Act” means the Sarbanes-Oxley Act of 2002, as amended.
“SEC” means the U.S. Securities and Exchange Commission.
“Securities Act” means the Securities Act of 1933, as amended.
“SPAC Merger Sub” means Midas SPAC Merger Sub Inc., a Delaware corporation and previously a direct wholly-owned subsidiary of the Company prior to the Business Combination.
“SPAC Warrant Agreement” means the warrant agreement, dated as of September 28, 2021, by and between Red Rock and Continental, as amended on April 14, 2025.
“SPAC Sponsor” means Hennessy Capital Partners VI LLC, a Delaware limited liability company.
“Trading Day” means a day on which trading in the Ordinary Shares generally occurs on the principal U.S. national or regional securities exchange on which the Ordinary Shares are then listed or, if the Ordinary Shares are not then listed on a U.S. national or regional securities exchange, on the principal other market which the Ordinary Shares are then traded.
“Trading Volume” means, for any Trading Day, the daily trading volume for the Ordinary Shares, as reported by Bloomberg on such Trading Day.
“Warrant” means a warrant (i.e., a stock acquisition right) to purchase one Ordinary Share pursuant to the terms of the Warrant Agreement.
“Warrant Agreement” means the SPAC Warrant Agreement as modified by the Warrant Assumption Agreement.
“Warrant Assumption Agreement” means the Warrant Assumption Agreement, dated June 5, 2025, by and among the Company, Red Rock, and Continental.
“ZiG” means Zimbabwe Gold, the official currency of Zimbabwe.
xii
CAUTIONARY NOTE REGARDING FORWARD-LOOKING STATEMENTS
This prospectus, including, without limitation, statements under the headings “Business” and “Management’s Discussion and Analysis of Financial Condition and Results of Operations,” includes forward-looking statements within the meaning of Section 27A of the Securities Act and Section 21E of the Exchange Act. These forward-looking statements can generally be identified by the use of forward-looking terminology, including the terms “anticipates,” “believes,” “continues,” “could,” “estimates,” “forecasts,” “intends,” “expects,” “may,” “plans,” “predicts,” “projects,” “proposes,” “seeks,” “should,” “targets” or “will” or, in each case, their negative or other variations or comparable terminology. These forward-looking statements include all matters that are not historical facts.
The forward-looking statements in this prospectus are based on information available as of the date of this prospectus and are inherently subject to uncertainties and changes in circumstance and their potential effects and speak only as of the date of such statement. There can be no assurance that future developments will be those that have been anticipated. These forward-looking statements are not guarantees of future performance, conditions or results, and involve a number of known and unknown risks, uncertainties, assumptions and other important factors, many of which are outside the control of the Company, that could cause actual results or outcomes to differ materially from those discussed in the forward-looking statements. These risks and uncertainties include, but are not limited to, those factors described in the section entitled “Risk Factors” and the following important factors:
• market risks, including the price of gold;
• the outcome of any legal proceedings that may be instituted against the Company or any of its subsidiaries related to the Business Combination;
• the outcome of any legal proceedings relating to Greenstone’s purchase of Bulawayo Mining Company Limited, which owns all of the Company’s mines, from Metallon Corporation Limited;
• failure to realize the anticipated benefits of the Business Combination;
• the inability to maintain the listing of the Company’s securities on Nasdaq;
• the inability to remediate the identified material weaknesses in the Company’s internal control over financial reporting, which, if not corrected, could adversely affect the reliability of the Company’s financial reporting;
• the risk that the price of the Company’s securities may be volatile due to a variety of factors, including changes in the highly competitive industries in which the Company plans to operate, variations in performance across competitors, changes in laws, regulations, technologies, natural disasters or health epidemics/pandemics, national security tensions, macro-economic and social environments affecting its business, and changes in the combined capital structure;
• the inability to implement business plans, forecasts, and other expectations, identify and realize additional opportunities, and manage the Company’s growth and expanding operations;
• the risk that the Company may not be able to successfully develop its assets, including expanding the How Mine, restarting and expanding its other mines in Zimbabwe, or acquire and develop mining interests in the DRC;
• the risk that the Company will be unable to raise additional capital to execute its business plan, which may not be available on acceptable terms or at all;
• political and social risks of operating in Zimbabwe and the DRC; and
• the operational hazards and risks that the Company faces.
xiii
The risks outlined above and others described under the section entitled “Risk Factors” are not exhaustive. In addition, as a result of a number of known and unknown risks and uncertainties, including those listed above, the Company’s actual results or performance may be materially different from those expressed or implied by certain forward-looking statements. Should one or more of these risks or uncertainties materialize or should any of the assumptions made by the management team of the Company prove incorrect, actual results may vary in material respects from those projected in these forward-looking statements.
Forward-looking statements reflect current beliefs and are based on information currently available as of the date a forward-looking statement is made. Accordingly, forward-looking statements set forth herein speak only as of the date of this Report.
The Company does not undertake any obligation to revise forward-looking statements to reflect future events, changes in circumstances, or changes in beliefs. In the event that any forward-looking statement is updated, no inference should be made that the Company will make additional updates with respect to that statement, related matters, or any other forward-looking statements.
xiv
PROSPECTUS SUMMARY
This summary highlights selected information contained elsewhere in this prospectus and does not contain all of the information you should consider when making your investment decision. Before investing in our securities, you should carefully read this entire prospectus, including our financial statements and the related notes included in this prospectus and the information set forth under the headings “Risk Factors” and “Management’s Discussion and Analysis of Financial Condition and Results of Operations.” See also the section entitled “Where You Can Find More Information.” The definition of some of the terms used in this prospectus are set forth under the section “Frequently Used Terms.” Unless the context otherwise requires, we use the terms “Namib Minerals,” “Company,” “we,” “us” and “our” in this prospectus to refer to Namib Minerals and its consolidated subsidiaries.”
Overview
We are an established gold producer with an attractive portfolio of three gold mines in Zimbabwe, Africa. Our extensive track record of owning and operating gold mines spans over two decades, and our strategic footprint consists of one producing gold mine and two historically producing gold mines that we are currently positioning to restart operations. Our How Mine is an established underground gold mine with a strong track record of operations having produced an aggregate of approximately 1.84Moz of gold from 1941 through December 31, 2025. Our other principal assets, the Mazowe Mine and the Redwing Mine, are historically producing gold mines with significant mineral resources. These assets provide us with an identified pathway to operate as a multi-asset gold producer in Africa, as preparatory work is currently underway to restart operations at both mines. On a consolidated basis, combining our estimate as of December 31, 2025 for the How Mine and our estimates as of December 31, 2023 for the Mazowe Mine and the Redwing Mine, our underground measured and indicated gold resources (exclusive of reserves) totaled 2.5Moz at a grade of 2.26g/t Au and our underground inferred gold resources totaled 4.4Moz. We are also evaluating opportunities to acquire mining interests in, and expand our operations to, the Democratic Republic of Congo (“DRC”) to unlock critical battery metals in the region. For additional information regarding our business, see “Business.”
Corporate Information
The legal name of the Company is “Namib Minerals.” The Company was incorporated under the laws of the Cayman Islands on May 27, 2024 as an exempted company limited by shares with registration number 410406, having its registered office and mailing address for its principal executive office at Appleby Global Services (Cayman) Limited, Suite 210, 2nd Floor, Windward III, Regatta Office Park, PO Box 500, Grand Cayman, Cayman Islands, KY1-1106, and its telephone number is (345) 769-4909. Our principal website is https://www.namibminerals.com/. The information contained on, or that can be accessed through, our website is not incorporated by reference into, and is not a part of, this prospectus or the registration statement of which it forms a part.
1
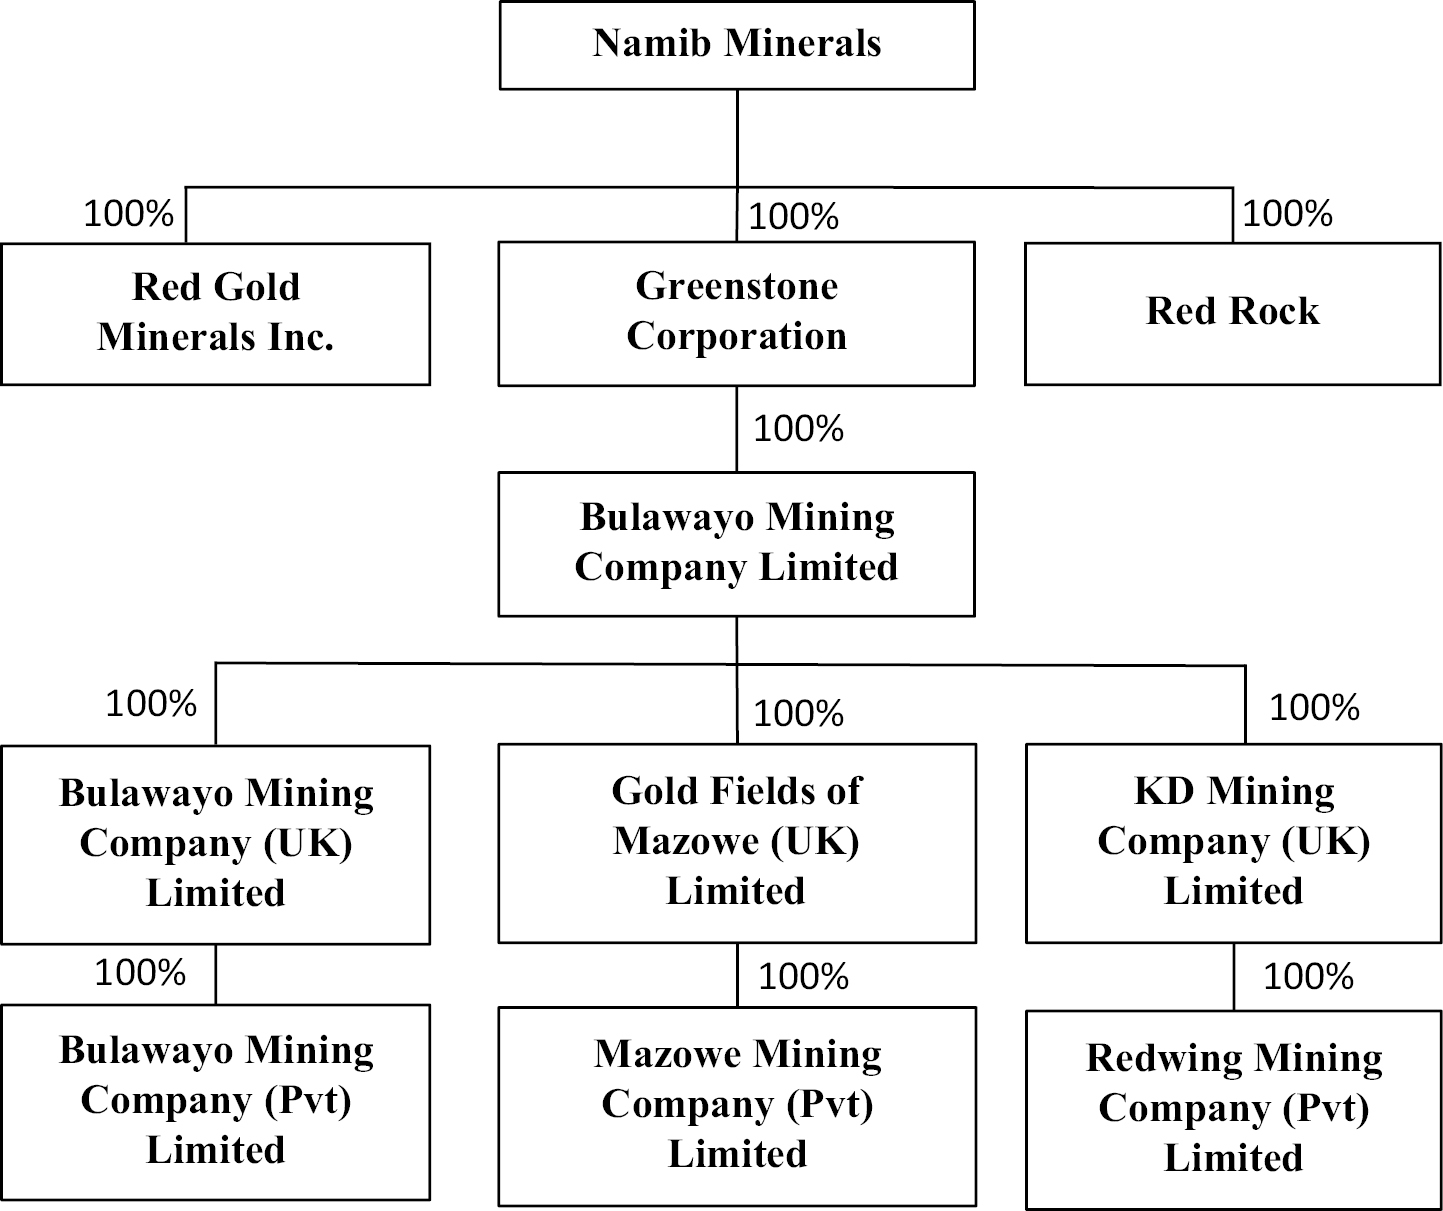
The following depicts our organizational structure.
Emerging Growth Company
We qualify as an “emerging growth company” as defined in the Jumpstart Our Business Startups Act of 2012 (the “JOBS Act”). For so long as we remain an emerging growth company, we are permitted, and currently intend, to rely on the following provisions of the JOBS Act that contain exceptions from disclosure and other requirements that otherwise are applicable to public companies and file periodic reports with the SEC. These provisions include, but are not limited to:
• the option to present only two years of audited financial statements and selected financial data and only two years of related “Management’s Discussion and Analysis of Financial Condition and Results of Operations” in our periodic reports and registration statements, including this prospectus, subject to certain exceptions;
• not being required to comply with the auditor attestation requirements of Section 404 of the Sarbanes-Oxley Act; and
• not being required to comply with any requirement that may be adopted by the PCAOB regarding mandatory audit firm rotation or a supplement to the auditor’s report providing additional information about the audit and the financial statements.
We will cease to be an “emerging growth company” upon the earliest to occur of: (i) the last day of the fiscal year in which we have more than $1.235 billion in annual revenue; (ii) the date we qualify as a large accelerated filer, with at least $700.0 million of equity securities held by non-affiliates; (iii) the date on which we have, in any three-year period, issued more than $1.0 billion in non-convertible debt securities; and (iv) December 31, 2030 (the last day of the fiscal year following the fifth anniversary of the Closing).
We have elected to take advantage of certain of the reduced disclosure obligations in this prospectus and may elect to take advantage of other reduced reporting requirements in our future filings with the SEC. As a result, the information that we provide to our stockholders may be different than what you might receive from other public reporting companies in which you hold equity interests.
2
Foreign Private Issuer
We report under the Exchange Act as a non-U.S. company with foreign private issuer status. Under Rule 405 of the Securities Act, the determination of foreign private issuer status is made annually on the last business day of an issuer’s most recently completed second fiscal quarter and, accordingly, the next determination will be made with respect to us on June 30, 2026. For so long as we qualify as a foreign private issuer, we will be exempt from certain provisions of the Exchange Act that are applicable to U.S. domestic public companies, including:
• the rules under the Exchange Act requiring the filing of quarterly reports on Form 10-Q, current reports on Form 8-K with the SEC or annual reports on Form 10-K;
• the sections of the Exchange Act regulating the solicitation of proxies, consents, or authorizations in respect of a security registered under the Exchange Act; and
• the selective disclosure rules by issuers of material nonpublic information under Regulation Fair Disclosure, or Regulation FD, which regulates selective disclosure of material non-public information by issuers
We may take advantage of these exemptions until such time as we are no longer a foreign private issuer. We would cease to be a foreign private issuer at such time as more than 50% of our outstanding voting securities are held by U.S. residents and any of the following three circumstances applies: (i) the majority of our executive officers or directors are U.S. citizens or residents, (ii) more than 50% of our assets are located in the United States or (iii) our business is administered principally in the United States. See “Management — Foreign Private Issuer Exemption.”
In addition, as a foreign private issuer, the Company is permitted to follow certain Cayman Islands corporate governance practices in lieu of certain corporate governance rules of Nasdaq. However, the Company currently plans to follow the corporate governance requirements of Nasdaq.
Controlled Company
The SelliBen Trust owns approximately 63% of the issued and outstanding Ordinary Shares. As a result, the Company qualifies as a “controlled company” as defined under the corporate governance rules of Nasdaq, because the SelliBen Trust beneficially owns greater than 50% of the total voting power of all issued and outstanding Ordinary Shares. Under the applicable Nasdaq rules, a controlled company may elect not to comply with certain corporate governance requirements, including the requirement that a majority of its directors be independent and the requirement that the compensation committee and nominating and corporate governance committee consist entirely of independent directors. The Company currently does not intend to rely on these exemptions. However, if the Company decides to rely on exemptions applicable to controlled companies under the Nasdaq rules in the future, its shareholders will not have the same protections afforded to shareholders of companies that are subject to all of the Nasdaq corporate governance requirements. See “Management — Controlled Company.”
Risk Factor Summary
You should consider all of the information contained in this prospectus before investing in our securities which involves substantial risk. Our business is subject to numerous risks and uncertainties, including those highlighted in the section entitled “Risk Factors” beginning on page 7 of this prospectus, that represent challenges that we face in connection with the successful implementation of our strategy and the growth of our business. The occurrence of one or more of the events or circumstances described in the section entitled “Risk Factors,” alone or in combination with other events or circumstances, may have a material adverse effect on our business, cash flows, financial condition and results of operations. Important factors and risks that could cause actual results to differ materially from those in the forward-looking statements include, among others, the following:
Risks Related to Our Business, Operations and Industry
• We are subject to risks related to the development of existing and new mining projects that may adversely affect our results of operations and profitability.
• We require significant additional capital to fund our business, and no assurance can be given that such capital will be available at all or available on terms acceptable to us.
3
• Our Mineral Resource and Mineral Reserve estimates may be materially different from mineral quantities we may ultimately recover, our life-of-mine estimates may prove inaccurate, and changes in operating and capital costs may render mineral resources uneconomic to mine.
• Mining is inherently hazardous and the related risks of events that cause disruptions to our mining operations may adversely impact the environment or the health, safety, or security of our workers or the local community, production, cash flows, and overall profitability.
• Our assets and operations are subject to political, economic, and other uncertainties as a result of being located in Zimbabwe.
• Fluctuating foreign currency and exchange rates as well as Zimbabwean exchange controls may negatively impact our business, results of operations, and financial position.
• The price of gold is subject to volatility and may have a significant effect on our future activities and profitability.
• Our operations are vulnerable to infrastructure constraints, including power and water supply.
• We derive all of our revenues from the sale of gold to one company which is controlled by the Zimbabwean authorities. There is no assurance that such counterparty may not default in such obligation causing us to incur a financial loss.
• Our rights to mine in Zimbabwe are derived from each of the How Mine Lease, the Mazowe Mine Lease, and the Redwing Mine Lease, the loss of which would have a material adverse effect on our financial condition and results of operations.
• Since operations at our Mazowe Mine and Redwing Mine were halted in 2018 and 2019, respectively, we have been subject to litigation regarding disputed debts and corporate rescue proceedings pursuant to Zimbabwean insolvency laws.
• Greenstone’s purchase of the Mazowe Mine, the Redwing Mine, and the How Mine from Metallon may be subject to potential claims that may have a material adverse effect on the Company’s assets and operations.
Risks Related to Cybersecurity
• Cybersecurity breaches and other disruptions or failures in our information technology systems could compromise our information, result in the unauthorized disclosure of confidential supplier, employee, and Company information, damage our reputation, and expose us to liability.
Risks Related to Laws and Regulations
• Our operations are subject to various government approvals, permits, licenses, and legal regulation for which no assurance can be provided that such approvals, permits, or licenses will be obtained or if obtained will not be revoked or suspended.
• Failure to comply with the U.S. Foreign Corrupt Practices Act and similar laws in Zimbabwe and elsewhere associated with our activities could subject us to penalties and other adverse consequences.
Risks Related to the Ownership of Our Securities and General Matters
• There can be no assurance that we will be able to maintain compliance with the continued listing standards of Nasdaq over time.
• Future sales or resales of a substantial number of our Ordinary Shares, or the perception in the market that the holders of a large number of Ordinary Shares intend to sell shares, could reduce the market price of our Ordinary Shares.
• The Company incurs additional costs as a result of operating as a public company, and its management devotes substantial time to ongoing compliance requirements.
4
• The SelliBen Trust owns the majority of our issued and outstanding Ordinary Shares, which provides it the right to appoint a majority of the members of the Company Board. Accordingly, its interests may conflict with those of our other shareholders, which may have the effect of delaying or preventing a change in control.
• We do not intend to pay cash dividends for the foreseeable future and, as a result, your ability to achieve a return on your investment will depend on appreciation in the price of our Ordinary Shares.
• We are a holding company. Our only significant asset is our ownership of 100% of the securities of Greenstone, and we will accordingly be dependent on distributions from Greenstone and its subsidiaries to meet our financial obligations and to pay dividends, if any.
• We have identified material weaknesses in our internal control over financial reporting. If we are unable to remediate these material weaknesses, or if we identify additional material weaknesses in the future, or we otherwise fail to implement and maintain an effective system of internal controls, we may be unable to accurately or timely report our results of operations or prevent fraud, and investor confidence and the market price of our Ordinary Shares may be materially and adversely affected.
• As an “emerging growth company” within the meaning of the Securities Act and the Exchange Act, we may take advantage of certain exemptions from disclosure requirements available to emerging growth companies, which may make our securities less attractive to investors and more difficult to compare our performance to the performance of other public companies.
Risks Related to an Investment in a Cayman Company and the Company’s Status as a Foreign Private Issuer
• As a foreign private issuer, we are exempt from a number of U.S. securities laws and rules promulgated thereunder and will be permitted to publicly disclose less information than U.S. public companies must. This may limit the information available to holders of our Ordinary Shares.
• Your ability to protect your rights through U.S. courts may be limited as we are incorporated under the law of the Cayman Islands. We conduct substantially all of our operations, and half of our directors and executive officers reside, outside of the United States.
5
THE OFFERING
Resale of Ordinary Shares
|
Ordinary Shares offered by the Selling Shareholder |
|
|
|
Terms of the offering |
The Selling Shareholder will determine when and how it will dispose of the Ordinary Shares registered for resale under this prospectus. See “Plan of Distribution.” |
|
|
Use of proceeds |
We will not receive any of the proceeds from the sale of Ordinary Shares by the Selling Shareholder. |
|
|
Nasdaq ticker symbol |
Our Ordinary Shares are listed for trading on the Nasdaq Global Market under the symbol “NAMM.” |
|
|
Risk factors |
Any investment in the Ordinary Shares offered hereby is speculative and involves a high degree of risk. You should carefully consider the information set forth under “Risk Factors” and elsewhere in this prospectus. |
6
RISK FACTORS
Investing in our securities involves risks. In considering purchasing our securities, you should carefully consider the following information about these risks, as well as the other information included in this prospectus. The risks and uncertainties described below are those significant risk factors, currently known and specific to us, that we believe are relevant to an investment in our securities. Additional risks and uncertainties not presently known to us or that we currently deem immaterial may also harm us and adversely affect our securities The occurrence of one or more of the events or circumstances described in these risk factors, alone or in combination with other events or circumstances, may have a material adverse effect on our business, reputation, revenue, financial condition, results of operations, and future prospects, in which event the market price of our securities could decline, and you could lose part or all of your investment.
Risks Related to Our Business, Operations and Industry
We are subject to risks related to the development of existing and new mining projects that may adversely affect our results of operations and profitability.
Development of our existing and new mining projects may be subject to unexpected problems, costs, and delays that could impact our ability to develop or operate the relevant project as planned. For example, constraints on the supply of mining and processing equipment, increases in capital and operating costs, or reduced availability of utilities could result in delays in completing projects.
We are currently engaged in further development activities at the How Mine, the Mazowe Mine, and the Redwing Mine. The Mazowe Mine and the Redwing Mine are currently under care and maintenance and work is currently underway to restart operations there. Estimates and targets for future production at these sites are based on technical expertise, historical production, mining plans, and an understanding of the orebody of each and are subject to change. Production estimates and production targets are subject to risks associated with our mining operations and, as a result, no assurance can be given that future production estimates or targets will be achieved. Actual production may vary from estimated or targeted production for reasons which we may not be able to control.
Ultimately, we may prove unable to successfully operate existing mine sites, restart our Mazowe Mine and Redwing Mine which have paused operations since 2018 and 2019, respectively, or to develop potential exploration sites due to, for example, unanticipated variations in mined tonnages and geological conditions, accident, plant and equipment breakdown, expiration of useful life, obsolescence, replacement, changes in metal prices, changes in the cost and supply of inputs, social and community opposition, vandalism, theft, destruction, encroachment, title challenges, litigation, governmental regulatory or administrative proceedings, changes in applicable regulations or other requirements, the classification of land covered by mining titles as an environmentally-protected area, ore body grades, the inability of any such project to meet our investment hurdle rate, and delays or the inability of obtaining or renewing permits. For example, while our Mazowe Mine and Redwing Mine have been under care and maintenance programs, many of the related operational permits have expired and will need to be renewed or reissued before commercial operations may resume. Failure to comply with these requirements could result in enforcement proceedings, claims, suspension of operations, community protest and/or additional capital or operating expenditures that could adversely impact our financial condition or reputation. The remote location of mining properties, delays in obtaining or failure to obtain necessary environmental and other governmental permits and approvals, the impact of public health crises, epidemics or pandemics (for example, the Mpox epidemic, particularly in Africa, and the COVID-19 pandemic) as well as third-party legal challenges to individual mining projects and broader social or political opposition to mining may increase the cost, timing and complexity of mine development and construction.
Accordingly, our future development activities may not result in the expansion or replacement of current production, or one or more production sites or facilities may not be developed as planned or may be less profitable than anticipated or even be loss-making. A failure in our ability to develop and operate mining projects in accordance with, or in excess of, expectations could negatively impact its results of operations, as well as its financial condition and prospects.
7
We require significant additional capital to fund our business, and no assurance can be given that such capital will be available at all or available on terms acceptable to us.
We require a substantial amount of capital to progress and develop our metals mining business. Mining requires a substantial amount of capital in order to identify and delineate mineral resources through geological mapping and drilling, identify geological features that may prevent or restrict the extraction of ore, construct extraction and processing facilities, expand production capacity, replenish reserves, purchase, maintain and improve assets, equipment, buildings, plants and other infrastructure, comply with legal or regulatory requirements or industry standards, and meet unexpected liabilities. Large amounts of capital are required to implement projects, and long-term production and processing require both significant capital expenditures and ongoing maintenance and working capital expenditures.
A substantial amount of capital will be required to restart the Mazowe Mine and the Redwing Mine, which have been in care and maintenance and not operational since 2018 and 2019, respectively, and expand such historical operations, including plant processing capacity. Such capital expenditures are anticipated to include expenditures for feasibility studies, upgrading infrastructure, pumping out water that has flooded a portion of the mines, environmental assessments, procuring and restoring equipment, and recommencing commercial operations. These capital expenditures do not include any taxes or other required payments outstanding from the Mazowe Mine and the Redwing Mine being placed in care and maintenance, such as social program funding obligations. We also expect to materially increase our capital expenditures to support the growth in our business and operations at our How Mine. We may also require additional capital to fund potential acquisitions in the DRC or elsewhere going forward.
Our business is based on, among other things, expectations as to future capital expenditures, and if we are unable to fund those capital expenditures, as a result of our operations being unable to generate sufficient cash flow or as a result of difficulties in raising debt or equity funding on acceptable terms or at all, we will not be able to recommence operations of the Redwing Mine and the Mazowe Mine at the planned capacity, or at all, or be able to develop future capital projects. In addition, we may be unable to develop new capital projects to continue production at cost-effective levels. Furthermore, any such reduction in capital expenditures may cause us to forgo some of the benefits of any future increases in commodity prices, as it is generally costly or impossible to resume production immediately or complete a deferred expansionary capital expenditure project.
As of December 31, 2025, we had cash and cash equivalents of $1.9 million and negative working capital of $(37.4) million.
It is possible that we will borrow money to finance future capital expenditures or for other uses. Our capital expenditures financed by borrowing may increase our leverage and make it more difficult for us to satisfy our obligations, limit our ability to obtain additional financing to operate our business, or require us to dedicate a substantial portion of our cash flow to make payments on our debt. This may reduce our ability to use our cash flow to fund working capital, capital expenditures, and other general corporate requirements.
Any future debt we incur and other agreements we enter into may contain, among other provisions, covenants that restrict our ability to finance future operations or capital needs or to engage in other business activities. Given the long-term nature of such agreements, these covenants and restrictions may present a material constraint on our operational and strategic flexibility and may preclude us from entering into strategic transactions that would be beneficial to us. A breach of any of these covenants could result in an event of default under the relevant agreement, and any such event of default or resulting acceleration under such agreements could result in an event of default under other agreements.
Our Mineral Resource and Mineral Reserve estimates may be materially different from mineral quantities we may ultimately recover, our life-of-mine estimates may prove inaccurate, and changes in operating and capital costs may render mineral resources uneconomic to mine.
We have reported our mineral resources in accordance with the requirements of the Modernization of Property Disclosures for Mining Registrants set forth in Regulation S-K 1300. There are numerous uncertainties inherent in estimating quantities of mineral resources and in projecting potential future mineral reserves and rates of mineral production, including many factors beyond our control. The accuracy of any mineral resource and mineral reserves estimate is a function of a number of factors, including the quality of the methodologies employed, the quality and quantity of available data and geological interpretation and judgment, and is also dependent on economic conditions, such as commodity prices and exchange rates, and market prices being generally in line with estimates.
8
Furthermore, estimates of different geologists and mining engineers may vary, and results of our mining and production subsequent to the date of an estimate may lead to revision of estimates due to, for example, fluctuations in the market price of ores and metals, reduced metal recovery or increased production costs due to inflation or other factors which may render mineral resources containing lower grades of mineralization uneconomic to exploit and may ultimately result in a restatement of mineral resources and may adversely impact future cash flows. Mineral Resource and Mineral Reserve estimates are based on limited sampling and, consequently, are uncertain as the samples may not be representative of the entire body of mineralization. As a better understanding of a body of mineralization is obtained, the estimates may change significantly. The mineral reserves we ultimately exploit may not conform to geological, metallurgical, or other expectations and the volume and grade of ore recovered may be below the estimated levels. Mineral resources data is not indicative of future production.
Developing new properties requires substantial capital expenditures to identify and delineate mineral resources through geological and geotechnical surveying and drilling, to identify geological features that may prevent or restrict the extraction of ore, to determine the metallurgical processes to extract the metals from the ore, and to construct mining and processing facilities. Accordingly, it may not always be possible or economical to conduct such exercises at regular intervals or at all in the future.
There can be no assurance that we will in the long term be able to identify additional mineral resources and reserves or continue to extend the mine life of our existing operations. Without such additional mineral resources and reserves, any increase in the level of annual production would therefore shorten the life of our existing operations. Any failure to identify, delineate and realize mineral resources and reserves in the future could have an adverse effect on our business, financial condition, results of operations, prospects, or liquidity.
Our ability to replenish Mineral Reserves is subject to uncertainty and risks inherent in exploration, technical and economic pre-feasibility and feasibility studies and other project evaluation activities as well as competition within the industry for exploration, development, and operational projects which meet our investment criteria.
We must continually replenish Mineral Reserves depleted by mining and production to maintain or increase production levels in the long term. This process includes exploration activities that are speculative in nature. Our ability to sustain or increase our present levels of gold production depends in part on the success of our exploration activities and related projects and we may be unable to sustain or increase such production levels. Project studies and exploration activities necessary to determine the current or future viability of a mining operation, including estimates of tonnages, grades, and metallurgical characteristics of the ore, are often unproductive and unpredictable. Such activities often require substantial expenditure on exploration drilling to establish the presence, extent, and grade (metal content) of mineralized material. Following, and in parallel with, ongoing exploration activities we undertake project studies to estimate the technical and economic viability of mining projects and to determine appropriate mining methods and metallurgical recovery processes. For example, for the restart of the Mazowe Mine and the Redwing Mine, we anticipate completing feasibility studies to evaluate the current technical and economic potential of the mines. Additionally, estimates of Mineral Resources may not be converted to Mineral Reserves in amounts anticipated or at all.
Once mineralization is discovered, it may take several years to determine whether an adequate Mineral Reserve exists, during which time the economic viability of the project may change due to fluctuations in factors that affect both revenue and costs.
Mining is inherently hazardous and the related risks of events that cause disruptions to our mining operations may adversely impact the environment or the health, safety, or security of our workers or the local community, production, cash flows, and overall profitability.
Gold mining operations are subject to risks of hazards and other events that may adversely impact our ability to produce gold and meet production and cost targets, and our level of profitability, if any, in future years may be materially impacted. These hazards and events include, but are not limited to:
• accidents or incidents, including due to human error, during exploration, production, drilling, blasting, or transportation resulting in injury, disease, loss of life, or damage to equipment or infrastructure;
• air, land, and water pollution;
9
• social or community disputes or interventions;
• security, environmental, or safety incidents, including as the result of the activities of artisanal or illegal miners, trespassers, squatters, and other forms of encroachment;
• surface or underground fires or explosions;
• labor force disputes and disruptions;
• loss of information integrity or data;
• mechanical failure or breakdowns and ageing infrastructure;
• failure of unproven or evolving technologies;
• unusual or unexpected geological formations, ground conditions, including lack of mineable face length and ore-pass blockages;
• fall-of-ground accidents in underground operations;
• cave-ins, sinkholes, subsidence, rock falls, rock bursts, or landslides;
• failure of mining pit slopes, heap-leach facilities, water or solution dams, waste stockpiles, and tailings facility walls;
• flooding or inundation of mine pits, shafts, or tunnels;
• safety-related stoppages;
• seismic activity; and
• other natural phenomena, such as floods, droughts, or other weather conditions, potentially exacerbated by climate change.
For example, over the last several years there have been several accidents at the mines, the vast majority of which were the result of illegal mining activities at the Redwing Mine and the Mazowe Mine. In 2024, 15 illegal artisanal miners were trapped for three days at the Redwing Mine before being rescued and over 30 have died at the Mazowe Mine or the Redwing Mine in various incidences related to illegal mining activity, including cave-ins and a blasting incident. However, we are not able to track all incidences from illegal mining due to the nature of the activity. We continue our efforts to secure the Redwing Mine and Mazowe Mine from trespassers and illegal miners and to coordinate with governmental authorities as appropriate.
In addition, there have been safety incidences at the How Mine resulting from our ongoing mining operations. For example, in 2019, there was an accident at the How Mine involving a rock fall during a shaft examination that resulted in the fatality of one employee and injuries to four others. Our lost time injury frequency rate was 1.51 and 0.06 for the years ended December 31, 2024, and 2025, respectively. The Company conducts training sessions in order to promote safety protocols in an effort to reduce such incidences.
Further, in 2018, the Mazowe Mine suffered flooding which caused damage to mining shafts, a common issue for mining operations. Similarly, in 2015 the Redwing Mine experienced significant flooding, leading to a suspension of operations and causing substantial damage to submerged equipment and rendered developed mineable reserves inaccessible.
Further, environmental, health, and safety legislation applicable to us could suspend part or all of our operations. Environmental, health, and safety incidents could therefore lead to increased unit production costs or lower production which could negatively affect our business, operating and/or financial results.
As a result of the foregoing, our exploration, development, and production activities may be substantially affected by factors beyond our control, any of which could materially adversely affect our financial position or results from operations. Additional flooding or other natural hazards may occur in the future.
10
Theft of the mineral concentrate, final metals, and production inputs may occur. These activities are difficult to control, can disrupt our business and can expose us to liability.
We may experience trespassers, illegal and artisanal mining activities, and theft of metals bearing materials (which may be by employees or third parties) and final metallic products, or theft of or damage to infrastructure such as water pumps and environmental monitoring equipment. The activities of trespassers and illegal and artisanal miners could lead to reduction of mineral resources, potentially affecting the economic viability of mining certain areas and shortening the lives of the operations as well as causing possible operational disruption, project delays, disputes with illegal miners and communities, pollution, or damage to property for which we could potentially be held responsible, leading to fines or other costs. Rising metal prices may result in an increase in mineral and metal theft. Further, in the case of any mineral projects which we may acquire in the future and which have historically had mining activity, we face an increased risk of theft with artisanal miners.
During the period in which the Mazowe Mine and the Redwing Mine were under corporate rescue, illegal miners operated in the mines and dug open pits which were left unfilled. While we intend to backfill the pits in compliance with applicable laws, such acts negatively impact our operations and efforts to restart the mines. In addition, there is a risk of unauthorized third-party miners encroaching on our properties, and evictions of such unauthorized third-party miners may take time to complete. The occurrence of any of these events could have a material adverse effect on our business, financial condition, results of operations, prospects, or liquidity.
Our assets and operations are subject to political, economic, and other uncertainties as a result of being located in Zimbabwe and the DRC.
Our projects are located in Zimbabwe, and we are evaluating opportunities to acquire mining interests in, and expand our operations to, the DRC. Our assets and operations may therefore be subject to various political, economic, and other uncertainties, including, among other things, the risks of war and civil unrest, hostage taking, terrorist actions, expropriation, nationalization, renegotiation or nullification of existing licenses, delays in obtaining government permits, approvals and contracts, taxation policies, sudden and arbitrary changes to laws and regulations, foreign exchange and repatriation restrictions, corruption and bribery, changing political conditions, international monetary fluctuations, currency controls, and limitations on foreign ownership and foreign governmental regulations that favor or require the awarding of contracts to local contractors or require foreign contractors to employ citizens of, or purchase supplies from, a particular jurisdiction. Changes, if any, in mining or investment policies or shifts in political climate in Zimbabwe and the DRC may adversely affect our operations or profitability. Operations may be affected in varying degrees by government regulations with respect to, but not limited to, restrictions on production, price controls, export controls, currency remittance, income taxes, foreign investment, maintenance of claims, environmental legislation, land use, land claims of local people, water use, and mine safety. Failure to comply strictly with applicable laws, regulations, and local practices relating to mineral rights could result in loss, reduction, or expropriation of entitlements. In addition, in the event of a dispute arising from operations in Zimbabwe or the DRC, we may be subject to the exclusive jurisdiction of foreign courts or may not be successful in subjecting foreign persons to the jurisdiction of courts in the United States or elsewhere. We also may be hindered or prevented from enforcing our rights with respect to a governmental instrumentality because of the doctrine of sovereign immunity. It is not possible for the Company to accurately predict such developments or changes in laws or policy or to what extent any such developments or changes may have a material adverse effect on its operations. Should our rights or titles not be honored or become unenforceable for any reason, or if any material term of these agreements is arbitrarily changed by the government of Zimbabwe or the DRC, our business, financial condition, and prospects will be materially adversely affected.
The DRC is a developing nation emerging from a period of civil war and conflict. Physical and institutional infrastructure throughout the DRC is in a debilitated condition. The DRC is in transition from a largely state-controlled economy to one based on free market principles, and from a non-democratic political system with a centralized ethnic power base to one based on more democratic principles. There can be no assurance that these changes will be effected or that the achievement of these objectives will not have material adverse consequences for the Company and its operations. The DRC continues to experience instability in parts of the country due to certain militia and criminal elements. While the government and United Nations forces are working to support the extension of central government authority throughout the country, there can be no assurance that such efforts will be successful.
11
Fluctuating foreign currency and exchange rates as well as Zimbabwean exchange controls may negatively impact our business, results of operations, and financial position.
All of our mined gold is sold to Fidelity at prices reflecting spot pricing of gold and the official exchange rate on the date of sale. We are paid in part with Zimbabwe’s local currency and part with U.S. dollars. From February 2023 until February 2025, we received 75% of our proceeds in U.S. dollars and 25% in local currency. Since February 2025, we have received 70% of our proceeds in U.S. dollars and 30% in local currency. Local currency has been paid in ZiG, Zimbabwe’s currency since April 2024, but has historically been paid in RTGs. Zimbabwe’s local currency has been subject to hyperinflation. Annual inflation was measured at approximately 4% in January 2026. Exchange rates of RTG for U.S. dollars have varied vastly over the last several years. In June 2023, the exchange rate was approximately 7,000 RTGs per U.S. dollar and in February 2024, the exchange rate was approximately 13,590 RTGs per U.S. dollar.
On April 5, 2024, the Reserve Bank of Zimbabwe issued a Monetary Statement policy that introduced a structured currency (which is generally defined as a currency that is pegged to a specific exchange rate or currency basket and backed by a bundle of foreign exchange assets (including gold)). The structured currency, called the ZiG, replaced the RTG. Banks were instructed to convert the RTG balances into the new currency to foster simplicity, certainty, and predictability in monetary and financial affairs. The new currency will co-circulate with other foreign currencies in the economy. The exchange rate for ZiG was approximately 25 ZiGs per U.S. dollar during January 2026. Devaluations of the ZiG or the introduction of new currencies could cause inflation or could otherwise increase the cost of our operations and decrease the value of our assets in Zimbabwe. We do not currently hedge our exposure to gold price fluctuation or changes in inflation or exchange rates, and we do not currently have plans to put hedges in place. Additionally, exchange control approvals from the RBZ are required to transfer funds in and out of Zimbabwe, and we currently have the necessary approvals from the RBZ to transfer foreign currency.
If inflation and exchange rates for Zimbabwe’s local currency continue to be volatile, it may have a negative impact on our business, results of operations, and financial position. For example, due to political unrest and hyperinflation in 2007, we ceased mining operations in Zimbabwe and placed all then current mines in care and maintenance, and we did not resume operations until 2009 with several of the mines requiring rehabilitation work. Additionally, although we have received RBZ approval to transfer foreign currency, no assurance can be given that we will retain such approval going forward on the same terms or at all.
The price of gold is subject to volatility and may have a significant effect on our future activities and profitability.
Nearly all of our revenues are derived from the sale of gold and, to a much lesser extent, silver. The market prices for these commodities fluctuate significantly. These fluctuations are caused by numerous factors beyond the Company’s control. For example, the market price of gold may change for a variety of reasons, including:
• speculative positions taken by investors or traders in gold;
• monetary policies announced or implemented by central banks, including the U.S. Federal Reserve, such as changes in interest rates;
• changes in the demand for gold as an investment;
• changes in the demand for gold used in jewelry and for other industrial uses, including as a result of prevailing economic conditions;
• changes in the supply of gold from production, divestment, scrap, and hedging;
• financial market expectations regarding interest rates and the rate of inflation;
• the strength of the U.S. dollar (the currency in which gold trades internationally) relative to other currencies;
• actual or anticipated sales or purchases of gold by central banks and the International Monetary Fund;
• gold hedging and unwinding of hedging by gold producers;
12
• global or regional political or economic events, including the outbreak of hostilities or war; and
• the cost of gold production in major gold-producing countries.
The market price of gold has been and continues to be significantly volatile. During 2025, the market spot gold price traded between a low of approximately $2,600 per ounce and a high of approximately $4,500 per ounce. In addition to protracted declines, the price of gold has also often been historically subject to sharp, short-term changes.
Any sharp or prolonged fluctuations in the price of gold can have a material adverse impact on our profitability and financial condition.
In addition, any announcements or proposals by central banks, such as the U.S. Federal Reserve, or any of its board members or regional presidents or other similar officials in other major economies, may materially and adversely affect the price of gold and, as a result, our financial condition and results of operations.
Events that affect the supply and demand of gold may also have an impact on the price of gold. Demand for gold is also significantly impacted by trends in China and India, which account for the highest gold consumption worldwide. Government policies in these countries or other large gold-importing countries could adversely affect demand for, and consequently prices of, gold and, as a result, may adversely affect our financial condition and results of operations.
Furthermore, the shift in demand from physical gold to gold-related investments and speculative instruments may exacerbate the volatility of the gold price. Slower consumption of physical gold, resulting from a move toward gold-tracking investments or otherwise, may have an adverse impact on global demand for, and prices of, gold.
A sustained period of significant gold price volatility may adversely affect our ability to evaluate the feasibility of undertaking new capital projects or the continuity of existing operations, to meet our operational targets or to make other long-term strategic decisions. Lower and more volatile gold prices, together with other factors, may lead us to alter our expansion and development strategy and consider ways to align our asset portfolio to take account of such expectations and trends. As a result, we may decide to curtail or temporarily or permanently shut down certain of our exploration and production operations, which may be difficult and costly. For example, in part due to reduced prices of gold, we halted operations at our Mazowe Mine and Redwing Mine in 2018 and 2019, respectively. A sustained decrease in the price of gold could also have a material adverse effect on our financial condition and results of operations, as we may be unable to quickly adjust our cost structure to reflect the reduced gold price environment. The market value of gold inventory may be reduced, and marginal stockpile and heap leach inventories may be written down to net realizable value or may not be processed further as it may not be economically viable at lower gold prices. In addition, we are obligated to meet certain financial covenants under the terms of a $8 million bank facility arrangement between the How Mining Company and African Banking Corporation of Zimbabwe Limited (“ABC Banc”). See “Management’s Discussion and Analysis of Financial Condition and Results of Operations — Liquidity and Capital Resources.” Our ability to continue to meet these covenants could be adversely affected by a further sustained decrease in the price of gold. The use of lower gold prices in Mineral Resource and Mineral Reserve estimates or life-of-mine plans from those prices used previously to determine such estimates or life-of-mine plans could also result in material impairments of our investment in mining properties or a reduction in our Mineral Resource and Mineral Reserve estimates and corresponding restatements of our Mineral Resource and Mineral Reserve estimates and increased amortization, reclamation and closure charges. We do not currently have any hedges for the price of gold and do not currently intend on entering any.
We cannot guarantee that there will not be an increase in input costs affecting our results of operations and financial performance.
Mining companies could experience higher costs of steel, reagents, labor, electricity, government levies, fees, royalties, and other direct and indirect taxes. Efficiencies at existing operations and planned growth may assist in curbing cost increases and/or allow the fixed cost component to be absorbed over increased production assisting in alleviating the net cash effect of any further cost increases and potentially increase revenue cash flows. However, there can be no assurance that we will be able to control such input costs and any increase in input costs above our expectations may have a negative result on our results of operations and financial performance.
13
Our operations are vulnerable to infrastructure constraints, including power and water supply.
Mining, processing, development, and exploration activities depend on adequate infrastructure. Reliable rail, roads, bridges, power sources, power transmission facilities, and water supply are critical to our business operations and affect capital and operating costs. These infrastructures and services are often provided by third parties and governments whose operational activities are outside our control.
We use water in the metallurgical process, some of which is provided by dams, diverted rivers, or pumped from underground. We believe that there is enough water from current sources to maintain operations and support expansion. However, water supplies are subject to change, especially if there is prolonged drought, and inadequate water supply would cause operations to become more costly or have to be curtailed, suspended, or even terminated, which may have adverse consequences on our business and financial condition.
We obtain the majority of our electricity from Zimbabwe’s national power suppliers. Zimbabwe’s electricity generation is mainly from the Kariba hydro station on the Zambezi River, the Hwange coal-fired station and several other much smaller coal-fired power stations. Even if Zimbabwe’s installed generating capacity is fully operational, it cannot generate enough electricity to meet its requirements. Consequently, Zimbabwe imports electricity from Mozambique and South Africa. Load shedding is frequent. We are undertaking measures to reduce the risk of inadequate power supply, including the installation of solar power generation and we have entered into a power supply agreement with Intensive Energy Users Group, an independent power supply group, but we may not be able to realize the anticipated benefits. If an electricity shortage or outage persists, operations may become more costly or have to be curtailed, suspended, or even terminated which may have serious adverse consequences to the viability of production from the mines that could, in turn, have adverse consequences on our business and financial condition.
Interferences in the maintenance or provision of infrastructure, including unusual weather phenomena, sabotage, drought and social unrest could impede our ability to maintain operations and adversely affect our business, results of operations and financial condition.
Establishing infrastructure for our development projects requires significant resources, identification of adequate sources of raw materials and supplies, and necessary cooperation from national and regional governments, none of which can be assured.
The lack of availability on acceptable terms or the delay in the availability of any one or more of these items could prevent or delay exploration, development, or exploitation of our mineral projects. If adequate infrastructure is not available, the future mining or development of our projects may not be commenced or completed on a timely basis, or at all, the resulting operations may not achieve the anticipated production volume and the construction costs and operating costs associated with the mining and/or development of our projects may be higher than anticipated.
Mining operations and projects are vulnerable to supply chain disruptions such that operations and development projects could be adversely affected by shortages of, as well as extended lead times to deliver, strategic spares, critical consumables, mining equipment, or metallurgical plant.
Our operations and development projects could be adversely affected by both shortages and long lead times to deliver strategic spares, critical consumables, mining equipment, and metallurgical plant, as well as transportation delays. Import restrictions can also delay the delivery of parts and equipment. In the past, we and other gold mining companies experienced shortages in critical consumables, particularly as production capacity in the global mining industry expanded in response to increased demand for commodities. We have also experienced increased delivery times for these items.
Individually, we and other mining companies have limited influence over manufacturers and suppliers of these items. In certain cases, there are a limited number of suppliers for certain strategic spares, critical consumables, mining equipment, or metallurgical plant who command superior bargaining power relative to us. We could at times face limited supply or increased lead time in the delivery of such items.
We primarily source our mining, processing equipment, and consumables from suppliers either directly through our supply chain function or by using a procurement house. Our procurement policy is to source from suppliers that meet our corporate values and ethical standards. However, there is a risk that we may fail to identify actual instances of unethical conduct by those suppliers or other activities that are inconsistent with our values and standards. In certain locations, where a limited number of suppliers meet these standards, additional strain is
14
placed on the supply chain, thereby increasing the cost of supply and delivery times. Further, there is a risk that the procurement house we use may be unable to source mining, processing equipment, and consumables from suppliers in a timely manner, or at all, which could impede our ability to maintain operations and adversely affect our business.
We derive all of our revenues from the sale of gold to one company which is controlled by the Zimbabwean authorities. There is no assurance that such counterparty may not default in such obligation causing us to incur a financial loss.
Credit risk is the risk that a party with a contractual obligation with us will default in fulfilling their obligations. Regulations introduced by the Zimbabwean Ministry of Finance in January 2014 require that all gold produced in Zimbabwe must be sold to Fidelity, a company which is controlled by the Zimbabwean authorities. However, this arrangement concentrates our credit risk exposure that receivables and performance due from Fidelity will not be paid or performed in a timely manner, or at all. If Fidelity or the Zimbabwean government were unable or unwilling to conduct business with us, satisfy obligations to us, or is otherwise late on the typical 30-day settlement period, we could experience a material adverse effect upon our operations and financial performance.
Our rights to mine in Zimbabwe are derived from each of the How Mine Lease, the Mazowe Mine Lease, and the Redwing Mine Lease, the loss of which would have a material adverse effect on our financial condition and results of operations.
Our operations are substantially dependent on the mining rights we derive from the How Mine Lease, the Mazowe Mine Lease, and the Redwing Mine Lease. Each lease is subject to annual renewal upon the completion of an inspection certificate from the provincial mining director and the payment of a fee and may be subject to forfeiture if we do not timely renew. In addition, the Zimbabwe government may have rights to acquire all or any portion of land subject to a mining lease for a public purpose. No assurances can be provided that such a taking would not happen in the future, and, in cases where compensation is required for such a taking, no assurance can be provided that any such compensation would be adequate. Our mining rights may also be lost or diminished if we fail to comply with the terms and conditions of the lease or if we fail to pay any taxes or royalties due to the Zimbabwe government after receiving 30 days’ notice. Our mining rights may also be lost if we fail to adequately operate the mining location and either the holder of a contiguous mining location initiates a hostile takeover of the applicable mining location by applying to the Zimbabwe government or the Mining Minister of Zimbabwe finds, at his discretion, that the mine’s operations were inappropriately stopped for an unreasonably long period of time. Challenges to our rights to the mining leases, as transferees or otherwise, including outdated mining record documentation or chain of title issues with the provincial mining office, may also occur and if successful could result in the loss of our rights under the mining leases. The loss of our rights under any of our mining leases would have a material adverse effect on our financial condition and results of operations.
Acquisitions, strategic partnerships, joint ventures, and other partnerships may not perform in accordance with expectations, may fail to receive required regulatory approvals, or may disrupt our operations and adversely affect our credit ratings and profitability.
We may enter into joint ventures, strategic partnerships, partnership arrangements, or acquisition agreements with other parties in relation to our metal exploration and mining business and are actively evaluating opportunities to acquire mining interests in, and expand our operations to, the DRC. Any such arrangement may not be successful or provide the anticipated benefits. Any failure of other parties to meet their obligations to us or to third parties, or any disputes with respect to the parties’ respective rights and obligations could have a material adverse effect on us, the development and operations of our business, and future joint ventures, if any, or their properties, and therefore could have a material adverse effect on our business, financial condition, results of operations, prospects, or liquidity. Further, we may be unable to exert control over strategic decisions made in respect of such properties.
The process of integrating an acquired business into our business may divert management’s attention from our core businesses. The integration of any acquired assets requires management capacity. There can be no assurance that our current management team has sufficient capacity, or that it can acquire additional skills to supplement that capacity, to integrate any acquired or new assets and operations and to realize cost and operational efficiencies at the acquired assets or maintain those at the existing operations. It may result in unforeseen operating difficulties and expenditures and generate unforeseen pressures and strains on our organizational culture. There can be no
15
guarantee that we will succeed in retaining the key personnel of any acquired businesses. Moreover, we may be unable to realize the expected benefits, synergies, or developments that we initially anticipate from such a strategic transaction.
We may be unable to identify acquisition opportunities and successfully execute and close acquisitions, which could limit our potential for growth.
We expect to actively seek new acquisitions to expand our business, including in the DRC, that management believes will provide meaningful opportunities for growth by increasing our existing capabilities and expanding into new areas and markets of operations. However, we may not be able to identify suitable acquisition candidates or complete acquisitions on acceptable terms and conditions. Other companies in our industry have similar investment and acquisition strategies to ours, and competition for acquisitions may intensify. If we are unable to identify acquisition candidates that meet our criteria, or complete acquisitions on acceptable terms and condition, our potential for growth may be restricted. Additionally, because we may actively pursue a number of opportunities simultaneously, we may encounter unforeseen expenses, complications, and delays in connection with identifying or acquiring suitable acquisition targets.
We may not be able to comply with the financial covenants related to our current bank borrowings or arrangements or in future borrowings or arrangements with financial institutions and we may not be able to obtain extensions of the maturity of our current or future borrowings or arrangements.
In 2025, the How Mining Company entered into a $8 million Facility Agreement (the “2025 Facility”) with ABC Banc, pursuant to which the How Mining Company is subject to restrictive covenants, including limitations on additional debt, the maintenance of debt service cover ratio and limitations on certain liens. Amounts outstanding under the 2025 Facility are subject to a security agreement covering the How Mine’s assets, a $15 million deed of hypothecation covering the How Mine Lease, and a cession of insurance covering the secured property. As of December 31, 2025, there was approximately $4.9 million outstanding under the 2025 Facility. See “Management’s Discussion and Analysis of Financial Condition and Results of Operations — Liquidity and Capital Resources.”
We may incur significant amounts of additional debt for acquisitions or capital expenditures and any future debt we incur and other agreements we enter into may contain, among other provisions, covenants that restrict our ability to finance future operations or capital needs or to engage in other business activities. Given the long-term nature of such agreements, these covenants and restrictions may present a material constraint on our operational and strategic flexibility and may preclude us from entering into strategic transactions that would be beneficial to us. If we fail to comply with these financial covenants, including those of the 2025 Facility, the applicable lending institutions may not be willing to extend the maturity of the outstanding loans and may accelerate the amounts we have borrowed under the various loan agreements.
The mining industry is highly competitive and there is no guarantee we will always be able to compete effectively.
The mining industry is a highly diverse and competitive international business. The selection of geographic areas of interest are only limited by the degree of risk a company is willing to accept by the acquisition of properties in emerging or developed markets and/or prospecting in explored or unexplored territory. Mining, by its nature, is a competitive business with the search for new opportunities with good exploration potential and the raising of the requisite capital to move projects forward to production. There is aggressive competition within the mining industry for the discovery and acquisition of properties considered to have commercial potential. We will compete with other interests, many of which have greater financial resources than we will have, for the opportunity to participate in promising projects. Such competition may have better access to potential resources, more developed infrastructure, more available capital, have better access to necessary financing, and more knowledgeable and available employees than us. We may encounter competition in acquiring mineral properties, hiring mining professionals, obtaining mining resources, such as manpower, facilities, and other mining equipment. Such competitors could outbid us for potential projects or produce gold at lower costs. Increased competition could also affect our ability to attract necessary capital funding or acquire suitable properties or prospects for gold exploration or production in the future. Significant capital investment is required to achieve commercial production from successful exploration and development efforts. Globally, the mining industry is prone to cyclical variations in the price of the commodities
16
produced by it, as dictated by supply and demand factors, speculative factors and industry-controlled marketing cartels. If we are unable to successfully compete for properties, capital, customers, or employees it could have a materially adverse effect on our results of operations.
We depend on key personnel for the success of our business.
We depend on the continued services and performance of key personnel, including members of our senior management among other key staff. If one or more of our senior management or other key employees cannot, or choose not to continue their employment with us, we might not be able to replace them easily or in a timely manner, or at all. In addition, the risk that competitors or other companies may poach our talent increases as we become more well-known. Key management personnel may elect to leave us which would cause a loss of continuity that may negatively impact our production and costs. The loss of key personnel, including members of management, could disrupt our operations and have a material adverse effect on our business, financial condition, and results of operations.
Our future success will depend upon our continued ability to identify, hire, develop, motivate, and retain highly skilled individuals, with the continued contributions of our senior management being especially critical to our success. We face intense competition in the industry for well-qualified, highly skilled employees and our continued ability to compete effectively depends, in part, upon our ability to attract and retain new employees. There is no assurance that we will always be able to locate and hire all the personnel that we may require. Where appropriate, we may engage with consulting and service companies to undertake some of the work functions. If we fail to effectively manage our hiring needs and successfully integrate our new hires, among other factors, our efficiency and ability to meet our forecasts and our ability to maintain our culture, employee morale, productivity, and retention could suffer, and our business, financial condition, and results of operations could be materially adversely affected.
Currently, we have many operational and mining contractors on short-term contracts and there is no guarantee that we will be able to re-contract with these miners. We might not be able to easily replace operational and mining contractors in a timely manner or at all.
Finally, effective succession planning will be important to our future success. If we fail to ensure the effective transfer of senior management knowledge and to create smooth transitions involving senior management, our ability to execute short and long term strategic, financial, and operating goals, as well as our business, financial condition, and results of operations generally could be materially adversely affected.
Most of our employees are members of the Associated Mine Workers Union of Zimbabwe and any work stoppage or industrial action implemented by the union may affect our business, results of operations, and financial performance.
Most of the employees are members of either the Associated Mine Workers Union of Zimbabwe or Zimbabwe Diamond and Allied Minerals Workers Union. Pay rates for all wage-earning staff are negotiated on a Zimbabwe industry-wide basis between the union and representatives of the mine owners. Any industrial action called by the union may affect our operations even though our operations may not be at the root cause of the action. Strikes, lockouts or other work stoppages could have a material adverse effect on our business, results of operations and financial performance. In addition, any work stoppage or labor disruption at key customers or service providers could impede our ability to supply products, to receive critical equipment and supplies for our operations or to collect payment from customers encountering labor disruptions. Work stoppages or other labor disruptions could increase our costs or impede our ability to operate.
Our business, financial condition, and results of operations may be adversely affected by the occurrence of an outbreak of infectious diseases, a pandemic or other public health threats, and natural disasters.
Our business, financial condition, and results of operations may be adversely affected by an outbreak of infectious diseases, a pandemic or other public health threat, such as the COVID-19 pandemic, the Mpox epidemic, or an outbreak of the Ebola virus.
Our operations could be disrupted if our employees become ill or are otherwise absent from work as a result of an infectious disease or other global health pandemics. Governmental restrictions, including travel restrictions, quarantines, shelter-in-place orders, business closures, new safety requirements or regulations, restrictions on the
17
import or export of certain materials, or other operational issues related to pandemics may have an adverse effect on our business, financial condition, and results of operations. We continue to monitor our operations and governmental recommendations and have made modifications for an indefinite period to our normal operations because of the COVID-19 pandemic. Additionally, while the potential economic impacts brought by and the duration of pandemics are difficult to assess or predict, the impact of any pandemic on the global financial markets may reduce our ability to access capital, which could negatively affect our short-and long-term liquidity.
Similarly, an outbreak of infectious diseases, a pandemic, or other public health threat, or a fear of any of the foregoing, could adversely impact our operations by causing supply chain delays and disruptions, import restrictions or shipping disruptions, as well as operational shutdowns (including as part of government-mandated containment measures). Furthermore, in response to the COVID-19 pandemic, several governments imposed significant restrictions on the movement of goods, services, and persons (including travel), including nationwide lockdowns of businesses and their citizens (quarantine) and even temporary suspension of mining activities. Such disruptions and other manufacturing and logistical restraints could result in extended lead times in supply and distribution networks, as well as the exercise of force majeure measures, the impacts of which could eventually result in stoppage of mining operations. They could also result in the need to increase inventories on long lead time items and critical consumables and spares which may lead to an increase in working capital. We cannot guarantee that our crisis management measures will be adequate, that the supply chain and operations will not be adversely affected by future epidemic or pandemic outbreaks, or that there would be no related consequences, such as severe food shortages and social impact.
Furthermore, our operations may be impacted by natural disasters, such as earthquakes, severe weather, such as storms, heavy rainfall, and other impacts that may be increasing due to climate change, as well as other phenomena that include unrest, strikes, theft, and fires. The occurrence of one or more of these events may result in the death of, or personal injury to, personnel, the loss of mining and refining equipment, damage to or destruction of mineral properties or production and infrastructure facilities, disruptions in production, increased costs, environmental damage, and potential legal liabilities. Furthermore, supply chains and rates can be impacted from the occurrence of natural disasters. If we experience shortages, or increased lead times in the delivery of strategic spares, critical consumables, mining equipment, or processing plants, we might be forced to suspend some of our operations or cease operations.
The occurrence of one or more of these events could have an adverse effect on our business, financial condition, results of operations, prospects, or liquidity. In addition, the impact of an outbreak of infectious diseases or a natural disaster could exacerbate other risks we face, including those described elsewhere in “Risk Factors.”
Our management of workplace health and safety matters may expose our business to significant risk.
There are health and safety risks associated with our operations in Zimbabwe and potential future operations in the DRC. Given the inherent dangers associated with mining, many of our workforce (including contractors) may be exposed to substantial risk of serious injury or death from hazards, including motor vehicle incidents on or off-site, electrical incidents, falls from height, being struck by suspended loads, seismicity-induced and other rock falls underground, fire, and confined space incidents. Workers may also be subject to longer-term health risks, including due to exposure to noise and hazardous substances (such as dust and other particulate matter). While we regularly and actively review our workplace health and safety systems and monitor compliance with workplace health and safety regulations, no assurance can be made that we have been or will be at all times in full compliance with all applicable laws and regulations, or that workplace accidents will not occur. As the operator of mines, we have extensive regulatory and legal obligations to ensure that our personnel and contractors operate in a safe working environment. A failure to comply with such obligations or workplace health and safety laws and regulations could result in civil claims, criminal prosecutions, or statutory penalties which may adversely affect our business, financial position, and performance, as well as causing long-term reputational damage.
Our operations are underpinned by numerous contractual arrangements with third parties and non-compliance with these arrangements may substantially affect our operations or profits.
Our capacity to efficiently conduct our operations depends upon third party products and service providers and contractual arrangements that we have entered into to provide for these arrangements. Our ability to ultimately receive benefits from these contracts is dependent upon the relevant third party complying with our contractual
18
obligations. To the extent that such third parties default in their obligations, it may be necessary for us to enforce our rights under the relevant contracts and pursue legal action. Such legal action may be costly and no guarantee can be given that a legal remedy will ultimately be obtained on commercial terms.
Our insurance coverage may not be sufficient in all possible contexts, and we may not be able to rely upon our insurance in certain circumstances.
Our mining, exploration, and development operations involve numerous risks, including unexpected or unusual geological operating conditions, rock bursts, cave-ins, ground or slope failures, fires, floods, earthquakes and other environmental occurrences, political, and social instability that could result in damage to or destruction of mineral properties or producing facilities, personal injury or death, environmental damage, delays in mining caused by industrial accidents or labor disputes, changes in regulatory environment, monetary losses, and possible legal liability. We maintain insurance within ranges of coverage we believe to be consistent with industry practice and having regard to the nature of activities being conducted and associated risks as set out above; however, we ceased insurance coverage for the Mazowe Mine and the Redwing Mine once mining operations were halted in 2018 and 2019, respectively, and intend on obtaining insurance coverage as part of the restart process. However, no assurance can be given that we will be able to continue to obtain insurance coverage at all times, that such coverage will be at reasonable rates or that any coverage we arrange will be adequate and available to cover all such claims. Further, in connection with the 2025 Facility, we entered into a cession of insurance with ABC Banc covering assets of the How Mining Company. In addition, we may elect to not purchase insurance for certain risks due to various factors (such as cost, likelihood of risks eventuating and industry practice). The lack of, or insufficiency of, insurance coverage could adversely affect our business, financial position, and performance.
If our operations do not perform in line with expectations, we may be required to write down the carrying value of our investments, which could affect any future profitability and our ability to pay dividends.
Under IFRS, we are required to test the carrying value of long-term assets or cash-generating units for impairment at least annually and more frequently if we have reason to believe that our expectations for the future cash flows generated by our assets may no longer be valid. If the results of operations and cash flows generated by our metals extraction operations are not in line with our expectations, we may be required to write down the carrying value of these assets. Any write-down could materially affect our business, operating results, operations, and financial condition.
Since operations at our Mazowe Mine and Redwing Mine were halted in 2018 and 2019, respectively, we have been subject to litigation regarding disputed debts and corporate rescue proceedings pursuant to Zimbabwean insolvency laws.
In November 2018, certain assets of the Mazowe Mine were sold at an auction to satisfy a judgment obtained by the Zimbabwe Electricity Transmission and Distribution Company (“ZETDC”) with respect to amounts alleged owed to ZETDC. The assets consist of plant material and remain at the Mazowe Mine; however, the assets are not required for the restart of the Mazowe Mine and are not anticipated to be utilized for future operations. We believe the decision is improper, and we are challenging the decision. However, no assurance can be given that we will be successful, and we may lose the benefit of such assets.
The concept of corporate rescue was introduced in Zimbabwe law by the enactment of the Insolvency Act (Chapter 6:07) in 2018, which replaced judicial management procedures. Corporate rescue is a process to restructure the affairs of a company and rehabilitate financially distressed companies under the temporary supervision of a corporate rescue practitioner. In Zimbabwe, the placement of a company under supervision and corporate rescue proceedings may be commenced by a resolution of the applicable company or by certain parties enumerated by statute.
Operations at the Mazowe Mine and the Redwing Mine halted in 2018 and 2019, respectively, and were placed under care and maintenance programs. Soon after the Mazowe Mine and the Redwing Mine ceased operations, applications were filed in Zimbabwe to place the Redwing Mining Company and the Mazowe Mining Company in corporate rescue proceedings. The applications were initially granted. As a result, our management was separated from control of the mines. During the existence of the corporate rescue order for the Redwing Mine, the corporate rescue practitioner entered into a tribute agreement with Betterbrand (Private) Limited.
19
Corporate rescue application approvals were overturned by the Supreme Court of Zimbabwe in 2021, in the case of the Mazowe Mine, and 2022, in the case of the Redwing Mine. As a result of the Supreme Court of Zimbabwe setting aside the corporate rescue application for the Redwing Mine, the tribute agreement with Betterbrands (Private) Limited is no longer recorded in the mining lease title records with the mining affairs board and Betterbrands (Private) Limited was eventually evicted from the Redwing Mine.
In 2023, employees of our Redwing Mine applied to have the Redwing Mining Company placed under corporate rescue proceedings but the case was dismissed by the High Court of Zimbabwe.
On February 15, 2024, another application was filed with the High Court of Zimbabwe to place the Mazowe Mining Company in corporate rescue proceedings. The application has been challenged by the Company, and although a hearing date was set for March 11, 2025, such date was postponed and a new date has not been set. In management’s view, the application is without merit and does not comply with applicable laws and rules. However, no assurance can be given that the case will be dismissed or that additional applications may not be filed, despite the recent withdrawal of the principal petitioner’s application. If corporate rescue proceedings are approved at the Mazowe Mining Company or the Redwing Mining Company, our plans to restart the mines and our interests in the assets may be materially adversely affected.
Greenstone’s purchase of the Mazowe Mine, the Redwing Mine, and the How Mine from Metallon may be subject to potential claims that may have a material adverse effect on the Company’s assets and operations.
Greenstone entered into a share purchase agreement, dated June 17, 2024, as amended on January 17, 2025 (the “BMC Purchase Agreement”), with Metallon Corporation Limited, a company incorporated in England and Wales and undergoing insolvency proceedings (the “Administration”) in the U.K. (“Metallon”), the appointed administrators of Metallon (the “Administrators”), Khumalo, and the SelliBen Trust (together with Khumalo, the “Guarantors”), pursuant to which, among other things, Metallon sold (the “BMC Sale”) all of the shares of BMC to Greenstone in exchange for consideration of approximately £53.2 million (the “Purchase Price”) to be paid by the Guarantors. Under the terms of the BMC Purchase Agreement, the Guarantors have agreed to keep the Administrators, Metallon, and Greenstone fully indemnified, for a period of six years, against any and all claims or expenses arising directly or indirectly in connection with the BMC Sale. BMC indirectly holds the Mazowe Mine, the Redwing Mine, and the How Mine and the shares of BMC represent substantially all of Greenstone’s assets and, in turn, the Company’s assets.
Under the BMC Purchase Agreement, the Guarantors are responsible for payment of the Purchase Price, which to date has not been satisfied. However, certain Ordinary Shares held by the SelliBen Trust are held as security for the Guarantors’ obligations under the BMC Purchase Agreement. Notwithstanding the outstanding obligations of the Guarantors, Greenstone is the registered owner of all of the shares of BMC. The Administration may not be completed until, among other things, the Purchase Price has been satisfied and all third-party creditor liabilities of Metallon have been discharged in accordance with and in satisfaction of the Administration. While the BMC Sale is not conditioned on the Guarantors’ payment of the Purchase Price, if the Purchase Price is not satisfied pursuant to the BMC Purchase Agreement or the Administration is not completed with all related potential claims discharged or waived, then there is a risk that a claim may be made to, among other things, rescind or unwind the BMC Sale or for Greenstone to pay all or a portion of the Purchase Price, notwithstanding the provisions of the BMC Purchase Agreement. Greenstone is indemnified by the Guarantors for claims arising directly or indirectly in connection with the BMC Sale pursuant to the BMC Purchase Agreement, but such indemnification may not protect against equitable remedies. In the event Greenstone is unable to satisfy any monetary penalty awarded against it in relation to a challenge to the BMC Sale (and assuming the indemnity is insufficient to satisfy such penalty or in the event the Guarantors are otherwise not able to satisfy their indemnification obligations, which Greenstone management considers unlikely), the relevant judgment creditor may be able to pursue additional remedies to satisfy the judgment, including actions relating to Greenstone’s assets, which may include the shares of BMC. Any such potential equitable remedies, monetary penalty awards, or other remedies could have a material adverse effect on the Company’s assets and operations.
Further, the former majority shareholder of Metallon (the “Metallon Shareholder”) (which was under common control with Metallon) was placed into liquidation in Jersey in May 2024. Prior to the events leading to the liquidation proceedings, the Metallon shares held by the Metallon Shareholder were transferred (the “Metallon Transfer”) to the current controlling shareholders of Metallon pursuant to a restructuring. The adequacy of the
20
consideration for such transfer could be at issue in the Metallon Shareholder liquidation proceedings, and the Metallon Transfer could be challenged at law or in equity. If such a challenge is initiated against the Metallon Shareholder or any related parties, the prospects of success of such challenge and the likely outcome thereof could only be assessed at the time such challenge is made, and the litigation of any such potential claims, should they commence, could be protracted and costly. The Company and Greenstone are indemnified by the Guarantors for claims relating to the Metallon Transfer. However, if claims are made against the Company or Greenstone relating to the Metallon Transfer, we may be financially obligated to satisfy such claims, which may include the payment of restitution relating to the Metallon Transfer. If the Guarantors default on their indemnification obligations, such financial obligations could have a material adverse effect on our assets and operations.
Lawsuits may be filed against us and an adverse ruling in any such lawsuit could have a material adverse effect on our business, results of operations and financial performance.
We may become party to legal claims arising in the ordinary course of business, including liabilities from competing mining claims, trespassers, or artisanal mining activities, the Redwing Mine tribute agreement claims, unauthorized open pits, or environmental concerns. There can be no assurance that unforeseen circumstances resulting in legal claims will not result in significant costs or losses. The outcome of outstanding, pending, or future proceedings cannot be predicted with certainty and may be determined adversely to us and as a result, could have a material adverse effect on our assets, liabilities, business, financial condition, and results of operations. Even if we prevail in any such legal proceedings, the proceedings could be costly and time-consuming and may divert the attention of management and key personnel from our business operations, which could adversely affect our financial condition. In the event of a dispute arising in respect of our foreign operations, we may be subject to the exclusive jurisdiction of foreign courts or may not be successful in subjecting foreign persons to the jurisdiction of courts in the United States of America, Zimbabwe, the DRC, the United Kingdom, the Cayman Islands, or international arbitration. The legal and political environments in which we operate may make it more likely that laws will not be enforced and that judgments will not be upheld. If we are unsuccessful in enforcing our rights under the agreements to which we are party to or judgments that have been granted, or if laws are not appropriately enforced, it could have a material adverse effect on our business, results of operations, and financial performance.
We are exposed to global economic and market risks that are beyond our control, including as a result of the conflicts in Ukraine, Gaza and Iran, which may have a material adverse effect on our assets and operations.
If any of our facilities of those of our suppliers, third-party service providers, or customers is affected by natural disasters, public health crises (such as pandemics and epidemics), political crises (such as terrorism, war, political instability or other conflict), trade and other geopolitical instability due to tariffs or other trade sanctions, or other events outside of our control, it could have a material adverse effect on our assets, financial conditions and results of operations, including through decreased production, increased costs, a decrease in the price of gold, or the failure by counterparties to perform under contracts or similar arrangements.
The conflicts in Ukraine, Gaza, Iran and the Middle East more broadly, and the accompanying international response including economic sanctions, have been extremely disruptive to the world economy, with increased volatility in commodity markets, including higher oil and gasoline prices, disruption to international trade and financial markets, all of which have a trickle-down effect on supply chains, equipment, and construction. There is substantial uncertainty about the extent to which these conflicts will continue to impact economic and financial affairs, as the numerous issues arising from the conflicts are in flux and there is the potential for escalation of the conflicts globally. There is a risk of substantial market and financial turmoil arising from the conflicts which could have a material adverse effect on the economics of our projects, and our ability to operate its business and advance project development.
Even though we do not have any operations or direct suppliers located in Gaza or Iran, tensions in the Middle East conflict could result in disruptions to our business and operations, adversely affect our anticipated unit and production costs, increase raw material costs, increase inflationary pressures, impacting our ability to successfully contract with suppliers, and could have other adverse impacts on our anticipated costs.
21
Disruption to current trade practices, including tariffs and other developments in international trade policies and regulations, could adversely affect our operations and outlook.
We are a mining company incorporated in the Cayman Islands with operations in Zimbabwe and our commercial operations directly and indirectly span several jurisdictions. As such, we are and will be sensitive to changes in international trade policies and regulations. For example, our ability to procure inputs and equipment required for our projects and operations may be subject to interruptions or trade barriers due to policies and tariffs or import/export restrictions of individual countries. Tariffs and any additional changes in government trade policy could also result in one or more other jurisdictions adopting responsive trade policies. For instance, the governments of the United States and China maintained substantial and escalating tariffs during 2025. We are unable to predict the ultimate result or duration of any new tariffs, or changes to existing tariffs, imposed by any country, or tariff countermeasures that may be taken by any country.
The imposition of tariffs or other trade barriers and changes in trading policies, potential retaliatory measures, or uncertainties in international trade policies and regulations may adversely impact our operations, particularly given our presence across multiple jurisdictions. Recent tariff actions have resulted in market uncertainty and volatility and concerns over inflation, recession and slowing growth. Continued market uncertainty or volatility, or any broader economic challenges resulting from adverse developments in internal trade policies, could adversely affect the price of our securities.
Risks Related to Cybersecurity
Security breaches, loss of data, and other disruptions could compromise sensitive information related to our business, prevent us from accessing critical information or expose us to liability, which could adversely affect our business and our reputation.
We rely on computer systems and network infrastructure throughout our operations. We use the server of a third-party hosting service provider. Our operations depend on our ability to protect our computer equipment and systems from damage from physical theft, fire, power outages, telecommunications failures, and other catastrophic events, as well as from internal and external security breaches, viruses, worms, and other destructive problems. Any disruption to our operations due to damage to or failure of our computer systems, network infrastructure or servers could have a material adverse effect on our business and could subject us to regulatory action or litigation. A significant network breach in the security of these systems because of ineffective operation of these systems, maintenance issues, upgrades, migrations to new platforms, cyberattacks or other failures to maintain an ongoing and secure cyber network could result in further damage, delays in customer service, and reduced efficiency in our operations. This could include the theft of our data, improper use of personal information, and other forms of identity theft. While we utilize our own personnel and various hardware and software to monitor our systems, controls, firewalls, and encryption, and intend to maintain and upgrade our security technology and operating procedures to prevent damage, breaches, and other disruptions, there is no guarantee that these security measures will be successful. Any such claims, proceedings, or actions by regulatory authorities, or adverse publicity resulting from such claims, could adversely affect our business and results of operations.
We use information technology systems and networks to process, transmit, and store electronic information in connection with our business activities. As the use of digital technology increases, cyber incidents, including intentional attacks and unauthorized access attempts to computer systems and networks, are becoming more frequent and sophisticated. These threats pose a risk to the security of our systems and networks, and to the confidentiality, availability, and integrity of data that is critical to our business and business strategy. There can be no assurance that we will be successful in preventing cyberattacks or successfully mitigating their effects.
Despite the implementation of security measures, our computer systems and our current and future third-party service providers are susceptible to damage or interruption due to hacking, computer viruses, software bugs, unauthorized access or disclosure, natural disasters, terrorism, war, telecommunications, equipment, and electrical failures. There is no guarantee that we will be able to promptly detect such events. If such an event occurs, we will have a difficult time responding to it. Unauthorized access, loss, or dissemination could disrupt our operations, including our research and development activities, the processing and preparation of our financial information, and our ability to manage various general and administrative aspects of our business. To the extent that such disruptions or security breaches result in loss of or damage to our data or applications, or inappropriate disclosure or theft of
22
confidential, proprietary, or personal information, we could be subject to liability, reputational damage, poor performance, or regulatory action by the government authorities where we operate. Any of these could have an adverse effect on our business.
In addition, our information technology systems may be vulnerable to damage or interruption from circumstances beyond our control, including fire, natural disasters, power outages, systems failures, and viruses. If we are unable to execute our disaster recovery and business if our plans prove insufficient for a particular situation or take longer than expected to implement in a crisis situation, it could have a material adverse effect on our business, financial condition, and results of operations, and our business interruption insurance may not adequately compensate us for losses that may occur.
Cybersecurity breaches and other disruptions or failures in our information technology systems could compromise our information, result in the unauthorized disclosure of confidential supplier, employee, and Company information, damage our reputation, and expose us to liability, which could negatively impact our business.
In the normal course of our business, we may collect, process, and store sensitive data, including our own business information; information about our suppliers, and business partners; and personally identifiable information about our employees, contractors, and counterparties that resides in our data centers and on our networks. The secure processing, maintenance, and transmission of this information is essential to our business operations. We also depend on the information technology systems of third parties for the analysis, data storage, and communication.
We rely on commercially available systems, software, tools, and monitoring to provide security for the processing, transmission, and storage of sensitive information. Despite the security measures and ongoing vigilance, we have in place to protect sensitive information, our systems and those of our third-party service providers may be vulnerable to security breaches, hacker attacks, vandalism, computer viruses, loss or misplacement of data, human error, or other malfunctions and attacks. Such breaches may compromise our network and information stored therein may be accessed, disclosed, lost, or stolen. Advances in computer and software capabilities and encryption technology, new tools, and other developments may increase the risk of a breach or compromise. Technological interruptions would also disrupt our operations, including our ability to timely manage our supply chain. In the event we experience significant disruptions, we may be unable to repair our systems in an efficient and timely manner and such events may disrupt or reduce the efficiency of our entire operation for a prolonged period. The occurrence of these incidents could result in diminished internal and external reporting capabilities, impaired ability to process transactions, harm to our control environment, diminished employee productivity, and unanticipated increases in costs, including substantial legal costs in connection with the defending of any lawsuits that may arise from such incidents.
We are increasingly dependent on complex information technology to manage our infrastructure. Our information systems require an ongoing commitment of significant resources to maintain, protect, and enhance our existing systems. Failure to maintain or protect our information systems and data integrity effectively could negatively affect our business, financial condition and results of operations.
Risks Related to Laws and Regulations
If our involvement in an online or print news article or interview that may be published about the Company were held to be in violation of the Securities Act, we could incur monetary damages, fines or other damages that could have a material adverse effect on our operations and financial condition. You should rely only on statements made in this prospectus in determining whether to purchase securities of our Company.
Since the consummation of the Business Combination on June 5, 2025, the Company has been the subject of substantial media interest relating to not only that transaction, but also our gold mining operations in Zimbabwe, as well as our management team and history. Our senior executives have participated in certain live and online interviews, and print media, both inside and outside the United States. Further, given the nature of our business and the global interest in gold and critical minerals, we have in the past received, and may continue to receive, a high degree of media interest, including coverage that is not directly attributable to statements made by our senior executives or employees.
23
In making your investment decision, you should only rely on the information contained in this prospectus. Articles, interviews, and other press coverage about the Company and our activities in Zimbabwe typically present information in isolation and do not contain all of the information included in this prospectus, including the risks and uncertainties described in this section and elsewhere. You should carefully evaluate all of the information included in this prospectus before making an investment decision.
We do not believe that our involvement in interviews or other news articles since the consummation of the Business Combination constitutes a violation of Section 5 of the Securities Act. However, we could be subject to litigation and/or regulatory proceedings arising out of our involvement. If it were determined through a court or administrative proceeding that we were in violation of the Securities Act, we could be subject to monetary damages, claims for rescission, fines, and other penalties that could have a material adverse effect on our operations and financial condition. We expect to contest vigorously any claim that a violation of the Securities Act occurred and, in doing so, we could incur considerable financial expense as well as diversion of management time away from executing our strategy.
Our operations are subject to various government approvals, permits, licenses, and legal regulation for which no assurance can be provided that such approvals, permits, or licenses will be obtained or if obtained will not be revoked or suspended.
Government approvals, permits, and licenses are required in connection with a number of our activities and additional approvals, permits, and licenses may be required in the future. The duration and success of our efforts to obtain approvals, permits, and licenses are contingent upon many variables outside of our control. Obtaining governmental approvals, permits and licenses can increase costs and cause delays depending on the nature of the activity and the interpretation of applicable requirements implemented by the relevant authority. While we and our affiliates currently hold, or in the process of renewing, the necessary licenses to conduct operations there can be no assurance that all necessary approvals, permits and licenses will be maintained or obtained or that the costs involved will not exceed our estimates or that we will be able to maintain such permits or licenses. To the extent such approvals, permits, and licenses are not obtained or maintained, we may be prohibited from proceeding with planned drilling, exploration, development, or operation of properties which could have a material adverse effect on our business, results of operations, and financial performance. See “Business — Mineral Resource and Mineral Reserve Individual Property Disclosure — How Mine — Mineral Tenure” for more information on the permits and licenses issued as at December 31, 2025, related to the How Mine. As part of the process to restart operations at the Mazowe Mine and the Redwing Mine, we are in the process of renewing the required permits and licenses with respect to those mines.
In addition, failure to comply with applicable laws, regulations, and requirements in the countries in which we operate may result in enforcement action, including orders calling for the curtailment or termination of operations on our property, or calling for corrective or remedial measures requiring considerable capital investment. Although we believe that our activities are currently carried out in all material respects in accordance with applicable rules and regulations, no assurance can be given that new rules and regulations will not be enacted or that existing rules and regulations will not be applied in a manner that could limit or curtail production or development of our properties or otherwise have a material adverse effect on our business, results of operations, and financial performance.
Failure to comply with the U.S. Foreign Corrupt Practices Act and similar laws in Zimbabwe and elsewhere associated with our activities could subject us to penalties and other adverse consequences.
All of our revenues are currently from Zimbabwe. Consequently, we face significant risks if we fail to comply with Zimbabwe’s applicable laws relating to corruption and bribery, the U.S. Foreign Corrupt Practices Act (“FCPA”), and other laws that prohibit improper payments or offers of payment to governments and their officials and political parties by us and other business entities for the purpose of obtaining or retaining business. In addition, we cannot guarantee the compliance by our partners, suppliers, and agents with applicable laws. Therefore, there can be no assurance that none of our employees or agents will take actions in violation of our policies or of applicable laws, for which we may be ultimately held responsible. Any violation of the Zimbabwean laws, the FCPA, or related laws and policies could result in severe criminal or civil sanctions, which could have a material and adverse effect on our reputation, business, financial condition, and results of operations.
24
We are subject to labor and employment laws and regulations, which could increase our costs and restrict our operations in the future.
As of December 31, 2025, we had 1,500 employees. Our management believes that our employee relations are strong. However, further organizing activities, collective bargaining, or changes in the regulatory framework for employment may increase our employment-related costs or may result in work stoppages or other labor disruptions. Moreover, as employers are subject to various employment-related claims, such as individual and class actions relating to alleged employment discrimination and wage-hour and labor standards issues. For example, certain employees of the Mazowe Mining Company and the Redwing Mining Company claimed they were not paid an aggregate of approximately $2.7 million of wages owed to them when the Mazowe Mine and the Redwing Mine entered into care and maintenance programs in 2018 and 2019, respectively. In response, the Mazowe Mining Company has made installment payments and will continue to make payments upon resumption of operations, and the Redwing Mining Company has entered into compromise agreements with some employees and is in continued discussions to enter into additional comprise agreements. However, such claims have not been fully resolved and we may be subject to additional wage or other labor-related claims in the future. Such actions, if brought against us and successful in whole or in part, may affect our ability to compete or have a material adverse effect on our business, financial condition, and results of operations.
Existing and future environmental laws may increase our costs of doing business, result in significant liabilities, fines, or penalties, and may restrict our operations.
The nature of our mining operations carries the potential for environmental disturbance and harm, with implications for surrounding ecosystems, water supply, and land use. This could be due to, among other things, physical disruption from land clearing and excavation and use of groundwater supplies in mining operations, or the uncontrolled release of contaminants into soil and waterways.
We are subject to various environmental laws and regulations, including those related to wastewater discharge, solid waste discharge, pollution, air emissions, and the disposal of hazardous materials and other waste products from our operations. Such laws and regulations may subject us to liabilities, including liabilities associated with contamination of the environment, damage to natural resources, rehabilitation costs and the disposal of waste products that may occur as the result of our operations. For example, as of December 31, 2025, our provision for rehabilitation costs was $26.7 million. Future expenditures on rehabilitation might not be complete or accurately provided for due to higher-than-expected cost increases, changes in legislation, unidentified factors, or other factors out of our control. If we fail to comply with environmental laws and regulations, the relevant governmental authorities may impose fines or deadlines to cure instances of noncompliance and may order us to cease operations. We may also suffer from negative publicity and reputational damage as a result of such non-compliance. In addition, if any third party suffers any loss as a result of our emissions, release of hazardous substances, our improper handling of minerals or other waste products, or our non-compliance with environmental laws and regulations, such third parties may seek damages from us.
With an increasing global focus and public sensitivity to environmental sustainability and environmental regulation becoming more stringent, we could be subject to further environmental related responsibilities and associated liability. Environmental legislation and permitting requirements are likely to evolve in a manner which will require stricter standards and enforcement, increased fines and penalties for non-compliance, more stringent environmental assessments of proposed projects, an increase in capital expenditure, and a heightened degree of responsibility for companies and their directors and employees.
Future changes to environmental laws and regulations may also require us to install new equipment or otherwise change operations or incur costs in order to comply with any such change in laws or regulations. We cannot assure you that we will be able to comply with all environmental laws and regulations at all times as such laws and regulations are evolving and tend to become more stringent. Therefore, if governments in areas where we operate impose more stringent laws and regulations in the future, we will have to incur additional, potentially substantial costs and expenses in order to comply, which may negatively affect our results of operations.
25
We are subject to complex laws and regulations, which could have a material adverse effect on our operations and financial results.
As a business with international reach, we are subject to complex laws and regulations, including investment screening laws, in jurisdictions in which we operate. Those laws and regulations may be interpreted in different ways. They may also change from time to time, as may related interpretations and other guidance. Changes in laws or regulations could result in higher expenses and payments, and uncertainty relating to laws or regulations may also affect how we conduct our operations and structure our investments and could limit our ability to enforce our rights.
New legislation may require different operating methodologies or additional capital or operating expense to satisfy new rules and regulations. Changes in environmental and climate laws or regulations could lead to new or additional investment in manufacturing designs, could subject us to additional costs and restrictions, including increased energy and raw materials costs, and could increase environmental compliance expenditures.
We may be subject to review and enforcement actions under domestic and foreign laws that screen investments and to other national-security-related laws and regulations. In certain jurisdictions, these legal and regulatory requirements may be more stringent than in the United States and may impact mining companies more specifically. As a result of these laws and regulations, investments by particular investors may need to be filed with local regulators, which in turn may impose added costs on our business, impact our operations, and/or limit our ability to engage in strategic transactions that might otherwise be beneficial to us and our investors.
Existing and future laws and regulations governing issues involving climate change, and public sentiment regarding climate change, could result in increased operating costs or otherwise impact our operations, which could have a material adverse effect on our business.
A number of governments or governmental bodies, including the European Union, have introduced or are contemplating regulatory changes in response to the possible impact of climate change. Laws, treaties, international agreements, and increased regulation or disclosure requirements regarding climate change could impose significant costs on us and our suppliers, including costs related to increased energy requirements, capital equipment, environmental monitoring and reporting, and other costs to comply with such laws and regulations. It is uncertain if or when compliance with these laws and regulations will be mandated, as certain regulations, including those in the United States and the European Union, are being withdrawn, scaled back, or otherwise modified. These regulations may impose meaningful costs and demand significant attention from management, all of which could affect our business and our results of operations. Any future climate change laws and regulations could also negatively impact our ability to compete with companies situated in areas not subject to such limitations.
At this time, we cannot predict with any certainty how such future laws and regulations will affect our financial condition, operating performance or ability to compete. Furthermore, even without such laws and regulation, increased awareness and any adverse publicity in the global marketplace about possible impacts on climate change by us or other companies in our industry could harm our reputation. The potential physical impacts of climate change on our operations, if any, are highly uncertain and, if present, would be particular to the geographic circumstances in areas in which we operate. Nevertheless, these impacts could adversely impact the cost, production and financial performance of our operations.
Risks Related to the Ownership of Our Securities
Future sales and issuances of our Ordinary Shares could result in additional dilution of the percentage ownership of our shareholders and could cause our share price to fall.
We expect that significant additional capital will be needed in the future to pursue our growth plan. To raise capital, we may issue and sell our Ordinary Shares, convertible securities or other equity securities in one or more transactions at prices and in a manner we determine from time to time. If we sell our Ordinary Shares, convertible securities or other equity securities, investors may be materially diluted by subsequent sales. Such sales may also result in material dilution to our existing shareholders, and new investors could gain rights, preferences, and privileges senior to existing holders of our Ordinary Shares.
26
Issuances of Ordinary Shares pursuant to the Promissory Note may result in substantial dilution to our shareholders and may have a negative impact on the market price of our Ordinary Shares.
The Company may, in its discretion, make payments under the Promissory Note in Ordinary Shares, with such Ordinary Shares issued at a price equal to the lesser of (i) 95% of the closing price on Nasdaq of the Ordinary Shares on the Trading Day immediately preceding the applicable payment date and (ii) the arithmetic average of the Daily VWAP for the five (5) Trading Days ending on the Trading Day immediately preceding the applicable payment date. The issuance of any Ordinary Shares pursuant to the terms of the Promissory Note will dilute our shareholders and may negatively impact the trading price of our Ordinary Shares. We have registered with the SEC the potential resale of up to 1,750,000 Ordinary Shares that may be issued under the Promissory Note. As of March 25, 2026, we have issued 805,228 Ordinary Shares under the Promissory Note at varying prices. Payment obligations under the Promissory Note will continue until October 2026. Since the issue price of the Ordinary Shares issued under the Promissory Note is subject to the then-current market value of the shares, a greater number of Ordinary Shares may be issued if the trading price of our Ordinary Shares decreases.
Future resales of a substantial number of our Ordinary Shares, or the perception in the market that the holders of a large number of Ordinary Shares intend to sell shares, could reduce the market price of our Ordinary Shares.
We previously filed a registration statement that registered the offer and sale from time by certain selling securityholders of up to 87,548,686 Ordinary Shares (including 18,576,712 Ordinary Shares underlying Warrants) for so long as that registration statement is available for use. The registration statement of which this prospectus forms a part relates to offer and sale from time to time by the Selling Shareholder of an additional 1,750,000 Ordinary Shares that may be issued under the Promissory Note.
The resale, or perception in the market of a resale, of a substantial number of Ordinary Shares in the public market could adversely affect the market price for our Ordinary Shares and make it more difficult for you to sell your Ordinary Shares at times and prices that you feel are appropriate. Resales of our securities pursuant to effective registration statements may continue for an extended period of time, the precise duration of which cannot be predicted. In addition, registration rights we may grant in the future, including in the ordinary course of the Company’s business, may further depress market prices if these registration rights are exercised or Ordinary Shares are sold under the registration statements, the presence of additional shares trading in the public market may also adversely affect the market price of our Ordinary Shares.
Sales of our Ordinary Shares upon the expected expiration of resale restrictions could encourage short selling which could negatively impact the price of our Ordinary Shares.
Pursuant to the Registration Rights and Lock-up Agreement, certain shareholders, including the SelliBen Trust and entities controlled by our executive officers, which collectively held approximately 44,999,296 Ordinary Shares outstanding as of the Closing of the Business Combination, agreed to certain restrictions on transfer until June 5, 2026, subject to certain exceptions. See “Certain Relationships and Related Person Transactions — Registration Rights and Lock-up Agreement” for additional information. Sales of Ordinary Shares upon the expected expiration of resale restrictions could encourage short sales by market participants. Generally, short selling means selling a security, contract or commodity not owned by the seller. The seller is committed to eventually purchase the financial instrument previously sold. Short sales are used to capitalize on an expected decline in the security’s price. As such, short sales of Ordinary Shares could have a tendency to depress the price of Ordinary Shares, which could further increase the potential for short sales.
Our Warrants are currently exercisable for Ordinary Shares, which increases the number of Ordinary Shares eligible for future resale in the public market and may result in dilution to our shareholders.
Our Warrants to purchase an aggregate of up to 18,576,677 Ordinary Shares are currently exercisable in accordance with the terms of the Warrant Agreement. The exercise price of the Warrants is $11.50 per share (subject to adjustment pursuant to the Warrant Agreement). To the extent Warrants are exercised, additional Ordinary Shares will be issued, which will result in dilution to the existing holders of Ordinary Shares and increase the number of Ordinary Shares eligible for resale in the public market. Sales of substantial numbers of such shares in the public market or the fact that such Warrants may be exercised could adversely affect the market price of Ordinary Shares.
27
However, there is no guarantee that the Warrants will ever be “in the money” while they are exercisable and/or prior to their expiration, which is the earlier of their redemption and five years after the Closing Date, and as such, the Warrants may expire worthless. For more information on our warrants, including conditions to their exercisability, please see “Description of Securities — Warrants.”
The Company incurs additional costs as a result of operating as a public company, and its management devotes substantial time to ongoing compliance requirements.
The Company completed the Business Combination and listed its Ordinary Shares and Warrants on Nasdaq in June 2025. As a result, it incurs significant legal, accounting, and other expenses that it did not incur as a private company, and these expenses may increase after the Company is no longer an emerging growth company, as defined in Section 2(a) of the Securities Act. As a public company, the Company is subject to the reporting requirements of the Exchange Act, the Sarbanes-Oxley Act, the Dodd-Frank Wall Street Reform and Consumer Protection Act, as well as rules adopted, and to be adopted, by the SEC. The Company’s management and other personnel will need to devote a substantial amount of time to these compliance initiatives. Moreover, the Company expects these rules and regulations to substantially increase its legal and financial compliance costs as compared to before it was a public company and to make some activities more time consuming and costly. The impact of these requirements could also make it more difficult for the Company to attract and retain qualified persons to serve on its board of directors or as executive officers.
The Company’s management has limited experience in operating a Nasdaq-listed public company.
The Company’s executive officers have limited experience in the management of a publicly traded company that is listed on a U.S. stock exchange and subject to SEC reporting obligations. The Company’s management team may not successfully or effectively manage its transition to a public company that will be subject to significant regulatory oversight and reporting obligations under federal securities laws. Their limited experience in dealing with the increasingly complex laws pertaining to public companies could be a significant disadvantage in that it is likely that an increasing amount of their time may be devoted to these activities which will result in less time being devoted to the management and growth of the Company. The Company may not have adequate personnel with the appropriate level of knowledge, experience, and training in the accounting policies, practices, or internal controls over financial reporting required of public companies in the United States. The development and implementation of the standards and controls necessary for the Company to achieve the level of accounting standards required of a public company in the United States may require costs greater than expected.
There can be no assurance that we will be able to maintain compliance with the continued listing standards of Nasdaq over time.
Our Ordinary Shares and Warrants are listed on Nasdaq under the symbols “NAMM” and “NAMMW,” respectively, and Nasdaq has established standards for the continued listing of a security on Nasdaq. In January 2026, we received a letter (the “Letter”) from the Nasdaq Listing Qualifications Department (the “Staff”) indicating that during the period from December 5, 2025 to January 20, 2026 our Ordinary Shares did not meet the minimum market value of publicly held shares of $15,000,000 (the “MVPHS”) requirement for continued listing on the Nasdaq Global Market (“Nasdaq Global”) pursuant to Nasdaq Listing Rule 5450(b)(2)(C) (the “Rule”). On February 18, 2026, we receive another letter from the Staff indicating that the Company met the MVPHS requirement for more than ten consecutive trading days and, accordingly, that the Company had regained compliance with the Rule, and the matter was closed. However, there can be no assurance that we will be able to continue to maintain compliance with the continued listing standards of Nasdaq in the future.
If, in the future, Nasdaq delists our securities from trading on its exchange for failure to meet the listing standards, we and our shareholders could face significant negative consequences. The consequences of failing to meet the listing requirements include:
• a limited availability of market quotations for its securities;
• reduced liquidity for our securities;
• a determination that the Ordinary Shares are a “penny stock” which will require brokers trading in the Ordinary Shares to adhere to more stringent rules and possibly result in a reduced level of trading activity in the secondary trading market for its securities;
28
• a limited amount of news and analyst coverage; and
• a decreased ability to issue additional securities or obtain additional financing in the future.
The SelliBen Trust owns the majority of our issued and outstanding Ordinary Shares, which provides it the right to appoint a majority of the members of the Company Board. Accordingly, its interests may conflict with those of our other shareholders, which may have the effect of delaying or preventing a change in control.
The SelliBen Trust owns approximately 63% of the Ordinary Shares outstanding, representing a majority of our outstanding voting securities, and is entitled to appoint the majority of the members of the Company Board. As a result, the SelliBen Trust is able to substantially influence matters requiring our shareholder or board approval, including the election of directors, approval of any potential acquisition of us, changes to our organizational documents and significant corporate transactions. This concentration of ownership makes it unlikely that any other holder or group of holders of Ordinary Shares will be able to affect the way we are managed or the direction of our business. The interests of the SelliBen Trust with respect to matters potentially or actually involving or affecting us, such as future acquisitions, financings and other corporate opportunities and attempts to acquire us, may conflict with the interests of our other shareholders and may, for example, have the effect of delaying or preventing a change in control.
The Company is a “controlled company” under Nasdaq rules and able to rely on exemptions from certain corporate governance requirements that could adversely affect the Company’s shareholders.
The SelliBen Trust controls approximately 63% of our Ordinary Shares. Therefore, the Company qualifies as a “controlled company” under the Nasdaq rules. Under these rules, a company of which more than 50% of the voting power is held by an individual, group, or another company is a controlled company and may elect not to comply with certain corporate governance requirements, including the requirement that a majority of its directors be independent and the requirement that the compensation committee and nominating and corporate governance committee of the Company consist entirely of independent directors. The Company currently does not intend to rely on these exemptions. However, if the Company decides to rely on exemptions applicable to controlled companies under the Nasdaq rules in the future, its shareholders will not have the same protections afforded to shareholders of companies that are subject to all of Nasdaq corporate governance requirements.
We may redeem our outstanding and unexpired Warrants prior to their exercise at a time that is disadvantageous to the holders of our Warrants, thereby making a holder’s Warrants worthless.
The Company has the ability to redeem its outstanding Warrants at any time after they become exercisable and prior to their expiration, at a price of $0.01 per Warrant, provided that the last reported sales price of Ordinary Shares equals or exceeds $18.00 per share (as adjusted for share sub-divisions, share dividends, rights issuances, subdivisions, reorganizations, recapitalizations, and the like) for any 20 trading days within a 30-trading-day period ending on the third trading day prior to the date we send the notice of such redemption to the Warrant holders. If the Warrants become redeemable by us, we may exercise our redemption right even if we are unable to register or qualify the underlying securities for sale under all applicable state securities laws.
In addition, the Company has the ability to redeem the outstanding Warrants at any time after they become exercisable and prior to their expiration, at a price of $0.10 per Warrant upon a minimum of 30 days’ prior written notice of redemption provided that the closing price of our Ordinary Shares equals or exceeds $10.00 per share (as adjusted for share sub-divisions, share dividends, rights issuances, subdivisions, reorganizations, recapitalizations, and the like) for any 20 trading days within a 30 trading-day period ending on the third trading day prior to proper notice of such redemption and provided that certain other conditions are met, including that holders will be able to exercise their Warrants prior to redemption for a number of Ordinary Shares determined based on the redemption date and the fair market value of our Ordinary Shares. The value received upon exercise of the Warrants (1) may be less than the value the holders would have received if they had exercised their Warrants at a later time where the underlying share price is higher and (2) may not compensate the holders for the value of the Warrants, including because the number of Ordinary Shares received is capped at 0.361 shares of Ordinary Shares per Warrant (subject to adjustment) irrespective of the remaining life of the Warrants.
29
We have no obligation to notify holders of the Warrants that they have become eligible for redemption. However, pursuant to the Warrant Agreement, in the event we decide to redeem the Warrants, a notice of redemption shall be mailed by us by first class mail, postage prepaid, not less than 30 days prior to the date fixed for redemption to the registered holders of the Warrants to be redeemed at their last addresses as they appear on the warrant register. Any notice mailed in such manner shall be conclusively presumed to have been duly given. In addition, beneficial owners of the Warrants will be notified of such redemption by our posting of the redemption notice to DTC.
The Warrant Agreement designates the courts of the State of New York or the United States District Court for the Southern District of New York as the sole and exclusive forum for certain types of actions and proceedings that may be initiated by holders of our Warrants, which could limit the ability of Warrant holders to obtain a favorable judicial forum for disputes with our company.
The Warrant Agreement provides that, subject to applicable law, (i) any action, proceeding or claim against us arising out of or relating in any way to the agreement, including under the Securities Act, will be brought and enforced in the courts of the State of New York or the United States District Court for the Southern District of New York and (ii) we irrevocably submit to such jurisdiction, which will be the exclusive forum for any such action, proceeding or claim. We will waive any objection to such exclusive jurisdiction and that such courts represent an inconvenient forum.
Notwithstanding the foregoing, these provisions of the Warrant Agreement do not apply to suits brought to enforce any liability or duty created by the Exchange Act or any other claim for which the federal district courts of the United States of America are the sole and exclusive forum. Any person or entity purchasing or otherwise acquiring any interest in any of our Warrants will be deemed to have notice of and to have consented to the forum provisions in the agreement. Investors cannot waive compliance with the federal securities laws and the rules and regulations thereunder.
If any action, the subject matter of which is within the scope of the forum provisions of the Warrant Agreement, is filed in a court other than a court of the State of New York or the United States District Court for the Southern District of New York (a “foreign action”) in the name of any holder of our Warrants, such holder will be deemed to have consented to: (x) the personal jurisdiction of the state and federal courts located in the State of New York in connection with any action brought in any such court to enforce the forum provisions (an “enforcement action”) and (y) having service of process made upon such Warrant holder in any such enforcement action by service upon such Warrant holder’s counsel in the foreign action as agent for such Warrant holder.
This exclusive forum provision may limit a Warrant holder’s ability to bring a claim in a judicial forum that it finds favorable for disputes with our company and may limit a Warrant holder’s ability to bring a claim in a judicial forum that it finds favorable for disputes with the Company and may result in increased costs to bring a claim, which may further limit Warrant holders’ ability to bring a claim and discourage such lawsuits. Alternatively, if a court were to find this provision of the Warrant Agreement inapplicable or unenforceable with respect to one or more of the specified types of actions or proceedings, we may incur additional costs associated with resolving such matters in other jurisdictions, and such costs could materially and adversely affect our business, financial condition and results of operations and could result in a diversion of the time and resources of our management and the Company Board.
We do not intend to pay cash dividends for the foreseeable future and, as a result, your ability to achieve a return on your investment will depend on appreciation in the price of our Ordinary Shares.
The Company Board has discretion as to whether to distribute dividends. Even if our board of directors intends to declare and pay dividends, the timing, amount, and form of future dividends, if any, will depend on the future results of operations and cash flow, capital requirements and surplus, the amount of distributions, if any, received by the Company from subsidiaries, the Company’s financial condition, contractual restrictions, and other factors deemed relevant by the Company Board. Accordingly, you may need to rely on sales of your Ordinary Shares after price appreciation, which may never occur, as the only way to realize any gains on your investment.
30
We are a holding company. Our only significant asset is our ownership of 100% of the securities of Greenstone, and we will accordingly be dependent on distributions from Greenstone and its subsidiaries to meet our financial obligations and to pay dividends, if any.
The Company has no direct operations and no significant assets other than the ownership of 100% of the securities of Greenstone. We are, therefore, dependent on payments, dividends, and distributions from our subsidiaries to generate the funds necessary to meet our financial obligations, including our expenses as a publicly traded company and any debt obligations, and to pay any dividends with respect to our Ordinary Shares. Applicable law and contractual restrictions, including in agreements governing the current or future indebtedness of our subsidiaries, as well as the financial condition and operating requirements of such subsidiaries, may limit our ability to obtain cash from its subsidiaries. Furthermore, exchange rate fluctuations will affect the U.S. dollar value of any distributions our subsidiaries and joint ventures make with respect to our equity interests in those subsidiaries. In the event that the Company Board and our shareholders were to approve a sale of all of our direct and indirect interests in Greenstone, your equity interest would be in a holding company with no material assets other than those assets and other consideration received in such transaction.
Our Second Amended and Restated Memorandum and Articles of Association contain certain provisions, including anti-takeover provisions, that limit the ability of shareholders to take certain actions and could delay or discourage takeover attempts that shareholders may consider favorable.
The Company Organizational Documents contain provisions to limit the ability of others to acquire control of the Company or cause the Company to engage in change of control transactions. These provisions could have the effect of depriving our shareholders of an opportunity to sell their Ordinary Shares at a premium over prevailing market prices by discouraging third parties from seeking to obtain control of the Company in a tender offer or proxy contest, merger, or similar transaction. For example, the Company Board is classified into three classes of directors, and as a result, in most circumstances, a person can gain control of the Company Board only by successfully engaging in a proxy contest at two or more shareholder meetings. Additionally, our board of directors has the authority, subject to any resolution of the shareholders to the contrary, to issue shares with preferences, including in regard to distribution, voting, return of capital, or otherwise, any or all of which may be greater than the powers and rights associated with our Ordinary Shares. Shares could be issued with terms calculated to delay or prevent a change in control of the Company or make removal of management more difficult. If the Company Board decides to issue shares with preferences, the price of Ordinary Shares may fall and the voting and other rights of the holders of Ordinary Shares may be materially and adversely affected.
If an active market for our securities develops and continues, the trading price of our securities could be volatile and subject to wide fluctuations in response to various factors, some of which are beyond our control.
If an active market for our securities develops and continues, the trading price of our securities could be volatile and subject to wide fluctuations in response to various factors, some of which are beyond our control. Any of the factors listed below could have a material adverse effect on your investment in our securities and our securities may trade at prices significantly below the price you paid for them. In such circumstances, the trading price of our securities may not recover and may experience a further decline.
The price of gold is a factor that strongly influences the price of our securities, and the price of gold is volatile and subject to wide fluctuations. See “— Risks Related to Our Business, Operations and Industry — The price of gold is subject to volatility and may have a significant effect on our future activities and profitability.”
Other factors affecting the trading price of our securities may include:
• actual or anticipated fluctuations in our financial results or the financial results of companies perceived to be similar to us;
• changes in the market’s expectations about our operating results;
• success of competitors;
• our operating results failing to meet the expectation of securities analysts or investors in a particular period;
31
• changes in financial estimates and recommendations by securities analysts concerning us or the market in general;
• operating and stock price performance of other companies that investors deem comparable to us;
• changes in laws and regulations affecting our business;
• our ability to meet compliance requirements;
• commencement of, or involvement in, litigation involving us;
• changes in our capital structure, such as future issuances of securities or the incurrence of additional debt;
• the volume of our Ordinary Shares available for public sale;
• any major change in our board of directors or management;
• sales of substantial amounts of Ordinary Shares by our directors, executive officers or significant stockholders or the perception that such sales could occur;
• the volume of our Ordinary Shares available for public sale, including as a result of the expiration of the transfer restrictions in the Registration Rights and Lock-up Agreement pursuant to the terms thereof; and
• general economic and political conditions such as recessions, interest rates, fuel prices, international currency fluctuations and acts of war or terrorism.
Broad market and industry factors may materially harm the market price of our securities irrespective of our operating performance. The stock market in general and Nasdaq have experienced price and volume fluctuations that have often been unrelated or disproportionate to the operating performance of the particular companies affected. The trading prices and valuations of these stocks, and of our securities, may not be predictable. A loss of investor confidence in the market for retail stocks or the stocks of other companies which investors perceive to be similar to us could depress our stock price regardless of our business, prospects, financial condition or results of operations. A decline in the market price of our securities also could adversely affect our ability to issue additional securities and our ability to obtain additional financing in the future.
If securities or industry analysts do not publish or cease publishing research or reports about us, our business, or our market, or if they change their recommendations regarding our Ordinary Shares adversely, then the price and trading volume of our Ordinary Shares could decline.
The trading market for our Ordinary Shares will be influenced by the research and reports that industry or securities analysts may publish about us, our business, our market, or our competitors. Securities and industry analysts do not currently, and may never, publish research on us. If no securities or industry analysts commence coverage of us, our Ordinary Share price and trading volume would likely be negatively impacted. If any of the analysts who may cover us change their recommendation regarding our Ordinary Shares adversely, or provide more favorable relative recommendations about our competitors, the price of our Ordinary Shares would likely decline. If any analyst who may cover us were to cease coverage of us or fail to regularly publish reports on us, we could lose visibility in the financial markets, which could cause the price or trading volume of our Ordinary Shares to decline.
Investor perceptions of risks in developing countries or emerging markets, including in Zimbabwe and the DRC, could reduce investor appetite for investments in these countries or for the securities of issuers operating in these countries, such as us.
Emerging markets, including Zimbabwe and the DRC, are generally subject to greater risks, including legal, regulatory, economic, and political risks, than more developed markets, including the potential for outbreak of hostilities among nations or militant groups that could impact our assets and operations. There may also be unpredictability with respect to court judgments, including in cases involving the local government. Accordingly, investors should exercise particular care in evaluating the risks involved and should consider whether, in light of these risks, investing in the shares of a company whose assets and operations are based in an emerging market is appropriate. Economic crises or political hostilities in one or more such countries may reduce overall investor
32
appetite for securities of issuers operating in developing countries generally, even for such issuers that operate outside the regions directly affected by the crises. Past economic crises in developing countries have often resulted in significant outflows of international capital and caused issuers operating in developing countries to face higher costs for raising funds, and in some cases have effectively impeded access to international capital markets for extended periods.
Thus, even if the economies of the countries in which we operate remain relatively stable, financial or political turmoil in any developing market country could have an adverse effect on our business, financial condition, results of operations, prospects, or liquidity.
We have identified material weaknesses in our internal control over financial reporting. If we are unable to remediate these material weaknesses, or if we identify additional material weaknesses in the future, or we otherwise fail to implement and maintain an effective system of internal controls, we may be unable to accurately or timely report our results of operations or prevent fraud, and investor confidence and the market price of our Ordinary Shares may be materially and adversely affected.
Effective internal control over financial reporting is necessary for us to provide reliable financial reports and, together with adequate disclosure controls and procedures, are designed to prevent fraud.
In connection with the audit of Namib Minerals’ consolidated financial statements as of and for the year ended December 31, 2025, we identified control deficiencies that constituted material weaknesses. These material weaknesses have not yet been fully remediated as of December 31, 2025, and our management is actively engaged in remediation efforts. The PCAOB defines a material weakness as “a deficiency, or a combination of deficiencies in internal control over financial reporting, such that there is a reasonable possibility that a material misstatement of the annual or interim statements will not be prevented or detected on a timely basis.” The material weaknesses identified include: (i) the lack of formal processes and controls and lack of IFRS technical expertise related to accounting matters requiring significant judgment, estimates, and oversight of third party specialists, including the evaluation of asset impairment, review, and accounting for resource and reserve reports, and oversight of specialist review of annual rehabilitation, and (ii) the lack of formal financial close procedures and controls related to the timely and accurate preparation of financial reports and related disclosures.
We are undertaking measures to remediate the material weaknesses identified above by implementing detailed and documented policies and procedures across all business units and intend on hiring additional qualified accounting and reporting personnel with the technical experience to provide us with expertise in IFRS Accounting Standards and SEC reporting requirements. We plan on establishing an internal audit function as well as additional control testing and monitoring procedures that will be reviewed by both internal audit and management. Furthermore, in an effort to improve our financial closing policies and procedures for the preparation of consolidated financial statements and disclosure notes in accordance with IFRS and relevant SEC financial reporting requirements, we intend to undertake the following remediation initiatives: (i) implement IFRS accounting, tax compliance, and financial reporting training programs for our accounting and finance personnel; and (ii) formalize and standardize the financial reporting control procedures and policy manuals to improve the quality and accuracy of the period end financial closing processes.
The material weaknesses will not be considered remediated until the applicable controls operate for a sufficient period of time and management has concluded, through testing, that these controls are operating effectively. Although we plan to complete our planned remediation as quickly as possible, we are unable, at this time, to estimate how long it will take. We can give no assurance that our planned remediation will be properly implemented or will be sufficient to eliminate our identified material weaknesses or that material weaknesses or significant deficiencies in our internal control over financial reporting will not be identified in the future. Ineffective internal control over financial reporting could expose us to increased risk of fraud or misuse of corporate assets and subject us to potential delisting from the stock exchange on which we are listed, regulatory investigations, and civil or criminal sanctions. We may also be required to restate our financial statements from prior periods. Our failure to implement and maintain effective internal controls over financial reporting could result in errors in our financial statements that could result in a restatement of our financial statements, cause us to fail to meet our reporting obligations, and cause investors to lose confidence in our reported financial information, which may result in volatility in and a decline in the market price of our Ordinary Shares.
33
We may not be able to timely and effectively implement internal controls and procedures required by Section 404 of the Sarbanes-Oxley Act.
As a public company, we are subject to the Sarbanes-Oxley Act of 2002. Section 404 of the Sarbanes-Oxley Act, or Section 404, will require us to include a report from management on the effectiveness of our internal control over financial reporting in our annual report on Form 20-F beginning with our annual report in our second annual report on Form 20-F after becoming a public company. In addition, once we cease to be an “emerging growth company” as such term is defined in the JOBS Act, our independent registered public accounting firm must attest to and report on the effectiveness of our internal control over financial reporting. Moreover, even if our management concludes that our internal control over financial reporting is effective, our independent registered public accounting firm, after conducting its own independent testing, may issue an adverse opinion on the effectiveness of internal control over financial reporting if it is not satisfied with our internal controls or the level at which our controls are documented, designed, operated or reviewed, or if it interprets the relevant requirements differently from us. In addition, our reporting obligations may place a significant strain on our management and operational and financial resources and systems for the foreseeable future. We may be unable to timely complete our evaluation testing and any required remediation.
During the course of documenting and testing our internal control procedures, in order to satisfy the requirements of Section 404, we may identify weaknesses and deficiencies in our internal control over financial reporting. If we fail to maintain the adequacy of our internal control over financial reporting, as these standards are modified, supplemented, or amended from time to time, we may not be able to conclude on an ongoing basis that we have effective internal control over financial reporting in accordance with Section 404. Generally speaking, if we fail to achieve and maintain an effective internal control environment, it could result in material misstatements in our financial statements and could also impair our ability to comply with applicable financial reporting requirements and related regulatory filings on a timely basis. As a result, our businesses, financial condition, results of operations, and prospects, as well as the trading price of our Ordinary Shares, may be materially and adversely affected. Additionally, ineffective internal control over financial reporting could expose us to increased risk of fraud or misuse of corporate assets and subject us to potential delisting from Nasdaq, regulatory investigations, and civil or criminal sanctions. We may also be required to restate our financial statements from prior periods.
After we are no longer an “emerging growth company,” we may incur significant expenses and devote substantial management effort toward ensuring compliance with the requirements of Section 404 and the other rules and regulations of the SEC.
We may be required to take write-downs or write-offs, or we may be subject to restructuring, impairment, or other charges that could have a significant negative effect on our financial condition, results of operations, or the price of our Ordinary Shares, which could cause you to lose some or all of your investment.
Factors outside of our control may, at any time, arise. As a result of these factors, we may be forced to later write-down or write-off assets, restructure operations, or incur impairment or other charges that could result in our reporting losses. Even though these charges may be non-cash items and therefore not have an immediate impact on our liquidity, the fact that we report charges of this nature could contribute to negative market perceptions about us or our securities. In addition, charges of this nature may cause us to be unable to obtain future financing on favorable terms or at all.
We could be subject to securities class action litigation.
In the past, securities class action lawsuits have often been filed against companies after the market price of their securities has declined. If we were to face such a lawsuit, it could result in significant costs and require diversion of management’s attention and resources, which could adversely affect our business.
As an “emerging growth company” within the meaning of the Securities Act and the Exchange Act, we may take advantage of certain exemptions from disclosure requirements available to emerging growth companies, which may make our securities less attractive to investors and more difficult to compare our performance to the performance of other public companies.
We are an “emerging growth company” as defined in Section 2(a)(19) of the Securities Act, as modified by the JOBS Act. As such, we are eligible for and take advantage of certain exemptions from various reporting requirements applicable to other public companies that are not emerging growth companies and may continue to do
34
so for as long as we continue to be an emerging growth company, including, but not limited to, (a) not being required to comply with the auditor attestation requirements of Section 404 of the Sarbanes-Oxley Act, and (b) reduced disclosure obligations regarding executive compensation in our periodic reports and proxy statements. As a result, our shareholders may not have access to certain information they may deem important. We will remain an emerging growth company until the earliest of (1) the last day of the fiscal year (a) following the fifth anniversary of the Closing, (b) in which we have total annual gross revenue of at least $1.235 billion, or (c) in which we are deemed to be a large accelerated filer, which means the market value of our Ordinary Shares that are held by non-affiliates exceeds $700.0 million as of the prior June 30, and (2) the date on which we have issued more than $1.0 billion in non-convertible debt during the prior three-year period. If some investors find our securities less attractive as a result of our reliance on these exemptions, the trading prices of our securities may be lower than they otherwise would be, there may be a less active trading market for our securities and the trading prices of our securities may be more volatile.
Further, Section 102(b)(1) of the JOBS Act exempts emerging growth companies from being required to comply with new or revised financial accounting standards until private companies (that is, those that have not had a Securities Act registration statement declared effective or do not have a class of securities registered under the Exchange Act) are required to comply with the new or revised financial accounting standards. The JOBS Act provides that a company can elect to opt out of the extended transition period and comply with the requirements that apply to non-emerging growth companies, but any such election to opt out is irrevocable. We have elected not to opt out of such extended transition period, which means that when a standard is issued or revised and it has different application dates for public or private companies, we, as an emerging growth company, can adopt the new or revised standard at the time private companies adopt the new or revised standard. This may make comparison of our financial statements with another public company which is neither an emerging growth company nor an emerging growth company which has opted out of using the extended transition period difficult or impossible because of the potential differences in accounting standards used.
As a foreign private issuer, we are exempt from a number of U.S. securities laws and rules promulgated thereunder and will be permitted to publicly disclose less information than that required of U.S. public companies. This may limit the information available to holders of our Ordinary Shares.
We are a “foreign private issuer,” as defined in the SEC’s rules and regulations, and, consequently, we are not subject to all of the disclosure requirements applicable to public companies organized within the United States. For example, we are exempt from certain rules under the Exchange Act that regulate disclosure obligations and procedural requirements related to the solicitation of proxies, consents or authorizations applicable to a security registered under the Exchange Act. Moreover, we are not required to file periodic reports and financial statements with the SEC as frequently or as promptly as U.S. public companies. We are also not subject to Regulation FD under the Exchange Act, which would prohibit us from selectively disclosing material nonpublic information to certain persons without concurrently making a widespread public disclosure of such information. Accordingly, there may be less publicly available information concerning us than there is for U.S. public companies.
As a foreign private issuer, we will file an annual report on Form 20-F within four months of the close of each fiscal year ended December 31 and furnish reports on Form 6-K relating to interim financial statements and certain material events promptly after we publicly announce these events. However, because of the above exemptions for foreign private issuers, which we intend to rely on, our shareholders will not be afforded the same information generally available to investors holding shares in public companies that are not foreign private issuers.
We may lose our foreign private issuer status in the future, which could result in significant additional costs and expenses. This would subject us to U.S. GAAP reporting requirements which may be difficult to comply with.
As a “foreign private issuer,” we are not required to comply with the same level of periodic disclosure and current reporting requirements of the Exchange Act and related rules and regulations as U.S. domestic issuers. Under those rules, the determination of foreign private issuer status is made annually on the last business day of an issuer’s most recently completed second fiscal quarter, and, accordingly, the next determination will be made on June 30, 2026.
In the future, we could lose our foreign private issuer status if a majority of our voting securities are held by residents in the United States and we fail to meet any one of the additional “business contacts” requirements. Although we intend to follow certain practices that are consistent with U.S. regulatory provisions applicable to
35
U.S. companies, our loss of foreign private issuer status would make such provisions mandatory. The regulatory and compliance costs to us under U.S. securities laws if we are deemed a U.S. domestic issuer may be significantly higher. If we are not a foreign private issuer, we will be required to file periodic reports and registration statements on U.S. domestic issuer forms with the SEC, which are more detailed and extensive than the forms available to a foreign private issuer. For example, we would become subject to Regulation FD, aimed at preventing issuers from making selective disclosures of material information. We also may be required to modify certain of our policies to comply with good governance practices associated with U.S. domestic issuers. Such conversion and modifications will involve additional costs. In addition, we may lose our ability to rely upon exemptions from certain corporate governance requirements of Nasdaq that are available to foreign private issuers. Also, if we lose our foreign private issuer status, we would be required to change our basis of accounting from IFRS as issued by the IASB to U.S. GAAP, which may be difficult and costly for us to comply with. If we lose our foreign private issuer status and fail to comply with U.S. securities laws applicable to U.S. domestic issuers, we may have to de-list from Nasdaq and could be subject to investigation by the SEC, Nasdaq, and other regulators, among other materially adverse consequences.
Your ability to protect your rights through U.S. courts may be limited as we are incorporated under the law of the Cayman Islands. We conduct substantially all of our operations, and half of our directors and executive officers reside, outside of the United States.
We are an exempted company incorporated under the laws of the Cayman Islands. Our corporate affairs are governed by the Company Organizational Documents, the Cayman Islands Companies Act (As Revised), and the common law of the Cayman Islands. Substantially all of our assets are located outside the United States. Three of our officers and directors reside outside the United States and a portion of the assets of those persons are located outside of the United States. As a result, it could be difficult or impossible for you to bring an action against us or against these individuals outside of the United States in the event that you believe that your rights have been infringed upon under the applicable securities laws or otherwise. Even if you are successful in bringing an action of this kind, the laws of the Cayman Islands could render you unable to enforce a judgment obtained in the United States courts against our assets or the assets of our directors and officers.
You may face difficulties in protecting your interests because we are incorporated under Cayman Islands law.
The rights of shareholders to take action against our directors, actions by our minority shareholders, and the fiduciary duties of our directors to us under Cayman Islands law are to a large extent governed by the common law of the Cayman Islands. The common law of the Cayman Islands is derived in part from comparatively limited judicial precedent in the Cayman Islands as well as from the common law of England and Wales, the decisions of whose courts are of persuasive authority, but are not binding, on a court in the Cayman Islands. The rights of our shareholders and the fiduciary duties of our directors under Cayman Islands law are not as clearly established as they would be under statutes or judicial precedent in some jurisdictions in the United States. In particular, the Cayman Islands have a less developed body of securities laws than the United States. Some U.S. states, such as Delaware, have more fully developed and judicially interpreted bodies of corporate law than the Cayman Islands. In addition, Cayman Islands companies may not have standing to initiate a shareholder derivative action in a federal court of the United States.
Shareholders of Cayman Islands exempted companies like us have no general rights under Cayman Islands law to inspect corporate records (other than a company’s memorandum and articles of association, special resolutions which have been passed by shareholders, register of mortgages and charges, and a list of current directors) or to obtain copies of lists of shareholders of these companies. Our directors have discretion under the Company Organizational Documents to determine whether or not, and under what conditions, our corporate records may be inspected by our shareholders, but are not obliged to make them available to our shareholders. This may make it more difficult for you to obtain the information needed to establish any facts necessary for a shareholder motion or to solicit proxies from other shareholders in connection with a proxy contest.
We have been advised by Appleby (Cayman) Ltd., our Cayman Islands legal counsel, that the courts of the Cayman Islands are unlikely (1) to recognize or enforce against us judgments of courts of the United States predicated upon the civil liability provisions of the federal securities laws of the United States or any state; and (2) in original actions brought in the Cayman Islands, to impose liabilities against us predicated upon the civil liability provisions of the federal securities laws of the United States or any state, so far as the liabilities imposed
36
by those provisions are penal in nature. In those circumstances, although there is no statutory enforcement in the Cayman Islands of judgments obtained in the United States, the courts of the Cayman Islands will recognize and enforce a foreign money judgment of a foreign court of competent jurisdiction without retrial on the merits based on the principle that a judgment of a competent foreign court imposes upon the judgment debtor an obligation to pay the sum for which judgment has been given provided certain conditions are met. For a foreign judgment to be enforced in the Cayman Islands, such judgment must be final and conclusive and for a liquidated sum, and must not be in respect of taxes or a fine or penalty, inconsistent with a Cayman Islands judgment in respect of the same matter, impeachable on the grounds of fraud or obtained in a manner, or be of a kind the enforcement of which is, contrary to natural justice or the public policy of the Cayman Islands (awards of punitive or multiple damages may well be held to be contrary to public policy). A Cayman Islands Court may stay enforcement proceedings if concurrent proceedings are being brought elsewhere.
Certain corporate governance practices in the Cayman Islands, which is our home country, differ significantly from requirements for companies incorporated in other jurisdictions such as the United States. To the extent we choose to follow home country practice with respect to corporate governance matters, its shareholders may be afforded less protection than they otherwise would under rules and regulations applicable to U.S. domestic issuers. We currently do not choose to follow home country practice with respect to corporate governance matters; however, we may choose to do so in the future. See “Management — Foreign Private Issuer Exemption.”
As a result of all of the above, our shareholders may have more difficulty in protecting their interests in the face of actions taken by our management, users of the board of directors, or controlling shareholders than they would as shareholders of a company incorporated in the United States.
Cayman Islands economic substance requirements may have an effect on our business and operations.
The Cayman Islands enacted the International Tax Co-operation (Economic Substance) Act (As Revised) (the “Cayman Economic Substance Act”) in January 2019. We will be required to comply with the Cayman Economic Substance Act and related regulations and guidelines. As we are a Cayman Islands exempted company, compliance obligations will include filing annual notifications, in which we will need to state whether we are carrying out any relevant activities and if so, whether we have satisfied economic substance tests to the extent required under the Cayman Economic Substance Act and the filing of an annual return with the Department of International Tax Co-Operation. We may need to allocate additional resources and make changes to our operations in order to comply with all requirements under the Cayman Economic Substance Act. Failure to satisfy these requirements may subject us to penalties under the Cayman Economic Substance Act.
Tax Risk Factors
The Company may be subject to Zimbabwean capital gains tax as a result of the Business Combination and Greenstone’s acquisition of BMC.
Effective January 1, 2024, amendments to Zimbabwe’s Capital Gains Tax Act (Chapter 23:01) went into effect and provide for a capital gains tax of up to 20% on direct and indirect transfers of mining title. The statute provides that the tax may apply to both domestic and foreign entities, even if the applicable offshore entity is not a tax resident of Zimbabwe and regardless of whether the transaction occurs offshore of Zimbabwe. The new capital gains tax also has a lookback period of ten years prior to January 1, 2024.
Judicial interpretations of the capital gains tax are not currently available and the implications of such amendments and potential enforcement of such remain unclear. We are evaluating the amendments and considering the potential impact on the Company as a result of the Business Combination and the previous transaction by which Greenstone obtained its interest in BMC, the holding company of our mining assets. If the new capital gains tax were to apply to such transactions, it could have a material adverse effect on our business and financial condition.
Tax matters and changes in tax laws could materially and adversely affect our business, results of operations, or financial condition.
The Company will have commercial operations in Zimbabwe and will therefore be subject to income taxes in Zimbabwe. As its commercial footprint expands, the Company may also in the future become subject to income taxes in other jurisdictions. The Company’s effective income tax rate could be adversely affected by a number
37
of factors, including changes in the valuation of deferred tax assets and liabilities, changes in tax laws, changes in accounting and tax standards or practices, changes in the composition of operating income, changes in the Company’s operating results before taxes, the unavailability, reduction or elimination of tax incentives, and the outcome of income tax audits in Zimbabwe or other jurisdictions. The Company will regularly assess all of these matters to determine the adequacy of its tax liabilities. Due to the complexity of multinational tax obligations and filings, the Company may have a heightened risk related to audits or examinations by national and local taxing authorities in the jurisdictions in which it operates. Outcomes from these audits or examinations, including transfer pricing adjustments, could subject the Company to additional income tax expenses and materially and adversely affect the Company’s business, results of operations, or financial condition.
If the Company is characterized as a passive foreign investment company for U.S. federal income tax purposes, its U.S. shareholders may suffer adverse tax consequences.
For U.S. federal income tax purposes, the Company will generally be a passive foreign investment company (“PFIC”) within the meaning of Section 1297 of the Internal Revenue Code for any taxable year in which, either (i) at least 75% of our gross income consists of passive income or (ii) at least 50% of the average value of our assets (generally determined on a quarterly basis) consists of assets that produce, or are held for the production of, passive income. Whether the Company is a PFIC for any taxable year is a fact-intensive inquiry that depends, in part, upon the composition and classification of the Company’s income and assets from time to time. The tests for determining PFIC status are applied annually after the close of the taxable year, and it is difficult to predict accurately future income and assets relevant to this determination. Accordingly, there can no assurance that the Company will not be a PFIC for its current taxable year or any future taxable year.
If the Company is or becomes a PFIC for any taxable year (or portion thereof) during which a U.S. holder (as defined in “Material U.S. Federal Income Tax Considerations”) holds Ordinary Shares or Warrants, certain adverse U.S. federal income tax consequences may apply to such U.S. holder, including (i) the treatment of all or a portion of any gain on disposition as ordinary income, (ii) the application of a deferred interest charge on such gain and the receipt of certain dividends, and (iii) compliance with certain reporting requirements. The Company does not intend to provide the information that would enable investors to make a qualified electing fund election that could mitigate the adverse U.S. federal income tax consequences should the Company be classified as a PFIC.
Please see “U.S. Federal Income Tax Considerations — Ownership and Disposition of Ordinary Shares and Warrants — Passive Foreign Investment Company Rules” for a more detailed discussion with respect to the Company’s potential PFIC status. U.S. holders are urged to consult their tax advisors regarding the possible application of the PFIC rules to holders of Ordinary Shares or Warrants.
38
USE OF PROCEEDS
We are registering the resale of the Resale Shares covered by this prospectus pursuant to the registration rights that we have granted to the Selling Shareholder in the Promissory Note. The Selling Shareholder will receive all net proceeds from the secondary offering of the Resale Shares that may be issued to it. Therefore, we will not receive any net proceeds from such secondary offering and our total capitalization will not be impacted by such net proceeds received by the Selling Shareholder.
The Selling Shareholder will pay any underwriting discounts and commissions and expenses incurred by the Selling Shareholder for brokerage, accounting, tax or legal services or any other expenses incurred by the Selling Shareholder in disposing of the securities. We will bear the costs, fees and expenses incurred in effecting the registration of the securities covered by this prospectus, including all registration and filing fees, and fees and expenses of our counsel and our independent registered public accounting firm. See “Plan of Distribution.”
39
CAPITALIZATION AND INDEBTEDNESS
The following table sets forth the cash and cash equivalents and capitalization of the Company on a consolidated basis as of December 31, 2025. As we will not receive any proceeds from the resale of the Resale Shares sold by the Selling Shareholder, no change is disclosed on a pro forma basis to reflect sales of Ordinary Shares pursuant to this prospectus.
Investors should read this table in conjunction with the sections entitled “Management’s Discussion and Analysis of Financial Condition and Results of Operations” and the audited consolidated financial statements of Namib Minerals, including the notes thereto, included elsewhere in this prospectus for more information. Our historical results do not necessarily indicate our expected results for any future period.
|
(USD in thousands) |
As of |
|||
|
Cash and cash equivalents |
$ |
1,887 |
|
|
|
|
|
|||
|
Debt: |
|
|
||
|
Borrowings |
|
3,177 |
|
|
|
Borrowings for long-term portion |
|
2,006 |
|
|
|
Total indebtedness |
$ |
5,183 |
|
|
|
|
|
|||
|
Equity: |
|
|
||
|
Ordinary Shares |
|
5 |
|
|
|
Share premium |
|
(109,745 |
) |
|
|
Shareholders’ surplus |
|
70,465 |
|
|
|
Total shareholder’s deficit |
|
(39,275 |
) |
|
|
Total capitalization |
$ |
(34,092 |
) |
|
40
DIVIDEND POLICY
The Company has not paid any cash dividends on its equity securities to date. The payment of cash dividends by the Company in the future will be dependent upon the revenues and earnings, if any, capital requirements and general financial condition. The Company Board will consider whether or not to institute a dividend policy. It is presently intended that the Company will retain its earnings for use in business operations and, accordingly, it is not anticipated that the Company Board will declare dividends in the foreseeable future. No assurance can be made that dividends will be declared, or the timing thereof. Such decision remains within the Company Board’s discretion, subject to applicable legal, financial, and contractual requirements.
41
BUSINESS
Overview
Our mission is to become a leading Pan-African multi-asset mining platform for precious and critical metals, particularly gold, and to create safe, sustainable, and profitable mining operations for our employees, our communities, and our shareholders.
We are an established gold producer with an attractive portfolio of three gold mines in Zimbabwe, Africa. Our extensive track record of owning and operating gold mines spans over two decades, and our strategic footprint consists of one producing gold mine and two historically producing gold mines that we are currently positioning to restart operations. Our How Mine is an established, underground gold mine with a strong track record of operations having produced an aggregate of approximately 1.84Moz of gold from 1941 through December 31, 2025. Our other principal assets, the Mazowe Mine and the Redwing Mine, are historically producing gold mines with significant mineral resources. These assets provide us with an identified pathway to operate as a multi-asset gold producer in Africa, as preparatory work is currently underway to restart operations at both mines. On a consolidated basis, combining our estimate as of December 31, 2025 for the How Mine and our estimates as of December 31, 2023 for the Mazowe Mine and the Redwing Mine, our underground measured and indicated gold resources (exclusive of reserves) totaled 2.5Moz at a grade of 2.26g/t Au and our underground inferred gold resources totaled 4.4Moz. We are also evaluating opportunities to acquire mining interests in, and expand our operations to, the Democratic Republic of Congo (“DRC”) to unlock critical battery metals in the region.
The table below sets forth our consolidated gold Mineral Resources and Mineral Reserves that combines our estimate as of December 31, 2025 for the How Mine and our estimates as of December 31, 2023 for the Mazowe Mine and the Redwing Mine. Mineral Resources are reported on an in-situ basis, assuming a gold metallurgical recovery of 89.0%, 88.0%, and 90.0% with respect to each of the How Mine, Mazowe Mine, and Redwing Mine, respectively. Mineral Reserves are reported on a plant feed basis, inclusive of dilution and ore loss modifying factors, assuming a gold metallurgical recovery of 89.0%.
Mineral Resources and Mineral Reserves Summary
|
Tonnage |
Grade |
Gold |
||||
|
Proved |
1.08 |
1.40 |
48 |
|||
|
Probable |
0.52 |
1.70 |
28 |
|||
|
Subtotal Underground Reserves |
1.60 |
1.50 |
77 |
|||
|
Dumps |
0.89 |
0.89 |
26 |
|||
|
Total Reserves |
2.49 |
1.29 |
103 |
|||
|
Measured & Indicated |
34.72 |
2.26 |
2,525 |
|||
|
Inferred (Underground) |
50.12 |
2.74 |
4,419 |
|||
|
Inferred (Surface) |
12.00 |
0.59 |
220 |
We believe our portfolio of gold mining assets positions us for continued growth as one of Zimbabwe’s leading gold producers. We believe that our strong free cash flow generation from our current operations at the How Mine will assist in facilitating new project development across all of our mining assets and allow us to pursue additional exploration initiatives. We are currently investing in a shaft sinking development project and milling plant expansion at the How Mine, with operation anticipated to commence in late 2026. We also believe the historical track record of production at the Mazowe Mine and the Redwing Mine, combined with our operational experience at these mines and in Zimbabwe, position us to restart production more efficiently.
Our gold mines include:
• How Mine: We believe the How Mine is one of the most historically prolific gold mines in Zimbabwe having produced approximately 1.84Moz from 1941 through December 31, 2025. The How Mine operates at a relatively shallow depth which we believe helps make our operations inherently safer and more efficient. We have a processing facility in place at the How Mine that can support a milling capacity of approximately 475ktpa.
As we continually seek to explore growth opportunities at the How Mine, we are currently in the process of implementing a development project, primarily consisting of processing plant capacity and power upgrades, which is anticipated to increase milled tonnage capacity. Running concurrently with this
42
project, we are developing Life-of-mine (“LOM”) extension projects of exploration and shaft sinking on the downdip of the How Mine, which is anticipated to allow for the extraction of resources below our current operating depth. In addition to the strong asset quality at the How Mine, the operations are also safe and sustainable, having achieved recertification on all three International Organization for Standardization (“ISO”) based management systems during the year ended December 31, 2025. As of December 31, 2025, the How Mine had 2.49Mt of total reserves, 23.9Mt of total measured and indicated resources, and 43.0Mt of inferred resources on a tonnage basis, representing 103koz of gold reserves, 1,046koz of total measured and indicated gold resources, and 2,396koz of inferred gold resources, respectively.
• Mazowe Mine: The Mazowe Mine is one of the oldest mines in Zimbabwe, with exploration and development dating back to 1890. In August 2018, the Mazowe Mine was placed into care and maintenance, which means processes and conditions on a closed mine site where there is potential to recommence operations at a later date, due to economic challenges, natural events including flooding, and milling capacity constraints. As of 2023, the Mazowe Mine had produced approximately 1.36Moz. The Mazowe Mine still has significant production potential with 1.17Mt of total measured and indicated gold resources and 3.29Mt of inferred gold resources on a tonnage basis, representing 291koz of total measured and indicated gold resources and 915koz of inferred gold resources, respectively, as of December 31, 2023. In order to unlock this resource potential, we have begun preparatory work to restart operations at the Mazowe Mine. We believe the Mazowe Mine boasts one of the highest ore grades among our publicly reporting peers at 7.77g/t Au for total measured and indicated gold resources, and 8.65g/t Au for inferred gold resources. Our strategic exploration and expansion of measured, indicated, and inferred resources at the Mazowe Mine is expected to require the construction and development of plant, surface infrastructure, and a Tailing Storage Facility (“TSF”) as well as underground development and mine dewatering operations. Assuming we obtain the required capital resources, we expect that the strategic exploration and expansion could be completed in a three-year period following receipt of adequate financing, of which there can be no certainty. See “— Mineral Resources and Mineral Reserve Summary Disclosure — Mazowe Mine — Plans to Recommence Operations” for more information on the restart of the Mazowe Mine.
• Redwing Mine: The Redwing Mine is the largest mine in our portfolio and is located 20km North-Northeast of Mutare, Zimbabwe. In April 2019, the Redwing Mine was also placed into care and maintenance due to economic challenges and milling capacity constraints. As of December 31, 2023, the Redwing Mine had 9.65Mt of total measured and indicated gold resources and 15.83Mt of inferred gold resources on a tonnage basis, representing 1.19Moz of measured and indicated gold resources and 1.33Moz of inferred gold resources, respectively. In order to unlock this mineral resource potential, we have begun preparatory work to restart operations at the Redwing Mine. In addition to the existing estimated gold resources, we believe there is significant upside potential, subject to further geological investigation. Our strategic exploration and expansion of measured, indicated, and inferred resources at the Redwing Mine is expected to require the construction and development of plant, mine shallow, sink shaft, and TSF as well as underground development and mine dewatering operations. Assuming we obtain the required capital resources, we expect that the strategic exploration and expansion could be completed in a three-year period following receipt of adequate financing, of which there can be no certainty. See “— Mineral Resources and Mineral Reserve Summary Disclosure — Redwing Mine — Plans to Recommence Operations” for more information on the restart of the Redwing Mine.
Our portfolio of assets benefits from the critical importance of gold mining to the economic health and prospects of Zimbabwe. According to the Quarterly Member Brief of the Chamber of Mines of Zimbabwe (“COMZ”) for the third quarter of 2025, gold deliveries to Fidelity increased by 26% during the third quarter of 2025, reaching 12,979 kg, up from 10,310 kg in the same period the prior year. The country’s topography and geological characteristics provide several attractive mining belts with potential for further discoveries, evidenced by over 4,000 documented gold deposits according to the Zimbabwe Investment Development Agency. Mining is a significant part of Zimbabwe’s economy, accounting for 80% of exports, 19% of government revenues, and 14% of national income, according to the COMZ’s 2024 Mining Industry Prospects Report. We believe that a combination of these factors provides strong tailwinds for the current and future importance of gold mining to the Zimbabwean economy. Overall, we believe that the legislative environment is very supportive of mining and development. For example, in May 2023, Zimbabwe passed the Responsible Mining Initiative to combat illegal mining and
43
removed the historical indigenization rule, which required 51% local investor ownership, thus making the country more attractive for foreign direct investment (“FDI”). Additionally, the Mines and Minerals Act provides for the establishment of a Special Mining Lease (“SML”), allowing for the direct export of gold and increased exposure to the U.S. dollar. We intend to pursue SMLs for our Mazowe Mine and Redwing Mine in part to reduce our risk exposure to local currency dynamics, including inflation.
As a long-term gold mining operator in Zimbabwe, we are committed to the sustainable development of our projects by deeply embedding environmental, social, and governance (“ESG”) criteria in our decision-making framework from the earliest stages of project exploration and development. We have historically been committed to analyzing and improving working conditions for our employees through our Safety, Health, Environment, and Quality (SHEQ) Initiative. This comprehensive program encompasses an environmental management system, an occupational health and safety system, and a quality management system, all geared towards realizing our vision of fostering a “zero-harm environment.” The How Mine operates under the SHEQ systems and complies with ISO standards (14001, 9001 and 45001) for environmental responsibility, quality, and occupational health and safety, illustrating our dedication to safety and compliance, and we plan to adopt similar systems at the Redwing Mine and the Mazowe Mine. In addition to our adherence to strict safety standards, we also prioritize sustainably operating in the Zimbabwean gold mining industry with a collective growth mission to generate community development. Community development and a “safety-first” approach to doing business are core tenants of our operational focus.
Industry Overview and Market Opportunity
The Gold Industry
Gold is typically mined from gold-bearing deposits using various methods, including underground mining, open-pit mining, placer mining, and heap leaching. The choice of mining method depends on factors such as location, deposit size, grade, and economic considerations.
Gold has long been prized for its role as a strategic financial investment. Its value can hold steady or even rise during economic turmoil, making it a valuable tool for diversification. The gold market is highly liquid, with consistent trading liquidity that allows for efficient buying and selling of the assets on international exchanges, as well as direct purchases between industry participants. Historically, gold prices have shown a strong upward trend, with an increase of nearly 8% per annum in U.S. dollars since 1971, according to the World Gold Council.
Recent Gold Prices
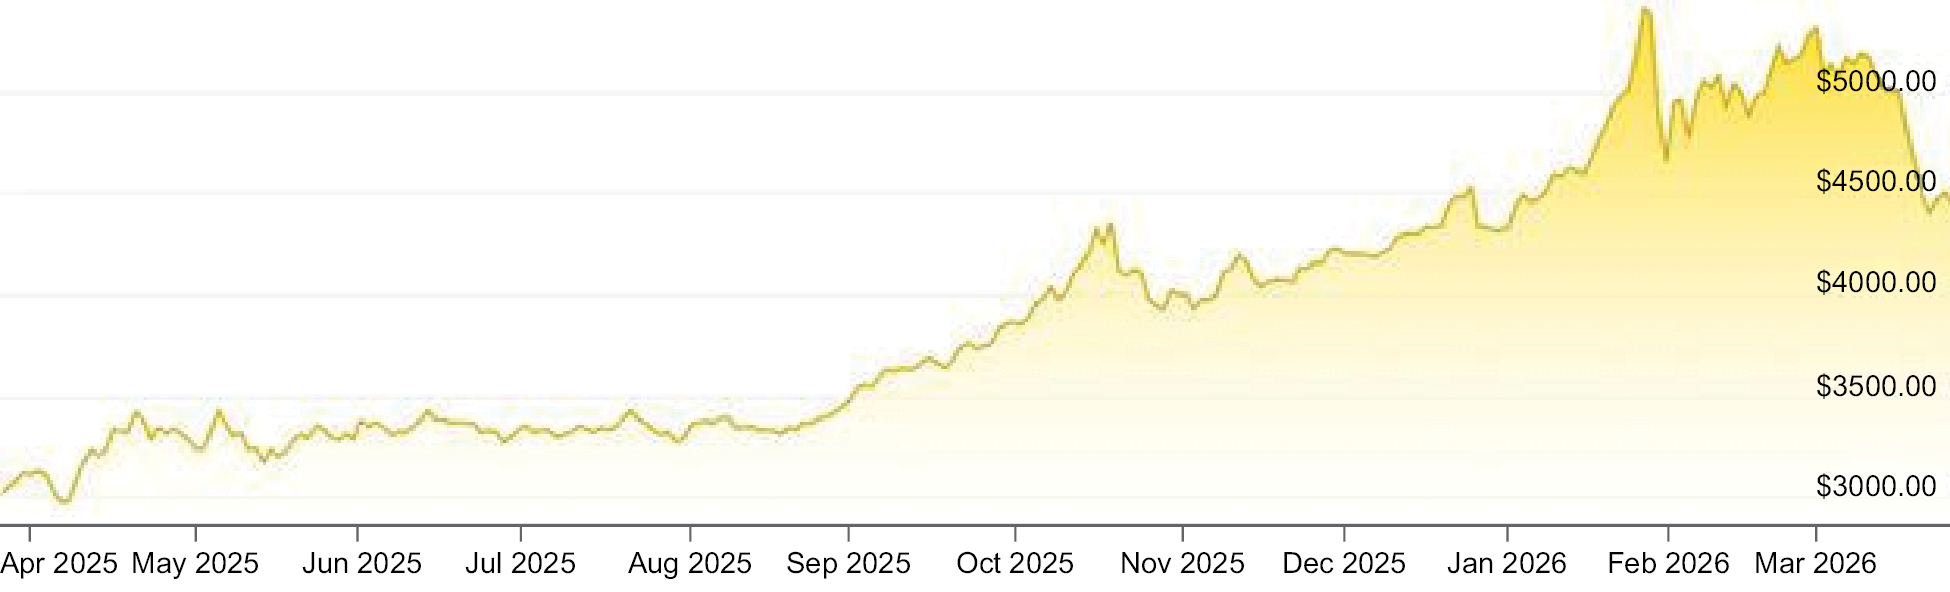
Source: Jmbullion.com. Chart represents price per ounce in dollars.
Total demand for gold continues to be bolstered by central banks. In addition to central bank purchases, gold demand is also bolstered by the asset’s use in jewelry, electronics, and other industrial end-market applications. Gold, with strong conductivity properties, is critical for many electrical applications. The recent rise in the demand for artificial intelligence (“AI”) computing power and the associated electronics required have played an increasingly relevant role in the gold markets. However, investments in gold have largely driven overall demand growth over the last year. According to the World Gold Council, total investment in gold increased 84% during 2025.
44
On the supply side, gold mining output historically has not kept pace with the increased levels of demand as increasingly sophisticated techniques are needed to extract the ever-dwindling accessible global reserves. Mined gold output, which was comprised of approximately 72% of total gold supply, remained constant during 2025, according to the World Gold Council.
Gold Mining in Zimbabwe
Zimbabwe is a highly prolific gold producer. According to the COMZ 2023 Annual Report, gold output in Zimbabwe reached a record high of 37.3 tonnes in 2022, up from 31.5 tonnes in 2021, and was 32.4 tonnes in 2023. The country’s topography and geological characteristics provide several attractive mining belts with potential for further discoveries, evidenced by over 4,000 documented mineral deposits according to the Zimbabwe Investment Development Agency. Beyond gold, Zimbabwe has other key active mining resources including copper, lithium, nickel, coal, and platinum. Mining is a significant part of Zimbabwe’s economy, accounting for 80% of exports, 19% of government revenues, and 14% of national income, according to the COMZ’s 2024 Mining Industry Prospects Report. The country’s mining industry is characterized by professionally run mines with low costs of production and resilient infrastructure, including extensive road and railway networks. In addition, government incentives have driven the adoption of solar power, providing access to a sustainable energy supply that is cost effective, and specialized mining training programs in Zimbabwe provide ready access to a skilled labor force. We believe that a combination of these factors provides strong tailwinds for the current and future importance of gold mining to the Zimbabwean economy. Overall, we believe that the legislative environment is very supportive of mining and development. For example, in May 2023, Zimbabwe passed the Responsible Mining Initiative to combat illegal mining and removed the historical indigenization rule, which required 51% local investor ownership, thus making the country more attractive for FDI. Additionally, the Mines and Minerals Act provides for the establishment of a SML, allowing for the direct export of gold and increased exposure to the U.S. dollar. We believe the use of SMLs will propel the development of the sector in Zimbabwe by allowing gold miners to avoid financial implications of dealing in local market currencies. We intend to pursue SMLs for our Mazowe Mine and Redwing Mine in part to reduce our risk exposure to local currency dynamics, including inflation.
The Copper and Cobalt Industry
Copper and cobalt are increasingly viewed as strategic investments crucial for the clean energy transition. Their value is tied to their critical role in technologies like electric vehicles and renewable energy infrastructure. Copper has highly conductive properties which are essential to building the electronics required for clean energy developments, driving significant demand for the metal. According to a 2025 Global Critical Minerals Outlook report by the International Energy Agency, copper demand is projected to eclipse 34 million tonnes by 2040, representing an increase of over 27% from 2024.
Recent Copper Prices
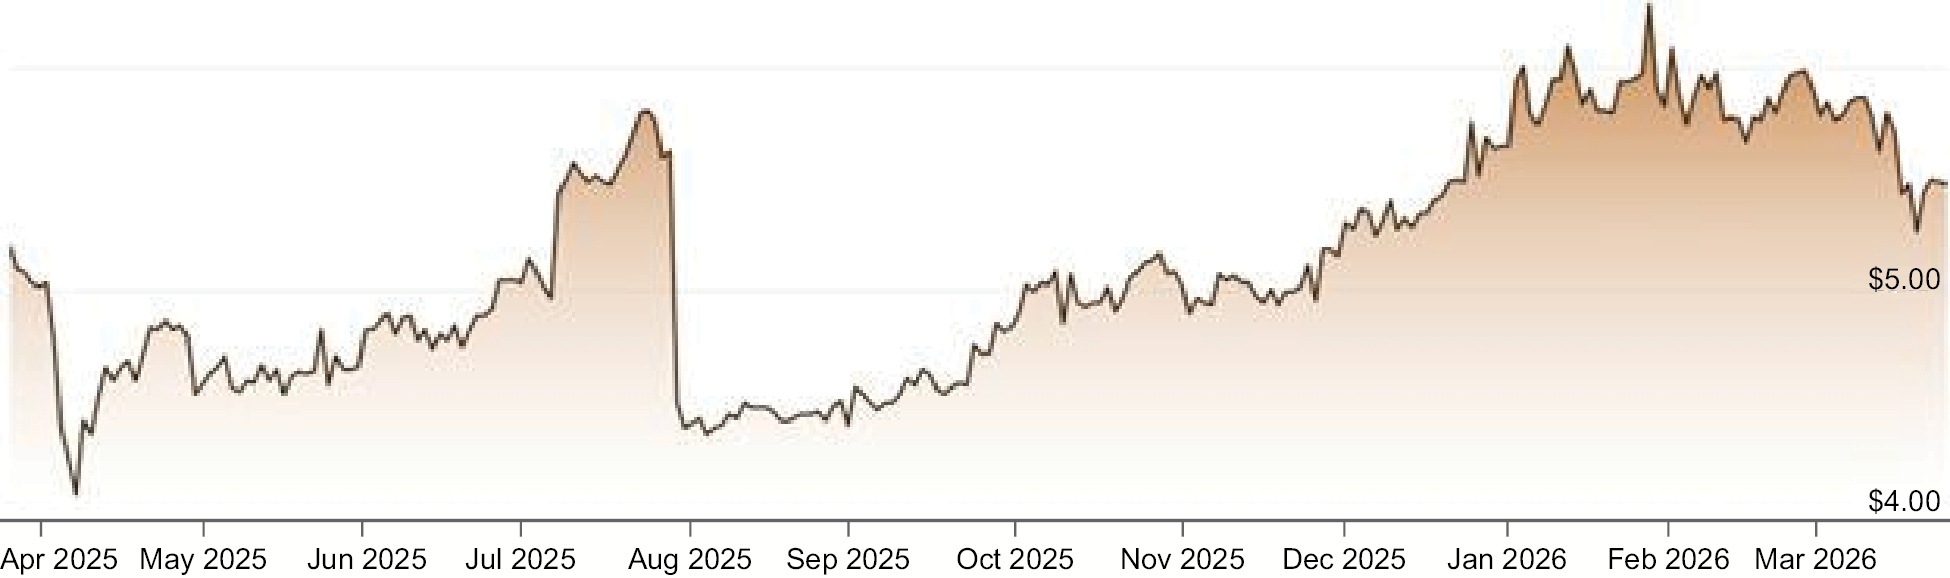
Source: Jmbullion.com. Chart represents price per pound in dollars.
Similar to copper, cobalt is an essential metal for the electrification of vehicles, with demand consistently rising over the past few years as the electric vehicle market has accelerated. Cobalt’s unique properties make it essential for lithium-ion batteries that power electric vehicles and energy storage systems. According to a 2025 Global Critical Minerals Outlook report by the International Energy Agency, cobalt demand is forecasted to eclipse 330kt, representing an increase of over 49% from 2024. Cobalt reserves are primarily concentrated in a
45
few geographical regions, such as the DRC, and, unlike copper, cobalt is primarily a byproduct of other mining operations, introducing additional complexities to direct access to these resources. Overall, the markets for both copper and cobalt are highly liquid, ensuring efficient trade execution. The confluence of rising demand and limited geographic availability of the resources makes copper and cobalt integral considerations for the clean energy market.
Our Competitive Strengths
We believe that our high-quality asset base and differentiated approach to becoming a leading multi-asset mining platform in Africa distinguishes us from our peers and creates a unique opportunity for growth and value creation. Our competitive strengths include:
Significant resource base with substantial, high-grade mineral resources. The foundation of our business is our portfolio of gold mines and our substantial and attractive resource base. On a consolidated basis, combining our estimate for the How Mine as of December 31, 2025 and our estimates for the Mazowe Mine and Redwing Mine as of December 31, 2023, we had 2.49Mt of total reserves, 34.72Mt of total measured and indicated gold resources, and 62.12Mt of inferred gold resources on a tonnage basis, representing 103koz of gold reserves, 2.5Moz of measured and indicated gold resources, and 4.6Moz of inferred gold resources, respectively. This total resource base consists of grades of 1.29g/t Au for gold reserves and an average of 2.26g/t Au for total measured and indicated resources. The resource quality facilitates greater recovery rates and allow us to produce gold at significantly lower costs compared to lower-grade resources. Our existing resource base is well positioned to provide further exploration upside as we have already identified multiple additional targets down-shaft and on surface to increase reserves.
Established gold producer with low-cost base driving strong margins. We are an established African gold producer with a long operating history in Zimbabwe. Since its inception in 1941, the How Mine has produced approximately 1.84Moz of gold. Of this production, approximately 25koz was produced in 2025. We believe that the relatively shallow nature of the resources and the minerology of the ore (free milling) results in the How Mine operating at relatively lower C1 Costs. Complementing these cost efficiencies is our ability to conduct our operations primarily in U.S. dollars, which further enhances our cost profile and mitigates potential risks relating to local market currency dynamics, including inflation.
Well positioned to capitalize on strong and improving gold fundamentals. Gold has long been prized for its role as a strategic financial investment. Its value can hold steady or even rise during economic turmoil, making it a valuable tool for diversification. Historically, gold prices have shown a strong upward trend, with an increase of nearly 8% per annum in USD since 1971, according to the World Gold Council. The gold market is highly liquid, with consistent trading liquidity that allows for efficient buying and selling of the asset on international exchanges, as well as direct purchases between industry participants. Demand for gold continues to be bolstered by central banks, uses in jewelry and electronics, and other industrial end-market applications including technology products with strong exposure to trends in artificial intelligence. We believe we currently represent a highly attractive opportunity for investors to gain exposure to a primary gold company with attractive gold mining and reserves assets.
Pathway to multi-asset gold production. In addition to the strong financial profile of the How Mine, we have two additional historically gold-producing mines, the Mazowe Mine and the Redwing Mine, with preparatory work to restart operations underway to return them to production.
• Mazowe Mine. The Mazowe Mine has significant production potential with 1.17Mt of total measured and indicated mineral resources and 3.29Mt of inferred mineral resources on a tonnage basis, representing 291koz of measured and indicated gold resources and 915koz of inferred gold resources, respectively, as of December 31, 2023, and has a domestic water supply in place and power linked to the national grid. The Mazowe Mine will require additional capital expenditures to return to production, and, assuming we obtained the required capital resources, we expect the restart could be completed in a three-year period upon receipt of adequate financing, of which there can be no certainty. See “— Mineral Resources and Mineral Reserve Summary Disclosure — Mazowe Mine — Plans to Recommence Operations” for more information on the restart of the Mazowe Mine.
• Redwing Mine. The Redwing Mine has measured and indicated resources of 1.19Moz at 3.83g/t Au and inferred resources of 1.33Moz at 2.61g/t Au, as of December 31, 2023, and like the Mazowe Mine, the Redwing Mine is supplied with domestic water and is linked to the national power grid. The Redwing Mine will require additional capital expenditures to return to production, and, assuming we obtained the required capital resources, we expect the restart could be completed in a three-year period
46
upon receipt of adequate financing, of which there can be no certainty. See “— Mineral Resources and Mineral Reserve Summary Disclosure — Redwing Mine — Plans to Recommence Operations” for more information on the restart of the Redwing Mine.
Strong commitment to our people, our communities, and the environment. As a long-term gold mining operator in Zimbabwe, we are committed to the sustainable development of our projects by deeply embedding ESG criteria in our decision-making framework from the earliest stages of project exploration and development. We have historically been committed to analyzing and improving working conditions for our employees through our Safety, Health, Environment, and Quality (SHEQ) Initiative. This comprehensive program encompasses an environmental management system, an occupational health and safety system, and a quality management system, all geared towards realizing our vision of fostering a “zero-harm environment.” The How Mine operates under the SHEQ systems and complies with ISO standards (14001, 9001 and 45001) for environmental responsibility, quality, and occupational health and safety, and we plan to adopt similar systems at the Redwing Mine and the Mazowe Mine. In addition, our hazardous waste management protocols comply with international protocols (Stockholm Convention) to minimize waste and promote recycling, while our biodiversity and climate change policies are designed to maximize the protection of wildlife, rehabilitation of disturbed areas, and monitoring of emissions (aligned with UN conventions). We believe that our detailed safety plan has positioned us as an industry leader in terms of safety standards. In addition to our adherence to strict safety standards, we also prioritize sustainably operating in the Zimbabwean gold mining industry with a collective growth mission to generate community development. For example:
• Healthcare: We have provided free medical services to local surrounding communities and have donated medical equipment and funds for the renovation of local hospitals;
• Education: We have promoted STEM education through investments in local high schools and the Zimbabwe School of Mines; and
• Rapid response force: We have established an emergency response team to respond to surrounding communities’ calls.
Community development and improvement and a “safety-first” approach to doing business are engrained in our culture and are core tenants of our operational focus.
Experienced team with a proven track record in mining and operating in Zimbabwe. We have an experienced management team with a track record of successfully identifying and developing mineral discoveries, having operated in Zimbabwe for more than 20 years. Our Chief Executive Officer, Chief Financial Officer and Director, Tulani Sikwila, has over 20 years of operational, accounting, and finance expertise in the mining industry. Mr. Sikwila commenced his career at Ernst & Young in 2001 and is a chartered accountant and leads our experienced management team.
Our Growth Strategies
We believe we can achieve our goal of becoming a leading Pan-African multi-asset mining platform for precious and critical metals by executing the following strategies:
Strategically expand our gold production capacity in a capital efficient manner. We continually seek to increase the life of our current mining operations through efficient expenditures on effective and de-risked mining development initiatives. By leveraging our geological understanding and extensive familiarity and knowledge of our deposits, we believe we can identify and delineate new mineral reserves and mineral resources more deliberately and less speculatively. In order to optimize our gold production and grow our free cash flow, we undertake continuous exploration and development to replace the mineral reserves that we mine so we can maintain and grow our reserve base over time. For example, our future development strategy for the How Mine is focused on expanding the production capacity in carefully planned and designed stages to maximize results while managing capital requirements, and we are in the process of engaging a third party for the processing and treatment of our sands at How Mine, subject to successful testing and negotiation of final agreements.
For our Mazowe Mine and Redwing Mine, we have a competitive advantage because we are able to rely on historical production knowledge and data to strategically design our restart initiative. We have completed internal prefeasibility studies for both mines, and our goal is to complete the dewatering, mine design, facility upgrades, and equipping of the Mazowe Mine and the Redwing Mine within three years of raising the requisite
47
capital to fund these projects. The Company has commenced dewatering at the Redwing Mine and is undertaking preparations for dewatering at the Mazowe Mine. We have also begun feasibility studies at both mines, which will take approximately 12 to 18 months to complete. See “— Mineral Resources and Mineral Reserve Summary Disclosure — Mazowe Mine — Plans to Recommence Operations” and “— Mineral Resources and Mineral Reserve Summary Disclosure — Redwing Mine — Plans to Recommence Operations” for more information on the restart of the Mazowe Mine and Redwing Mine. Our ability to execute our restart strategy in respect of the Redwing Mine and the Mazowe Mine may be influenced by a variety of factors associated with the mining sector, including but not limited to obtaining the necessary financing, we encounter unexpected issues or delays in the dewatering and other pre-operational activities required to restart the two mines, or we are impacted by unexpected local or global events beyond our control.
Drive additional cost efficiencies in our mining operations. While we have already achieved favorable cost performance, we have identified additional opportunities that we expect may reduce our ongoing operating costs over time while simultaneously reducing our carbon footprint. More specifically, we intend to focus on mine development and production rate increases, productivity increases, fixed cost management initiatives, and operational stability and efficiency through new energy sources. At the How Mine, we believe we can improve our C1 Costs by:
• Negotiating attractive long-term contracts for solar power integration;
• Migrating the power source toward an Independent Supplying Group;
• Installing capacitors to better manage volatile energy costs; and
• Drilling boreholes for potable water to reduce the consumption of high-cost water.
We intend to leverage our expertise and long history of mining exploration and production experience to implement operational improvements and continue to identify and evaluate new opportunities to achieve our objectives and long-term goals.
Continue to drive safe and sustainable operations for our employees, our communities and our shareholders. Our safety-first and community development approaches to doing business will remain a core tenet of our operational focus and business strategy. We are committed to continually improving working conditions for our employees through Safety, Health, Environment, and Quality (SHEQ) Initiatives, which are designed to help us realize our vision of a “zero-harm environment.” We also plan to be a leading participant of the African mining industry in increasing the sustainability of our operations through our collective growth mission to further community development. Our commitment to investing in medical services, local education, and a rapid response force to emergency calls all play critical roles in fostering symbiotic relationships with the communities in which we operate. We believe that continuing to focus on our people, communities and the environment will position us to attract the best local talent and ensure that we have efficient, stable, and long-term operations that continually elevate the people around our operations and where they live.
Pursue attractive mining opportunities for copper and cobalt. Fueled by the global push for clean energy, demand for copper, cobalt, and other battery metals is experiencing significant growth according to a May 2024 report by the International Energy Agency. We are currently evaluating potential mining opportunities in the DRC to unlock critical battery metals in the region. We believe that our mining expertise and our extensive experience operating in Africa will allow us to efficiently pursue our expansion strategy in the DRC and capitalize on this large and growing market opportunity.
Opportunistically acquire, develop, and operate complementary mining assets. We continuously analyze new opportunities to expand our portfolio of mining assets. Our senior management team has a demonstrated track record of identifying and acquiring high-quality mining assets at attractive valuations. We believe that our assets and those that we seek to acquire are geologically and logistically advantaged based on their ore grade and access to consistent power supply and qualified local labor. Once acquired, we have demonstrated success in the prompt exploration and permitting of new mines and the building of long-lived resources through targeted development. We intend to continue to pursue similar opportunities within the gold industry as well as copper, cobalt and other battery metals that would be strategic and complementary to our existing high-quality portfolio of gold mines in Africa.
48
Our History
The legal name of the Company is “Namib Minerals.” The Company was incorporated under the laws of the Cayman Islands on May 27, 2024 as an exempted company limited by shares with registration number 410406, having its registered office and mailing address for its principal executive office at Appleby Global Services (Cayman) Limited, Suite 210, 2nd Floor, Windward III, Regatta Office Park, P.O. Box 500, Grand Cayman, Cayman Islands, KY1-1106, and its telephone number is (345) 769-4909.
As part of the Business Combination, the Company acquired Greenstone, which holds all of the Company’s assets, and prior to that the Company had no operating activity. In June 2024, in connection with the execution of the Business Combination Agreement, Greenstone acquired from Metallon and one of its affiliates 100% of the outstanding shares of BMC. BMC owns all of the interests in How Mining Company, the Mazowe Mining Company, and the Redwing Mining Company. Prior to June 2024, Greenstone had no operating activity. BMC and our predecessor companies acquired the How Mine, the Mazowe Mine, and the Redwing Mine in 2002. By 2007 we had grown to become one of the largest gold producers in Zimbabwe with a peak production capacity of approximately 92kozpa. In 2008, significant inflation in Zimbabwe led to an economic downturn and production halt, at which time we placed all of our mines into care and maintenance. By 2009, we began recommencement of mining operations and by 2013 production had nearly doubled from 2010 levels. In 2018 and 2019, the Mazowe Mine and the Redwing Mine, respectively, were again placed again into care and maintenance due to an unattractive economic profile caused in part by implications of Zimbabwean monetary policy. Currently, preparatory work is underway to recommence operations at the Mazowe Mine and the Redwing Mine.
On June 5, 2025 (the “Closing Date”), the Company, Red Rock, SPAC Merger Sub, Greenstone Merger Sub, and Greenstone consummated (the “Closing”) the Business Combination. In accordance with terms of the Business Combination Agreement:
• Greenstone Merger Sub merged with and into Greenstone (the “Greenstone Merger”), with Greenstone being the surviving entity of the Greenstone Merger and becoming a wholly-owned subsidiary of the Company;
• immediately following the Greenstone Merger, SPAC Merger Sub merged with and into Red Rock (the “SPAC Merger”), with Red Rock being the surviving entity of the SPAC Merger and becoming a wholly-owned subsidiary of the Company;
• (a) each issued and outstanding share of common stock of Red Rock, par value $0.0001 per share, was cancelled in exchange for the right to receive one Ordinary Share, and (b) each outstanding warrant of Red Rock exercisable for one share of Class A common stock of Red Rock, par value $0.0001 per share, became a Warrant of the Company exercisable for one Ordinary Share on the same terms and conditions; and
• the ordinary shares in the capital of Greenstone, par value $1.00 per share, that were issued and outstanding were exchanged for an aggregate of 48,869,960 Ordinary Shares.
On June 6, 2025, the Ordinary Shares and Warrants began trading on Nasdaq under the symbols “NAMM” and “NAMMW,” respectively.
Registration Rights and Lock-up Agreement
On the Closing Date and in connection with the Business Combination, the Company, the Initial Shareholders and certain Former Greenstone Shareholders, consisting of the SelliBen Trust, Mzilikazi Godfrey Khumalo (“Khumalo”) and entities controlled by our executive officers (collectively, the “Holders”) entered into the Registration Rights and Lock-up Agreement pursuant to which, among other things, the Company granted the Holders customary demand and piggyback registration rights. In addition, the Holders, other than Khumalo, agreed not to transfer for a period of 12 months after the Closing any registrable securities in the Company acquired by such person in connection with the Business Combination (such equity, “Lock-up Shares”), subject to certain exceptions, including the transfer of the Sponsor Warrants (and the Ordinary Shares underlying
49
such Warrants), the Polar Shares, and 800,000 Ordinary Shares initially held by the SPAC Sponsor, provided that (x) 50% of the Lock-up Shares will be released on such date on which the last reported sale price of the Ordinary Shares equals or exceeds $12.50 per Ordinary Share (as adjusted for share splits, share combinations, share dividends, reorganizations, recapitalizations and the like) for any 20 trading days within a 30-trading day period commencing at least 150 days after the Closing Date; and (y) the other 50% of the Lock-up Shares will be released on the date on which the last reported sale price of the Ordinary Shares equals or exceeds $15.00 per Ordinary Share (as adjusted for share splits, share combinations, share dividends, reorganizations, recapitalizations and the like) for any 20 trading days within a 30-trading day period commencing at least 150 days after the Closing Date.
Of the issued and outstanding Ordinary Shares, 44,999,296 are subject to the transfer restrictions contained the Registration Rights and Lock-up Agreement. The transfer restrictions of the Registration Rights and Lock-up Agreement do not apply to, among other exceptions, the securities held by Khumalo, the Polar Shares, transfers of the Sponsor Warrants (including any Ordinary Shares issuable upon the exercise of any such warrant), and transfers of an aggregate of 800,000 Ordinary Shares initially held by the SPAC Sponsor at Closing. A copy of the Registration Rights and Lock-up Agreement has been filed as an exhibit to the Registration Statement of which this prospectus forms a part.
Earnout Shares
The Business Combination Agreement provides that, during the Earnout Period, the Company is obligated to issue, in addition to the Ordinary Shares issued at the Closing, up to 30.0 million Ordinary Shares to the Former Greenstone Shareholders, including the SelliBen Trust, Khumalo and entities controlled by our executive officers, upon and subject to the achievement of the following milestones:
(i) 1.0 million Ordinary Shares, when the Company delivers a bankable feasibility study for the Mazowe Mine;
(ii) 4.0 million Ordinary Shares, if the Mazowe Mine reaches commercial production (i.e., the production of the first gold bar after processing and smelting);
(iii) 1.0 million Ordinary Shares, when the Company delivers a bankable feasibility study for the Redwing Mine;
(iv) 4.0 million Ordinary Shares, if the Redwing Mine reaches commercial production (i.e., the production of the first gold bar after processing and smelting); and
(v) 10.0 million Ordinary Shares, if the net present value of certain exploration projects in the DRC, as identified in a bankable feasibility study, is greater than or equal to $1.0 billion, with an additional 10.0 million shares if such net present value is greater than or equal to $2.0 billion.
Upon the occurrence of a change of control (as defined in the Business Combination Agreement) of the Company during the Earnout Period, then all milestones described above will be deemed to have been satisfied and all Earnout Shares that have not been previously issued will be issued to the Former Greenstone Shareholders effective as of immediately prior to the consummation of such change of control. A copy of the Business Combination Agreement has been filed as an exhibit to the Registration Statement of which this prospectus forms a part.
50
Capital Expenditures
The total capital expenditures for the Company were $6.7 million, $8.7 million and $11.6 million for the years ended December 31, 2023, 2024 and 2025, respectively, as set forth in the table below. There were no significant divestitures during these time periods. Funding for these expenditures were mainly sourced from internal cash flows and partly from borrowings from African Banking Corporation of Zimbabwe Limited.
|
For the Year Ended December 31, |
|||||||||
|
Category |
2023 |
2024 |
2025 |
||||||
|
Underground Equipment |
$ |
1,173,376 |
$ |
1,192,865 |
$ |
1,761,146 |
|||
|
Surface Plant & Equipment |
|
1,779,423 |
|
1,936,064 |
|
2,750,351 |
|||
|
Buildings |
|
— |
|
— |
|
1,155,000 |
|||
|
Vehicles |
|
182,900 |
|
81,300 |
|
372,443 |
|||
|
Other Surface Equipment |
|
178,043 |
|
404,050 |
|
159,151 |
|||
|
Furniture & Fittings |
|
59,577 |
|
288,181 |
|
91,245 |
|||
|
Projects in Progress |
|
3,288,000 |
|
4,794,541 |
|
5,318,664 |
|||
|
$ |
6,661,319 |
$ |
8,697,001 |
$ |
11,608,000 |
||||
|
|
|
|
|||||||
|
Types of Capital Expenditure |
|
|
|
||||||
|
Sustaining Capital Expenditures |
|
6,661,319 |
|
4,459,417 |
|
9,160,000 |
|||
|
Expansion Capital Expenditures |
|
— |
|
4,237,584 |
|
2,448,000 |
|||
|
$ |
6,661,319 |
$ |
8,697,001 |
$ |
11,608,000 |
||||
|
|
|
|
|||||||
|
Breakdown by Operating Segment |
|
|
|
||||||
|
How Mine |
$ |
6,334,319 |
$ |
8,660,001 |
$ |
11,449,042 |
|||
|
Mazowe |
|
327,000 |
|
37,000 |
|
55,000 |
|||
|
Redwing |
|
— |
|
— |
|
69,000 |
|||
|
Corporate |
|
|
|
|
|
34,958 |
|||
|
$ |
6,661,319 |
$ |
8,697,001 |
$ |
11,608,000 |
||||
The Company anticipates incurring sustaining and expanding capital expenditures in an aggregate amount of approximately $17 million at the How Mine for the year ended December 31, 2026. These amounts are anticipated to relate to, among other purposes, underground and surface equipment as well as vehicles. There are no anticipated divestitures in 2026.
Sales Arrangements
The Company sells all of its gold production in Zimbabwe to Fidelity, as required by Zimbabwean legislation. All sales are at the London Base Metal Association spot price at the date of the transaction and the official exchange rate on the date of sale. Gold sales are generally subject to a 5% royalty payment if sold at a time when its price is above $1,200 per ounce and a 3% royalty payment if the price is below $1,200 per ounce. Starting in 2026, a 10% royalty will apply if the price is above $5,000 per ounce. During 2025, all of the Company’s gold sales incurred a 5% royalty.
We are paid in part with Zimbabwe’s local currency and part with U.S. Dollars, as required by law. The proportion to be paid in U.S. Dollars and Zimbabwe’s local currency is set from time to time by the Zimbabwean government, and from February 2023 until February 2025, we received 75% of our proceeds in U.S. Dollars and 25% in local currency. Since February 2025, we have received 70% of our proceeds in U.S. Dollars and 30% in local currency. See “Risk Factors — Risks Related to Our Business, Operations and Industry — Fluctuating foreign currency and exchange rates as well as Zimbabwean exchange controls may negatively impact our business, results of operations, and financial position.” Local currency has been paid in ZiG, Zimbabwe’s currency since April 2024, but has historically been paid in RTG. Exchange rates of RTG for U.S. Dollars have varied vastly over the last several years. A holder of a special mining lease is permitted to directly export its gold and thereby increase the amount it can be paid in U.S. Dollars.
51
Intellectual Property
The Company does not hold any patents and is not dependent on intellectual property (including patents or licenses), industrial, commercial or financial contracts (including contracts with customers or suppliers) or new manufacturing processes for the conduct of its business as a whole.
Seasonality
We operate our mines continuously throughout the year, with no interruptions due to seasonal changes.
Raw Materials
The principal raw materials used in the mining operations are fuel, electricity, and water. Diesel fuel is used to power front-end loaders, tractors, motor vehicles and standby power generators. Oil and energy prices are important costs for the Company’s business. The price of oil can be volatile as a result of, among other reasons, geopolitical tensions, such as the war between Russia and Ukraine and the more recent conflict in the Middle East. We obtain the majority of our electricity from the national grid in Zimbabwe and a portion of our electricity pursuant to a private arrangement whereby electricity is imported. We are also seeking to develop solar power generation at the How Mine. The Company also uses chemicals, including cyanide and hydrogen peroxide, in the production of gold. These chemicals are available from a number of suppliers and do not represent a material portion of the Company’s costs. We are not currently experiencing any supply shortages on critical consumables utilized in the production of gold across our operations. In addition, our stocking strategies account for potential lead time variation and supply constraints, thus minimizing the risk of changes in the marketplace. Recently, for example, the How Mine completed upgrading the on-site fuel pump station to a holding capacity of 35,000 liters. The higher cost for basic commodities used in our communities, and as key production inputs, could impact the costs of our raw materials. See “Risk Factors — Risks Related to Our Business, Operations and Industry — We cannot guarantee that there will not be an increase in input costs affecting our results of operations and financial performance” and “Risk Factors — Risks Related to Our Business, Operations and Industry — Our operations are vulnerable to infrastructure constraints, including power and water supply.”
Environmental, Health, and Safety Matters
As a long-term gold mining operator in Zimbabwe, we are committed to the sustainable development of our projects by deeply embedding ESG criteria in our decision-making framework from the earliest stages of project exploration and development. We have historically been committed to analyzing and improving working conditions for our employees through our SHEQ Initiative. This comprehensive program encompasses an environmental management system, an occupational health and safety system, and a quality management system, all geared towards realizing our vision of fostering a “zero-harm environment.” The How Mine operates under the SHEQ systems and complies with ISO standards (14001, 9001, and 45001) for environmental responsibility, quality, and occupational health and safety. However, mining is inherently hazardous and there are related risks. See “Risk Factors — Risks Related to Our Business, Operations and Industry — Mining is inherently hazardous and the related risks of events that cause disruptions to our mining operations may adversely impact the environment or the health, safety, or security of our workers or the local community, production, cash flows, and overall profitability.” In addition, we develop Environmental Management Plans for our operations that encompass biodiversity management, greenhouse gas emissions, water impact practices, mine closure practices, among other operational aspects to ensure compliant and consistent practices. For example, the greenhouse gas emissions component of our Environmental Management Plan at the How Mine includes a process for evaluating yearly emissions and ongoing investigations to seek ways to reduce emissions.
The Company also recognizes its responsibility to the community and actively engages in corporate social responsibility initiatives to address local challenges. Current and recent initiatives include a fund supporting underprivileged school children with tuition fees, providing primary healthcare services to community members, offering free medical support to employees and their families, and facilitating transport for children from nearby communities to related primary and secondary schools.
52
Government and Environmental Regulations
The Company’s rights to own and develop mineral resources and deposits are governed by the laws and regulations of the jurisdictions in which these mineral properties are located.
The Company is subject to a wide range of laws and regulations governing all aspects of its operations, including with respect to environmental protection, reclamation, exploration, development, production, taxes, immigration, labor standards and employment issues, occupational health, mine safety, dam safety, toxic substances and wastes, securities and foreign corrupt practices. The Company has made, and expects to make in the future, significant expenditures to comply with these laws and regulations. Non-compliance can result in violations and legal claims, as well as substantial fines, penalties, reputational damage and delays in or suspension of day-to-day operations. Pending or proposed changes to existing laws and regulations, as well as any proposed or contemplated new laws or regulations, could also have significant impacts on the Company’s business and results of operations, the extent of which cannot always be predicted.
For more information on the risks and uncertainties associated with the Company’s mining rights, see “Risk Factors — Risks Related to Our Business, Operations and Industry — Our rights to mine in Zimbabwe are derived from each of the How Mine Lease, the Mazowe Mine Lease, and the Redwing Mine Lease, the loss of which would have a material adverse effect on our financial condition and results of operations”, and “Risk Factors — Risks Related to Our Business, Operations and Industry — Since operations at our Mazowe Mine and Redwing Mine were halted in 2018 and 2019, respectively, we have been subject to litigation regarding disputed debts and corporate rescue proceedings pursuant to Zimbabwean insolvency laws.”
Zimbabwe
General laws relating to mining
The mining industry in Zimbabwe is primarily regulated by The Mines and Minerals Act [Chapter 21:05] commenced on November 1, 1961 (the “Mining Act”) and the Environmental Management Act [Chapter 20:27] commenced on March 17, 2003, as amended (the “Environmental Act”).
To conduct mining exploration, a company needs to be in possession of the applicable license, grant or order pursuant to the terms of the Mining Act. The Mining Affairs Board is generally responsible for granting certain mining rights, the withdrawal or cancellation of such rights, the approval of certain agreements and transactions in the mining sector and making recommendations to the Minister of Mines and Mineral Development or the President of Zimbabwe concerning the granting or withdrawal of certain mining titles. The President of Zimbabwe also possesses the right to grant and withdraw certain mining rights, and the Minister of Mines and Mineral Development and the Ministry of Mines and Development Secretary issue certain mining titles, licenses, approvals and order. Rights relating to exploration and mining can be owned entirely by foreign entities. The government amended previous legislation in December of 2020 to remove restrictions that prohibited more than forty-nine percent ownership by foreigners in businesses involved in the exploration and mining of platinum and diamonds.
A mining lease may be issued pursuant to Part VIII of the Mining Act after application to the Mining Affairs Board and must be renewed annually with an inspection and the payment of fees. A mining lease grants the holder an exclusive right of mining any ore or deposit of any mineral which occurs within the vertical limits of the area covered by the applicable mining lease. There are not necessarily time limits associated with a mining lease, but the holder must comply with the terms and conditions of the lease as well as the requirements to obtain annual inspection certificates. The Mining Act requires the government provide notification to a holder in case the holder fails to timely obtain an inspection certificate. Transferring a mining lease requires governmental permission. The Company’s rights to mine are derived from the How Mine Lease, the Mazowe Mine Lease and the Redwing Mine Lease, and each lease is current in its annual inspections and in the payment of fees.
Special mining leases are provided for in Part IX of the Mining Act and may only be issued upon the President of Zimbabwe’s approval, with the recommendation of the Minister of Mines and Mining Development. A holder of a registered mining location may apply for a special mining lease and must demonstrate the capacity to invest at least $100 million in the applicable mining location. Special mining leases can be issued for up to 25 years with 10-year renewal periods, depending on the life of the mine. Section 168 of the Mining Act provides that the same provisions relating to mining leases, including the rights and obligations thereof, apply in relation to special mining
53
leases. This includes the preservation, cancellation and restriction of transfers of mining leases. However, a holder of a special mining lease is subject to a 15% tax rate instead of the general rate of 25.75% and is also allowed to make direct exports of gold at spot prices.
Environmental Act regulations are designed to ensure that mining takes place in a manner that sustainably protects the environment and requires that mining projects. The Environmental Act requires the Environmental Management Agency to approve an environmental impact assessment report and issue a certificate before mining activities may commence at a project or mine. An environmental impact assessment report should include, among other things, details of how tailings and other waste products will be handled and how the miner will mitigate environmental damages. Other related environmental licenses are required depending on the nature of operations, including water disposal licenses and emissions license. Companies that do not comply with certain environmental regulations may be prosecuted under the Environmental Act and be subject to fines. In addition, a company may also be sued for damages by any affected person and be ordered to pay for environmental reparations.
Pursuant to Zimbabwe law, all gold from authorized mining activities in Zimbabwe must be sold to Fidelity, a company controlled by the Zimbabwean authorities.
In May 2023, Zimbabwe passed the Responsible Mining Initiative to combat illegal mining and removed the historical indigenization rule, which required 51% local investor ownership.
Tax laws relating to mining
The Income Tax Act (the “Tax Act”) sets out a comprehensive tax and customs regime that is applicable to mining activities. Under the Tax Act, taxation on most mining leases is at a flat rate of 25.75%. For holders of special mining leases, taxation is at a flat rate of 15%; however, holders may be liable to additional profit tax. The Tax Act further provides for the deduction of capital expenditures incurred exclusively for mining operations. Investors in mining companies are permitted to borrow locally for working capital purposes. Offshore borrowings require approval from the RBZ.
Effective January 1, 2024, amendments to Zimbabwe’s Capital Gains Tax Act (Chapter 23:01) went into effect and provide for a capital gains tax of up to 20% on direct and indirect transfers of mining title. The statute provides that the tax may apply to both domestic and foreign entities, even if the applicable offshore entity is not a tax resident of Zimbabwe and regardless of whether the transaction occurs offshore of Zimbabwe. The new capital gains tax also has a lookback period of ten years prior to January 1, 2024. Judicial interpretations of the capital gains tax are not available and the implications of such amendments and potential enforcement of such remain unclear. We are evaluating the amendments and considering the potential impact on the Company as a result of the Business Combination and the previous transaction by which Greenstone obtained its interest in BMC, the holding company of our mining assets. If the new capital gains tax were to apply to such transactions, it could have a material adverse effect on our business and financial condition.
Gold sales to Fidelity were zero rated for Value Added Tax purposes (“VAT”) until December 29, 2023 which meant that no VAT was payable on gold sales. On December 29, 2023, the Zimbabwe government introduced statutory instrument 248/2023 which removed the zero-rating provisions and VAT on sales of gold then became payable. However, in June 2024 the Zimbabwe government restored the zero rating of gold sales through statutory instrument 105/2024.
Mining entities are also required to pay royalties to the government of Zimbabwe depending on the type of mineral. Gold is generally subject to a 5% royalty payment if sold at a time when its price is above $1,200 per ounce and a 3% royalty payment if the price is below $1,200 per ounce. Starting in January 2026, a 10% royalty will apply if prices are above $5,000 per ounce. Royalties are calculated as a percentage of the gross fair market value of minerals produced and sold.
Foreign Exchange Controls
Exchange control approvals from the RBZ are required on the flow of funds in and out of Zimbabwe. The Company has obtained the necessary approvals from the RBZ to transfer foreign currency.
54
Investment Protection
Foreign investors are required to register their investments with the Zimbabwe Investment and Development Agency (“ZIDA”). Registration with ZIDA ensures repatriation of capital and dividends and protection of investments under any existing investment protection agreements (BIPPAs) between Zimbabwe and the foreign country. It also protects against direct and indirect expropriation without fair compensation. Investments made before the act came into force in 2020 can be registered with ZIDA. The Company has obtained ZIDA licenses for the How Mining Company, the Mazowe Mining Company, and the Redwing Mining Company.
Democratic Republic of the Congo (DRC)
General laws relating to mining
The mining industry in the DRC is primarily regulated by Law No. 007/2002 dated July 11, 2002 (the “2002 DRC Code”), as amended and supplemented by Law No. 18/001 dated 9 March 2018 (the “Reformed DRC Mining Code”) and Decree No. 038/2003 dated March 26, 2003, as amended and supplemented by Decree No. 18/024 dated June 8, 2018 (the “Reformed DRC Mining Regulations”).
Companies holding mining titles issued prior to the entry into force of the Reformed DRC Mining Code and Reformed DRC Mining Regulations have claims to a ten-year stability provision in accordance with prior mining legislation. Notwithstanding the adoption of the new regulatory regime, their rights with respect to such stability provision are reserved.
The Reformed DRC Mining Code grants the DRC Minister of Mines the authority to grant, refuse, suspend or terminate mineral rights, subject to conditions set out in the Reformed DRC Mining Code. Mineral rights may be granted in the form of exploration permits for an initial period of five years renewable once for a further five-year period or in the form of exploitation permits which are granted for an initial period of 25 years, renewable several times for 15-year periods until the end of the mine’s life. The holder of mining title is obliged to treat and transform the mineral substances exploited by the holder in the DRC. Prior to commencing exploration work, the holder of an exploration permit must submit for approval a mitigation and rehabilitation plan pursuant to which it must undertake to carry out certain mitigation measures of the impact of its activities on the environment, as well as rehabilitation measures. Exploitation permits are granted upon successful completion of exploration and satisfaction of certain requirements, including approval of a feasibility study, an environmental and social impact study and an environmental and social management plan. The holder of an exploitation permit is required to commence development and mine construction within three years of the grant of such permit. This period is one year for the holder of a research (exploration) permit. The holder of an exploitation permit pays for annual surface rights the sum in Congolese Francs equivalent to $5.00 U.S. dollars per hectare regardless of the validity period of title. Failure to do so may lead to forfeiture of the exploitation permit. To protect and enforce rights acquired under an exploration or exploitation permit, the Reformed DRC Mining Code provides, depending on the nature of the dispute or controversy, administrative, judicial and national or international arbitral recourses. Holders of mining rights who have lost their rights and whose titles are withdrawn can only obtain new mining rights or authorization to operate permanent quarries after a period of five years from the date of entry of the withdrawal in the register held by the Mining Cadastre.
Mining companies are required to grant a free-carried and non-contributory participation to the DRC government. The DRC government’s free participation was originally set at five percent, which was increased to ten percent in respect of exploitation permits issued after the entry into force of the Reformed DRC Mining Code. All mining companies are required to grant an additional five percent free-carried participation to the DRC government upon each renewal of their exploitation permit. Under the Reformed DRC Mining Code, a ten percent local contributory participation is also mandatory for exploitation permits issued after its entry into force.
In the event that it is recognized as necessary to carry out work of common interest for two neighboring mines, the applicable holders cannot object. The holder of mining rights is required, from the delivery of mining title and at the latest within six months before the start of exploitation, to develop and submit specifications defining social responsibility for local communities affected by mining activities and to obtain approval from the Provincial Government after advice from technical services. DRC law also provides for fines ranging from $10,000 U.S. dollars to $250,000 U.S. dollars, against anyone who engages, without authorization, in research or exploitation of mines.
55
Tax laws relating to mining
The Reformed DRC Mining Code sets out an exclusive and comprehensive tax and customs regime that is applicable to mining activities. Mining title holders are subject, amongst other things, to a corporate income tax of 30 percent, a windfall tax of 50 percent (subject to certain prerequisites) and are required to pay mining royalties to the DRC government. The royalty rate applicable to gold has been set at 3.5 percent. Mining title holders are also required to contribute a minimum of 0.3 percent of total turnover to community development. This grant is made available and managed by a legal entity comprising representatives of the holder and the surrounding local communities directly affected by the project. The standard rate of VAT is 16 percent and is applicable to all mining companies.
The Reformed DRC Mining Code also provides for a level of fiscal stability. A stability clause stipulates that existing tax, customs and exchange control provisions applicable to mining activities are guaranteed to remain unchanged for a period of five years from the enactment of the Reformed DRC Mining Code.
Foreign exchange control regime
The Reformed DRC Mining Code imposed new exchange control rules requiring that mining title holders repatriate onshore 60 percent of sale revenues received during the investment amortization period and 100 percent once the investment amortization is completed.
Legal Proceedings
In addition to the proceedings described below, we become involved, from time to time, in various claims, legal proceedings and complaints incidental to the ordinary course of business. For example, our operations are underpinned by numerous contractual agreements with third parties and non-compliance by the relevant third party to our contractual obligations may require us to enforce our rights under the relevant contracts and pursue legal action. The outcome of outstanding, pending or future proceedings cannot be predicted with certainty and may be determined adversely to us and as a result, could have a material adverse effect on our assets, liabilities, business, financial condition and results of operations.
• Mazowe Corporate Rescue Proceedings: On February 15, 2024, a court application was filed in the High Court of Zimbabwe to place the Mazowe Mining Company under supervision and commencement of Corporate Rescue Proceedings in terms of the Insolvency Act (Chapter 6:07) in 2018 (the “Mazowe Corporate Rescue Proceedings”). The application has been challenged by the Company, and although a hearing date set was set for March 11, 2025, such date was postponed and a new date has not been set. In the Company’s view, the application for the Mazowe Corporate Rescue Proceedings is without merit as it does not comply with applicable laws and rules. Soon after the Mazowe Mine and the Redwing Mine ceased operations, applications were filed in Zimbabwe to place the Redwing Mining Company and the Mazowe Mining Company in corporate rescue proceedings. The applications were initially granted. As a result, our management was separated from control of the mines until the application approvals were overturned by the Supreme Court of Zimbabwe in 2021, in the case of the Mazowe Mine, and 2022, in the case of the Redwing Mine. In 2023, employees of our Redwing Mine applied to have the Redwing Mining Company placed under corporate rescue proceedings but the case was dismissed by the High Court of Zimbabwe. See “Risk Factors — Risks Related to Our Business, Operations and Industry — Since operations at our Mazowe Mine and Redwing Mine were halted in 2018 and 2019, respectively, we have been subject to litigation regarding disputed debts and corporate rescue proceedings pursuant to Zimbabwean insolvency laws.”
• Employee Compromise Agreements: In connection with the Mazowe Mine and the Redwing Mine care and maintenance, certain employees of the Mazowe Mining Company and the Redwing Mining Company claimed they were not paid an aggregate of approximately $2.7 million wages owed to them. In response, the Mazowe Mining Company has made installment payments and will continue to make payments upon resumption of operations, and the Redwing Mining Company has entered into compromise agreements with some employees and is in continued discussions to enter into additional compromise agreements. See “Risk Factors — Risks Related to Laws and Regulations — We are subject to labor and employment laws and regulations, which could increase our costs and restrict our operations in the future.”
56
Competition
There is aggressive competition within the precious metals industry. We compete in efforts to finance, explore and develop projects with other gold producers and mineral miners. Our current mining operations are focused primarily on Zimbabwe, and we face competition from other operators local to Zimbabwe as well as international companies, such as Caledonia Mining Corporation Plc which is a publicly traded company with operations focused in Zimbabwe. In the future, we may compete with such companies to acquire additional properties. Assuming we successfully acquire and develop interests in the DRC, we would face competition primarily from international companies, such as Ivahoe Mines and Zijin Mining Group, who have a joint venture to own and operate the Kamoa-Kakula Copper Mine, one of the largest mines in the DRC, and CMOC Group, which operates the Tenke Fungurume Mine. Such competitors in Zimbabwe and the DRC could outbid us for potential projects or produce minerals at lower costs. In addition, we also encounter competition from these companies and other for the hiring of key personnel. See “Risk Factors — Risks Related to Our Business, Operations and Industry — The mining industry is highly competitive and there is no guarantee we will always be able to compete effectively.”
However, as significant volumes of gold and gold derivatives trade in the world markets independent of gold mine supply and all of the Company’s sales are required by law to be made to Fidelity at market spot prices, the Company does not consider that competition for gold sales, other than the impacts of changes in demand or supply may have on the spot price of gold on global markets, plays any role in its operations as a gold producer. Until we are able to acquire and develop mining interests in the DRC and begin commercially mining in the DRC, we do not currently face competition in the export or sale of any metals in the DRC.
Human Resources Capital
As of December 31, 2025, the Company had 1,500 full-time employees. In Zimbabwe, most of our employees working in our mining operations are represented by the Associated Mine Workers Union of Zimbabwe. Although we believe our employee relations to be strong, we have been subject to various employment related claims. For example, certain employees of the Mazowe Mining Company and the Redwing Mining Company claimed they were not paid wages owed to them beginning around when the Mazowe Mine and the Redwing Mine entered into care and maintenance programs in 2018 and 2019, respectively. In response, the Mazowe Mining Company has made installment payments and will continue to make payments upon resumption of operations, and the Redwing Mining Company has entered into compromise agreements with some employees and is in continued discussions to enter into additional comprise agreements. In addition, certain employees of the Mazowe Mining Company have from time to time alleged non-payment of salaries on the basis of their refusal to accept payment in Zimbabwe legal tender, demanding to be paid in U.S. dollars instead. The demands do not involve material amounts and we believe that the allegations have no merit. With respect to one such claim by employees that has been litigated, Zimbabwe courts have dismissed the claim.
For additional discussion on the relationship between management and labor unions, see “Risk Factors — Risks Related to Laws and Regulations — We are subject to labor and employment laws and regulations, which could increase our costs and restrict our operations in the future” and “Risk Factors — Risks Related to Our Business, Operations and Industry — Most of our employees are members of the Associated Mine Workers Union of Zimbabwe and any work stoppage or industrial action implemented by the union may affect our business, results of operations, and financial performance.”
MINERAL RESOURCE AND MINERAL RESERVE SUMMARY DISCLOSURE
On October 31, 2018, the SEC adopted Subpart 1300 (17 CFR 229.1300) of Regulation S-K (“Regulation S-K 1300”) along with the amendments to related rules and guidance in order to modernize the property disclosure requirements for mining registrants under the Securities Act and the Exchange Act. The disclosure in this section should be read in conjunction with the Technical Report Summaries of the How Mine, the Mazowe Mine, and the Redwing Mine, filed herewith as Exhibits 15.2, 15.3, and 15.4, respectively. The Technical Report Summaries of the Mazowe Mine and the Redwing Mine are effective as of December 31, 2023. The Technical Report Summary of the How Mine is effective as of December 31, 2025.
Mineral Resources and Mineral Reserves are estimates that contain inherent risk and depend upon geologic interpretation and statistical inferences drawn from drilling and sampling analysis, which may prove to be unreliable. For additional information on the risks and uncertainties associated with the Company’s mining properties, see
57
“Risk Factors — Risks Related to Our Business, Operations and Industry — Our Mineral Resource and Mineral Reserve estimates may be materially different from mineral quantities we may ultimately recover, our life-of-mine estimates may prove inaccurate, and changes in operating and capital costs may render mineral resources uneconomic to mine” and “Risk Factors — Risks Related to Our Business, Operations and Industry — Our ability to replenish Mineral Reserves is subject to uncertainty and risks inherent in exploration, technical and economic pre-feasibility and feasibility studies and other project evaluation activities as well as competition within the industry for exploration, development, and operational projects which meet our investment criteria.”
The Company’s operations include three mines within Zimbabwe as assets owned by three indirect subsidiaries: the How Mining Company owns the How Mine; the Mazowe Mining Company owns the Mazowe Mine; and the Redwing Mining Company owns the Redwing Mine. The principal activities of each of the subsidiaries include the exploration, development, and operation of precious metals mineral assets within each of the mines.
Combined, these account for measured and indicated gold Mineral Resources (exclusive of Mineral Reserves) of 2.53Moz, inferred gold Mineral Resources (exclusive of Mineral Reserves) of 4.42Moz, and Mineral Reserves of 103koz.
Locations of Properties
Maps showing the location of individual properties as well as infrastructure and licenses are shown in “Mineral Resource and Mineral Reserve Individual Property Disclosure” below.
Overview of Mining Properties and Operations
The following table sets out the aggregate production of the Company’s mining operations for the years ended December 31, 2025, 2024 and 2023. The table excludes production during those years from Mazowe Mine and Redwing Mine related to artisanal mining or shallow surface workings within 30 meters of the surface, as such production is not derived from the stated Mineral Resource and is regarded as non-material by the Company management. See “Risk Factors — Risks Related to Our Business, Operations and Industry — Theft of the mineral concentrate, final metals, and production inputs may occur. These activities are difficult to control, can disrupt our business and can expose us to liability” for additional information.
|
Fiscal year ended December 31, |
||||||
|
Gold production |
2025 |
2024 |
2023 |
|||
|
Tonnes milled (kt) |
476 |
473 |
450 |
|||
|
Ounces produced (koz) |
25 |
37 |
34 |
|||
See “— Mineral Resource and Mineral Reserve Individual Property Disclosure” for more information on the location of the properties; the type and amount of ownership interests; the identity of the operators; titles, mineral rights, leases or options and acreage involved; the stages of the properties (exploration, development or production); key permit conditions; mine types and mineralization styles; and processing plants and other available facilities.
Methodology
Mineral Resources
A Mineral Resource is a concentration or occurrence of solid material of economic interest in or on the Earth’s crust in such form, grade or quality and quantity that there are reasonable prospects for eventual economic extraction. The location, quantity, grade, continuity and other geological characteristics of a Mineral Resource are known, estimated, or interpreted from specific geological evidence and knowledge, including sampling.
An Inferred Mineral Resource is that part of a Mineral Resource for which quantity and grade or quality are estimated based on limited geological evidence and sampling. Geological evidence is sufficient to imply but not verify geological and grade or quality continuity. An Inferred Resource has a lower level of confidence than that applying to an Indicated Mineral Resource and must not be converted to a Mineral Reserve. It is reasonably expected that the majority of an Inferred Mineral Resource could be upgraded to an Indicated Mineral Resource with continued exploration.
58
An Indicated Mineral Resource is that part of a Mineral Resource for which quantity, grade or quality, densities, shape, and physical characteristics are estimated with sufficient confidence to allow the application of modifying factors in sufficient detail to support mine planning and evaluation of the economic viability of the deposit. Geological evidence is derived from adequately detailed and reliable exploration, sampling, and testing and is sufficient to assume geological and grade or quality continuity between points of observation.
A Measured Mineral Resource is that part of a Mineral Resource for which quantity, grade or quality, densities, shape, and physical characteristics are estimated with confidence sufficient to allow the application of modifying factors to support detailed mine planning and final evaluation of the economic viability of the deposit. Geological evidence is derived from detailed and reliable exploration, sampling, and testing and is sufficient to confirm geological and grade or quality continuity between points of observation. A Measured Mineral Resource has a higher level of confidence than that applying to either an Indicated or an Inferred Mineral Resource. It may be converted to either a Proven Mineral Reserve or a Probable Mineral Reserve.
Mineral Resource Estimation
How Mine
The Mineral Resources estimate for the How Mine has been defined, classified and reported according to the guiding principles and minimum requirements as set forth in Regulation S-K 1300. For the purpose of demonstrating sufficient capacity to exploit the resource and define Mineral Resources at the How Mine as required under Regulation S-K 1300, the QP determined an appropriate cut-off grade which has been applied to the quantified mineralized body according to a process incorporating a long-term view of future economic modifying factors. In applying this process, the Company used a gold price of $3,600 (reflecting a 10% increase over the 2-year trailing average gold price to derive a cut-off grade) and an overall metallurgical recovery of 89% to determine the quantities of material offering reasonable prospects of eventual economic extraction by an underground mining method. Mineral Resources are estimated based on geoscientific knowledge and data, including borehole and sampling data, with input from the Company’s managers, geologists and geostatistical staff. Sampling is subject to quality assurance and quality control to help ensure data quality and accuracy.
Mazowe Mine and Redwing Mine
To meet the requirements of the Southern African Code for the Reporting of Exploration Results, Mineral Resources and Mineral Reserves, 2016 edition (“SAMREC (2016)”) that this solid material reported as a Mineral Resource should have “reasonable and realistic prospects for eventual economic extraction,” the Company determined an appropriate cut-off grade which has been applied to the quantified mineralized body according to a process incorporating a long-term view on future economic modifying factors. In applying this process, the Company used a gold price of $2,340 per ounce (reflecting a 30% increase over the three-year trailing average of $1,800 per ounce from December 31, 2023) to derive a cut-off grade to determine the Mineral Resources at the Mazowe Mine and the Redwing Mine. The QP deemed the use of either of these price assumptions as good practice in the calculation of Mineral Resource cut-off grades at the time such calculations were made.
The estimation of Mineral Resources is based on geoscientific knowledge and borehole and sampling data, with input from the Company’s managers, geologists, and geostatistical staff. All sampling done is subject to quality assurance and quality control, as prescribed by SAMREC (2016), to ensure data quality and accuracy. Each mine’s Mineral Resource is categorized — based on similarities in geology, facies, grade, and structure, the orebody is divided into geozones. It is then blocked-out and ascribed an estimated value. A computerized geostatistical estimation process is used at all our mines.
Conversion of Mineral Resources to Mineral Reserves
To define that portion of a Measured and Indicated Mineral Resource that can be converted to a Proven and Probable Mineral Reserve, the Company applies the concept of a cut-off grade. At its mines, this is done by defining the optimal cut-off as the lowest grade at which an orebody can be mined such that the total profits, under a specified set of mining parameters, are maximized.
59
Mineral Reserves represent that portion of the Measured and Indicated Mineral Resources above the cut-off grade in the LOM plan and are estimated after consideration of the factors affecting extraction, including mining, metallurgical, economic, marketing, legal, environmental, social, and governmental factors. At the How Mine, the reported Mineral Reserves are accessible from existing infrastructure and/or infrastructure that is in the process of being developed.
A range of disciplines, including geology, survey, planning, mining engineering, rock engineering, metallurgy, financial management, human resources management, and environmental management, are involved at each mine in the LOM planning process and the conversion of Mineral Resources into Mineral Reserves.
The modifying factors that are used to convert Mineral Resources to Mineral Reserves are stated for the How Mine.
Mineral Reserve Estimation
A Mineral Reserve is the economically mineable part of a Measured and/or Indicated Mineral Resource. It includes diluting materials and allowances for losses, which may occur when the material is mined or extracted and is defined by studies at prefeasibility or feasibility level as appropriate that include application of modifying factors. Such studies demonstrate that, at the time of reporting, extraction could reasonably be justified. The reference point at which Mineral Reserves are defined, usually the point where the ore is delivered to the processing plant, must be stated. It is important that in all situations where the reference point is different, such as for a saleable product, a clarifying statement is included to ensure that the reader is fully informed as to what is being reported.
A Probable Mineral Reserve is the economically mineable part of an Indicated, and in some circumstances, a Measured Mineral Resource. The confidence in the modifying factors applying to a Probable Mineral Reserve is lower than that applying to a Proven Mineral Reserve.
A Proven Mineral Reserve is the economically mineable part of a Measured Mineral Resource. A Proven Mineral Reserve implies a high degree of confidence in the modifying factors.
A prefeasibility study is a comprehensive study of a range of options for the technical and economic viability of a mineral project that has advanced to a stage where a preferred mining method, in the case of underground mining, or the pit configuration, in the case of an open-pit, is established and an effective method of mineral processing is determined. It includes a financial analysis based on reasonable assumptions on the modifying factors and the evaluation of any other relevant factors which are sufficient for a competent person, acting reasonably, to determine if all or part of the Mineral Resource may be converted to a Mineral Reserve at the time of reporting. A prefeasibility study is at a lower confidence level than a feasibility study.
A feasibility study is a comprehensive technical and economic study of the selected development option for a mineral project that includes appropriately detailed assessments of applicable modifying factors together with any other relevant operational factors and detailed financial analysis that are necessary to demonstrate at the time of reporting that extraction is reasonably justified (economically mineable). The results of the study may reasonably serve as the basis for a final decision by a proponent or financial institution to proceed with, or finance, the development of the project. The confidence level of the study will be higher than that of a prefeasibility study.
For the reporting of Mineral Reserves, assumed gold prices of $3,272 per ounce (based on the average gold price from 2024 and 2025 and a forecast of 2026 gold prices), total production costs of $79.18 per tonne (inclusive of sustaining and indirect costs), total variable costs of $36.86 per tonne (inclusive of sustaining costs), and total fixed costs of $42.32 per tonne (inclusive of indirect costs) were applied. The applied costs were supplied by the Company and reviewed by WSP. An exchange rate of 25.5 ZiG per U.S. dollar was used. See Section 12 of the Technical Report Summary for the How Mine, included as Exhibit 15.2 to this Report, for more information.
60
Mineral Resources (exclusive of Mineral Reserves)
On a consolidated basis, combining the estimate as of December 31, 2025 for the How Mine and the estimates as of December 31, 2023 for the Mazowe Mine and Redwing Mine, the Company had aggregate attributable Measured and Indicated Resources (exclusive of Mineral Reserves) of approximately 2.53Moz of gold. Mineral Resources are reported on an in-situ basis, assuming a gold metallurgical recovery of 89.0%, 88.0%, and 90.0% with respect to each of the How Mine, Mazowe Mine, and Redwing Mine, respectively.
|
Tonnes |
Au Grade |
Au Metal |
||||
|
How Mine |
||||||
|
Measured Resources |
13.7 |
1.32 |
583 |
|||
|
Indicated Resources |
10.2 |
1.41 |
463 |
|||
|
Total Measured and Indicated |
23.9 |
1.36 |
1,046 |
|||
|
Inferred Resources |
31.0 |
2.18 |
2,176 |
|||
|
Inferred Resources (Sands (Tailings)) |
12.0 |
0.59 |
220 |
|||
|
Mazowe Mine |
||||||
|
Measured Resources |
0.26 |
9.01 |
75 |
|||
|
Indicated Resources |
0.91 |
7.42 |
217 |
|||
|
Total Measured and Indicated |
1.17 |
7.77 |
291 |
|||
|
Inferred Resources |
3.29 |
8.65 |
915 |
|||
|
Redwing Mine |
||||||
|
Measured Resources |
1.45 |
2.92 |
136 |
|||
|
Indicated Resources |
8.20 |
3.99 |
1,052 |
|||
|
Total Measured and Indicated |
9.65 |
3.83 |
1,188 |
|||
|
Inferred Resources |
15.83 |
2.61 |
1,328 |
Mineral Reserves
As at December 31, 2025, the Company had aggregate attributable Proven and Probable Mineral Reserves of approximately 103koz of gold. Mineral Reserves are reported on a plant feed basis, inclusive of dilution and ore loss modifying factors, assuming a gold metallurgical recovery of 89.0%.
|
Tonnes |
Au Grade |
Au Metal |
||||
|
How Mine |
||||||
|
Underground Proven Reserves |
1.08 |
1.40 |
48 |
|||
|
Underground Probable Reserves |
0.52 |
1.70 |
28 |
|||
|
Underground Total |
1.60 |
1.50 |
77 |
|||
|
Surface Probable Reserves |
0.89 |
0.89 |
26 |
|||
|
Total |
2.49 |
1.29 |
103 |
MINERAL RESOURCE AND MINERAL RESERVE INDIVIDUAL PROPERTY DISCLOSURE
How Mine
Property Description
The How Mine is located in the Matabeleland South Province, Zimbabwe, approximately 30 kilometers (km) southeast of the city of Bulawayo (latitude 20°18’S and longitude 28°46’E), in the Bulawayo Mining District of Zimbabwe. The How Mine is classified as a production stage property.
The How Mine is situated within the Mining Lease (“ML”) 28 tenement (“ML 28”), which has a surface area of 2,408 hectares (“ha”). The How Mining Company, which is a wholly owned subsidiary of Bulawayo Mining Company (UK) Limited (“BMC UK”), which is a wholly owned subsidiary of BMC, currently holds ML 28.
61
The following graphic illustrates the location of the How Mine and its proximity to major infrastructure.
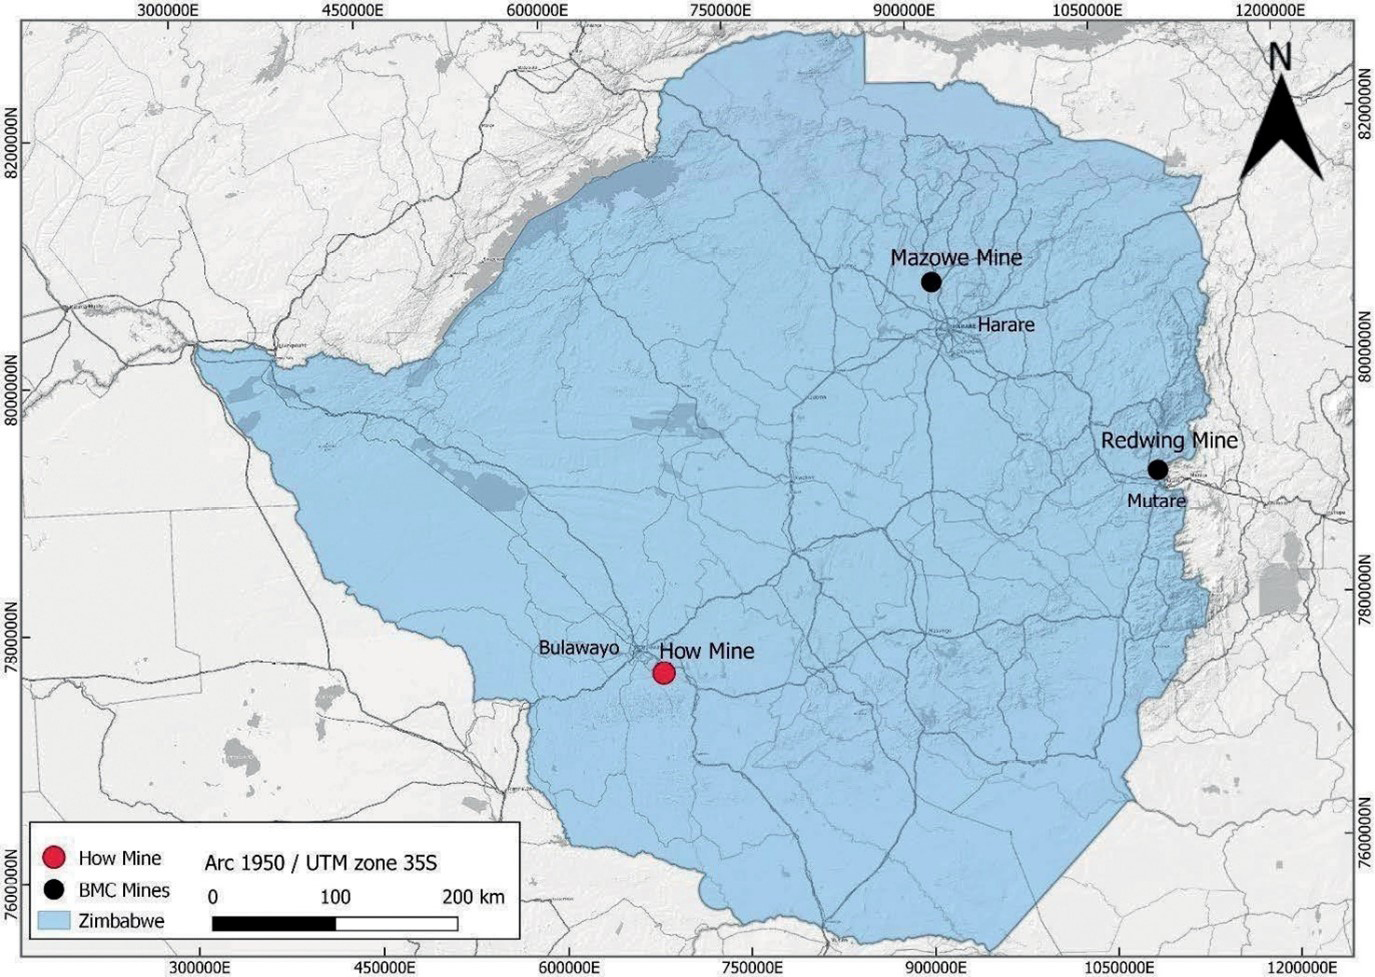
There are no known significant encumbrances to the How Mine that would impact the current Mineral Resources or Mineral Reserves.
Operational Infrastructure
The How Mine is serviced by its own dedicated processing facilities and accompanying infrastructure.
The How Mine is accessible via a sealed road from Bulawayo, which is in fair condition. The principal raw materials used in the mining operations are fuel, electricity, and water. The regional infrastructure includes access to a national power supply grid and water supply by way of dams and water bores. The mine has completed upgrading the on-site fuel pump station to a holding capacity of 35,000 liters.
At the How Mine, we have installed a series of shafts, with hoists, through which personnel and material may access the mine from the surface. The How Mine is served by two vertical shafts from surface (the North and the Main shafts) and one internal shaft. The North Shaft is devoted to hoisting ore from underground and hoists ore only to a depth of 925 meters. The Main Shaft is used for transporting personnel and material. An internal shaft extends to the 34 Level and currently supports operations to the 32 Level. Production is derived from open stoping and development. Ore hoisted from the North Shaft is processed at the mine’s carbon-in-plant (“CIP”) plant. Electricity is supplied from the national grid through Springs and Criterion lines, operated by Zimbabwe Electricity Supply Authority (“ZESA”).
Currently, the How Mine has completed a shaft deepening to the 34 Level. Further shaft deepening to the 36 Level is planned and possibly an extension to the 38 Level. We have also installed an HP300 cone crusher, making the crushing plant a two-stage crushing circuit, with the intention to increase capacity while being energy efficient. A surface conveyor from shaft bin to plant was also installed to remove locomotive conveyance of ore from shaft bin to plan.
62
The existing process facility at the How Mine has a record of successful operation. Plant and equipment has been in use for several years but is in good physical condition. A continuous capital replacement program is in place through annual sustaining capital expenditure budgets to replace old equipment. We also have in place a comprehensive maintenance program, supported by an inventory of critical spare equipment to facilitate uninterrupted production. The net book value of property, plants, and equipment at How Mine at December 31, 2025 was approximately $41.7 million.
Geology
The How Mine is located in the Umzingwane Formation of the Bulawayo Greenstone Belt. The lithological units characteristic of the Umzingwane Formation include clastic metasediments, fine-grained tuffaceous rocks, banded shales and siltstones, ferruginous cherts or Banded Iron Formation (“BIF”) and rhyodacites and andesitic lavas. This assemblage has been subjected to metamorphism of lower greenschist facies.
The surface footprint of the mineral rights owned by the Company at the How Mine covers an area of 2,408ha. Isolated cases of illegal gold mining activities have been reported along some streams and historical workings located within the ML. The majority of artisanal mining activity is concentrated along the Mzingwane River, on the southern margins of the ML area.
History
The How Mine draws on over 60 years of exploration field activities and previous studies. The How Mine claims were first pegged as a greenfields discovery in July 1941. Since 1970, the mine has operated continuously and is one of the largest gold producers in the Matabeleland region.
Mineral Tenure
Access to the mine site and to the ore, as well as mining exploration and exploitation works, are authorized by the applicable mining legislation and How Mining Company’s title and mining rights. Other required permits and authorizations (e.g., environmental, building, etc.) are applied for by How Mining Company in accordance with the applicable legislation.
The How Mining Company, a wholly owned subsidiary of BMC UK, which is a wholly owned subsidiary of BMC, holds ML 28. The area covered by ML 28 has a surface area of 2,408 ha. ML 28 is renewed annually, and the current certificate is valid until August 17, 2026.
A summary of the status of environmental permits and licenses issued as at December 31, 2025, related to the How Mine is presented in the table below.
|
No |
Reference No. |
Permit/License |
Issued by |
Date Granted |
Validity |
|||||
|
1 |
L10000163169 |
Solid Waste Disposal – Slimes Dam 5 |
Environmental Management Agency |
01/28/2025 |
12/31/2025 |
|||||
|
2 |
L10000068235 |
Effluent Disposal Sewage Treatment plant |
Environmental Management Agency |
01/28/2025 |
12/31/2025 |
|||||
|
3 |
L10000068237 |
Hazardous waste generation licence |
Environmental Management Agency |
01/28/2025 |
01/28/2026 |
|||||
|
4 |
L10000068236 |
Solid waste disposal licence – Decommissioned Tailings Dump |
Environmental Management Agency |
01/28/2025 |
12/31/2025 |
|||||
|
5 |
L10000090798 |
Air Emissions licence – Clinic Incinerator |
Environmental Management Agency |
02/25/2025 |
12/31/2025 |
|||||
|
6 |
L10000090797 |
Air Emissions licence – Assay Lab licence |
Environmental Management Agency |
02/25/2025 |
12/31/2025 |
|||||
|
7 |
L10000068243 |
Air Emissions licence – Standby Generator licence |
Environmental Management Agency |
02/25/2025 |
12/31/2025 |
|||||
|
8 |
L10000166073 |
Hazardous Substances Import licence |
Environmental Management Agency |
01/01/2025 |
01/01/2026 |
|||||
|
9 |
L10000094955 |
Hazardous substances storage and use license |
Environmental Management Agency |
05/29/2025 |
05/29/2026 |
63
|
No |
Reference No. |
Permit/License |
Issued by |
Date Granted |
Validity |
|||||
|
10 |
L10000094956 |
Hazardous substances transportation ABT 2008 |
Environmental Management Agency |
05/29/2025 |
05/29/2026 |
|||||
|
11 |
L10000094957 |
Hazardous substances transportation AGZ 3316 |
Environmental Management Agency |
05/29/2025 |
05/29/2026 |
|||||
|
12 |
L10000094539 |
Bulawayo south claims exploration ESIA |
Environmental Management Agency |
05/30/2025 |
05/30/2026 |
|||||
|
13 |
L10000094538 |
How mine gold mining & processing ESIA |
Environmental Management Agency |
06/26/2025 |
06/26/2026 |
|||||
|
14 |
L10000122946 |
Lone trail ESIA |
Environmental Management Agency |
09/14/2025 |
09/14/2027 |
|||||
|
15 |
L10000069789 |
Happy Valley Exploration & Mining Project ESIA |
Environmental Management Agency |
03/03/2025 |
03/03/2027 |
|||||
|
16 |
L10000094836 |
How Mine lease exploration project ESIA |
Environmental Management Agency |
05/09/2025 |
05/09/2026 |
|||||
|
17 |
24847SWP |
Water abstraction permit |
ZINWA |
07/15/2024 |
07/14/2029 |
Mining Method
The How Mine is an underground rail mine in active operation using sub-level open stoping underground techniques.
Shafts are used to access the relatively steeply dipping orebody. Sublevels are developed on approximately 10- to 12-meter intervals and mined on retreat by adopting underhand/long-hole open stoping methods using sub-level breaking into a common slot. Broken ore is collected in draw-points or boxes. Cone levels (extraction draw cones) are developed to 8 to 10 meters above haulage drives, and sub-levels are developed above the cone drives at approximately 10- to 12-meter intervals. Drilling and blasting are conducted by retreating from a central slot to rib pillars or other demarcated points by downhole (underhand) and uphole (overhand) drilling.
Mineral Processing
The existing process facility at the How Mine has a record of successful operation.
Metallurgical operations at the How Mine are carried out in a run-of-mine to handle a throughput of 40.5kt per month. Processing of ore retrieved from the How Mine includes crushing, grinding, thickening, soaking, draining, neutralizing, eluting and treatment with acids to extract gold.
Qualified Persons
Information in the How Mine Technical Report Summary has been prepared under the supervision of WSP Australia Pty Limited (“WSP”). WSP is not an insider, associate, or affiliate of the Company or any of its subsidiaries. The results of the technical review by the QP are not dependent on any prior agreements concerning the conclusions to be reached, nor are there any undisclosed understandings concerning any future business dealings. The WSP geologist and mining engineer visited the site between February 24, 2026 and February 25, 2026.
Exploration
Exploration at the How Mine is based on detailed geological mapping that established the following sequence from southwest to northeast: talc-chlorite schist, laminated black shale, silicate facies BIF, tuffaceous units, and siltstone. The occurrence of felsic porphyry intrusions, and mafic dykes in historical quarries is also expressed in underground exposures. This shows that the mineralization channel locally transgresses lithological boundaries and is therefore not strictly strata-bound.
Channel sampling, diamond drilling, trench and sludge drilling samples were used for the purposes of geological modelling and Mineral Resource estimation.
64
Diamond drill core is logged and sampled at a nominal one-meter interval, depending on geology. Samples are taken to at least five meters beyond the geologically defined mineralization boundary in all drill holes. Core recovery averages over 98%.
Sludge drilling was formerly used for resource evaluation purposes. Sludge drill holes were sampled on one-meter intervals. Historical sludge drilling results remain in the resource database for mineralization areas on or above the 20 Level. Sludge drilling has been phased out entirely due to questionable reliability. All evaluation below the 20 Level is based on diamond core, and channel sampling only. Sludge samples have been included in the estimate due to them being the only available data in certain parts of the mine. Where there is no diamond drilling present and the estimate relies on the presence of sludge drilling, the Mineral Resource estimate has been classified as Inferred.
The QP considers the data collected including method of collection and storage to be appropriate for the preparation of geological models and Mineral Resources estimates, and that the data type and quality have been considered during resource classification.
Exploration
From 2012 to 2023, exploration holes were drilled, of which all hole collars were machine surveyed and downhole surveys were completed for determination of dip and azimuth deviations. Until the end of 2024, our exploration plan for the How Mine included deep drilling from the 30 Level drilling platforms to a depth at the 40 Level, targeting certain orebodies and potential resources in the footwall. The 2025 diamond drilling campaign at the How Mine formed the primary basis for updating the Mineral Resources in the deeper areas of the deposit. A total of 147 drill holes were completed and distributed across the 13, 17, 18, 30 and 32 Levels. From 2026 through to 2029, we intend to undertake further exploration drilling, at an average cost of approximately $2.65 million per year and a cumulative total of approximately $10.6 million over the four years.
Mineral Resource Estimate
The QPs is satisfied that there has been sufficient orebody knowledge work completed to support reasonable prospects for economic extraction at the How Mine from a Mineral Resources perspective.
The Mineral Resources estimate, as of December 31, 2025, has been defined, classified, and reported by the How Mining Company according to the guiding principles and minimum requirements as set forth in the Regulation S-K 1300.
The total estimated measured and indicated Mineral Resource (exclusive of Mineral Reserves) is approximately 23.9Mt at 1.36g/t Au, for approximately 1,046koz of gold, and the estimated inferred Mineral Resource (exclusive of Mineral Reserves) is approximately 43Moz at 1.74g/t Au, for approximately 2,396koz of gold. Classification of the Mineral Resource has been considered based on the definitions in the Regulation S-K 1300 for Measured Mineral Resource, Indicated Mineral Resource and Inferred Mineral Resource. The QP applied resource classification based on distance to diamond drill holes, confidence in geological interpretation and data quality. The final grade estimates for each estimation domain have been validated statistically against the input drillhole composites.
The COGs were calculated from an assumed Au price of US$3,600 per oz (reflecting a 10% increase over the two-year trailing average and the forecast 2026 gold price).
|
Parameter |
Mineral |
Tailings |
||||
|
COG (g/t) |
|
0.55 |
|
0.64 |
||
|
Gold Price |
$ |
3,600/oz |
$ |
3,600/oz |
||
Evaluation data collection includes diamond drilling, channel sampling, and sludge drilling.
65
The following table presents the underground Mineral Resources (exclusive of Mineral Reserves) reported as at December 31, 2025 and 2024. Mineral Resources are reported on an in-situ basis, assuming a gold metallurgical recovery of 89%. There has been a large increase in tonnes and ounces in Measured, Indicated and Inferred resources due to an updated mineralization domaining cut-off and a re-interpretation of the mineralization to include the entire deposit, and there has been a decrease in the reporting grade for the Measured and Indicated resources.
|
Fiscal Year Ended December 31, |
||||||||||||
|
2025 |
2024 |
|||||||||||
|
Mineral Resource Category |
Tonnes |
Grade |
Au Metal |
Tonnes |
Grade |
Au Metal |
||||||
|
Measured |
13.7 |
1.32 |
583 |
0.26 |
1.8 |
15 |
||||||
|
Indicated |
10.2 |
1.41 |
463 |
1.58 |
1.7 |
86 |
||||||
|
Total Measured and Indicated |
23.9 |
1.36 |
1,046 |
1.84 |
1.7 |
101 |
||||||
|
Inferred |
43.0 |
1.74 |
2,396 |
13.96 |
0.96 |
43 |
||||||
____________
Notes: Mt = million tonnes; Au Grade g/t = gold grams per tonne; koz = thousand ounces.
It should be noted that the underground and surface Mineral Resources estimate for the How Mine is reported exclusive of Mineral Reserves. The Mineral Resources presented in this Section are not Mineral Reserves, and do not reflect demonstrated economic viability. The reported Inferred Mineral Resources are considered too speculative geologically to have the economic considerations applied to them that would enable them to be categorized as Mineral Reserves. There is no certainty that all or any part of this Mineral Resource will be converted into Mineral Reserve. All figures are rounded to reflect the relative accuracy of the estimates and totals may not add correctly.
Mineral Reserve Estimate
The Mineral Reserves have been defined, classified, and reported by the How Mining Company according to the guiding principles and minimum requires set forth in the Regulation S-K 1300.
Underground Mineral Reserves have been defined using Vulcan™ software for block modelling. Both underground mining reserves and surface sands stockpile reserves have been estimated.
Surface sands stockpiles (old tailings) are converted from Measured Resources and downgraded to Probable Reserve category material in the Mineral Reserve due to a higher degree of uncertainty, relatively lower confidence in the grade estimate and process recovery. Processing of surface sands stockpiles are not currently considered in the LOM plan since it would displace higher grade feed from underground sources.
The QP is satisfied that there has been sufficient standard of evaluation to support estimation of a Mineral Reserve that has been demonstrated to be technically and economically viable.
For the reporting of Mineral Reserves, assumed gold prices of $3,272 per ounce, total production costs of $79.18 per tonne (inclusive of sustaining and indirect costs), total variable costs of $36.86 per tonne (inclusive of sustaining costs), and total fixed costs of $42.32 per tonne (inclusive of direct costs) were applied. The applied costs were supplied by the Company and reviewed by WSP. See Section 12 of the applicable technical report summary for the How Mine, included as Exhibit 15.2 to this Report, for more information
The Pay-Limit Grade was calculated using Au price $3,272 per oz which was derived from a two trailing average Au price and the forecast 2026 gold price.
|
Parameter |
Mineral |
||
|
Pay Limit (g/t) |
|
0.75 |
|
|
Gold Price |
$ |
3,272/oz |
|
The following table presents the How Mine Mineral Reserves estimate as at December 31, 2025 and 2024. Mineral Reserves are reported on a plant feed basis, inclusive of dilution and ore loss modifying factors, assuming a gold metallurgical recovery of 89.0%. For underground reserves, there has been a 30% increase in Proved Reserves
66
and a 10% decrease in Probable Reserves, leading to a 10% increase in total gold ounces. Proved Reserves tonnage increased by 12%, while grade reduced by 0.92 g/t, leading to a net increase of 30% in contained gold. The Proved Reserves change is driven by the updated block model and new stopes mainly below the 30 Level. There was no change to the Sands reserves.
|
Fiscal Year Ended December 31, |
||||||||||||
|
2025 |
2024 |
|||||||||||
|
Mineral Reserves |
Tonnes |
Grade |
Au Metal |
Tonnes |
Grade |
Au Metal |
||||||
|
Proven Mineral Reserves |
1.08 |
1.40 |
48 |
0.5 |
2.32 |
37 |
||||||
|
Probable Mineral Reserves (Underground) |
0.52 |
1.70 |
28 |
0.6 |
1.63 |
31 |
||||||
|
Total Mineral Reserves |
1.6 |
1.50 |
77 |
1.1 |
1.91 |
68 |
||||||
|
Probable Mineral Reserves (Sands) |
0.89 |
0.89 |
26 |
0.8 |
0.89 |
26 |
||||||
____________
Notes: Mt = million tonnes; Au Grade g/t = gold grams per tonne; koz = thousand ounces.
Quality Assurance Quality Control
Quality Assurance and Quality Control (“QAQC”) procedures used at the How Mine are as follows.
The on-site assay laboratory processes all samples collected from resource delineation diamond drilling, channel and face samples, draw-point grab samples, and processing plan samples. Blanks and Certified Reference Material (“CRM”) samples are introduced at a rate of 2 samples for every 16 samples assayed. Repeat samples are also sent to the on-site assay laboratory on a regular basis. An assay repeats register is kept for monitoring laboratory performance. Exploration drill core samples are sent to an external accredited laboratory for assaying. Records of all samples collected and sent for assay are systematically kept in various ways that have an in-built back-up system. All samples collected underground have their details captured in a field logbook, from which they are transferred to daily return sheets and on-site assay laboratory submission/report sheets. These records are filed separately. For drill core assay results, records are captured in logbooks, log sheets, and computer and assay report sheets.
For channel samples, repeats are used, and a CRM sample is inserted into each sample batch. All CRM samples are tested for compliance to set tolerance ranges, typically ± 2 Standard Deviations (“SD”) from the designated mean value. No blanks are included in the channel sampling batches. Rejected assay batches are subjected to re-assay. Data is subjected to routine analyses by way of scatter and regression plots.
For core sampling, for every 14 samples of exploration diamond drill core, at least one CRM sample is inserted into the sampling stream. In some cases, a second CRM is inserted every 14 samples as well or alternatively, a duplicate is included. All CRM samples are tested for compliance to set tolerance ranges, typically ± 2 SD from the designated mean value. Rejected assay batches are subjected to re-assay in their entirety. Data is subjected to routine analyses by way of scatter and regression plots.
The QP has validated How Mine metallurgical processing by way of documentation provided, which includes metallurgical reports and performance, technical reports, and business improvement projects. In the opinion of the QP, the processing and recovery methods data used to inform the Mineral Reserves estimate are adequate for the purposes for which it is used.
The QP is satisfied that the stated Mineral Resources classification reflects the appropriate level of confidence and considers all factors relevant to the deposit. The application of resource categories appropriately considers the relevant factors used in the classification process. Some examples of specific factors that can influence the risk and uncertainty of the Mineral Resources estimates that are considered in the resource classification include: (1) interpretation of the mineralization boundary; (2) drill hole spacing and adequacy in defining geology, mineralization, structure, and grade; (3) quality of samples, assays, and geological information; and (4) the Mineral Resources estimates have been estimated to two decimal places for gold grade, and to the
67
nearest tonne for tonnage, but have been reported to one decimal place for gold grade, to the nearest thousand ounce for metal content, and to the nearest thousand tonne for tonnage when reported in summary tables in the report.
Mazowe Mine
Property Description
The Mazowe Mine is located in Mashonaland Central, Zimbabwe, approximately 50 kilometers (km) northwest of the City of Harare (latitude 17°28’S and longitude 30°55’E). The Mazowe Mining Company, a wholly owned subsidiary of Gold Fields of Mazowe (UK) Limited (“GFM”), which is a wholly owned subsidiary of BMC, possesses total ground holdings under Mining Lease 35 (“ML 35”) totaling 1,955.5 ha. The Mazowe Mine is classified as an exploration stage property and is currently in care and maintenance.
The following graphic illustrates the location of the Mazowe Mine and its proximity to major infrastructure.

There are no known significant encumbrances to the Mazowe Mine that would impact the current Mineral Resources, risks to access the Mazowe Mine, or title or right to perform work.
Plans to Recommence Operations
The Mazowe Mine is currently in care and maintenance. We intend to prepare for recommencement of operations at Mazowe Mine, with such preparatory work first consisting of completing a scoping studies, which is already underway and anticipated to be completed within 9 to 15 months at a cost of approximately $2.5 million. Concurrently, surface exploration is anticipated to commence in 2026. Thereafter, we intend to dewater the flooded working areas of the mine, which will take approximately six to nine months, at a cost of approximately $1.5 million. We then intend to backfill illegally mined holes, upgrade four of the main shafts, construct recycling tanks and upgrade other water-related items, purchase new compressors and create supporting infrastructure, and install a
68
new processing plant. We have commenced a feasibility study at the Mazowe Mine and expect it to be completed within 12 to 18 months. Assuming we obtain the required capital resources, we expect that recommencement of mine operations could occur within a three-year period following receipt of adequate financing, of which there can be no certainty. However, if the current application to place the Mazowe Mine under corporate rescue is accepted, the restart process will be delayed until the corporate rescue process is resolved. For more information on such corporate rescue proceedings, see “Risk Factors — Risks Related to Our Business, Operations and Industry — Since operations at our Mazowe Mine and Redwing Mine were halted in 2018 and 2019, respectively, we have been subject to litigation regarding disputed debts and corporate rescue proceedings pursuant to Zimbabwean insolvency laws.”
The Company is undertaking preparations for dewatering at the Mazowe Mine. These activities are expected to be completed by late 2027, based on current estimates. However, we may not be able to achieve such results on the anticipated timeline or at all. Our ability to execute our restart strategy may be influenced by a variety of factors associated with the mining sector, including but not limited to obtaining the necessary financing, we encounter unexpected issues or delays in the dewatering and other pre-operational activities required to restart the mine, or we are impacted by unexpected local or global events beyond our control.
Operational Infrastructure
The Mazowe Mine has a series of historical shafts that have been equipped with hoists through which personnel and material may access the mine from the surface. We have also constructed a milling plant and a Carbon in Pulp (CIP) processing plant. Accordingly, the Mazowe Mine is serviced by its own dedicated processing facilities and accompanying infrastructure. The Mazowe Mine is accessible via the A11 between Harare, and Glendale. A railway line passes through the Mazowe Mine, linking up with the regional centers of Glendale, Bindura, and Shamva. Consumables and spares are sourced locally with a few exceptional cases where some are imported, especially from South Africa. The regional infrastructure includes access to a national power supply grid and water supply by way of an underground supply from which it is pumped.
The net book value for property, plants, and equipment at the Mazowe Mine at December 31, 2025 was approximately $0.2 million. The plant and equipment at the Mazowe Mine is obsolete and is not considered for the planned resumption of operations.
Geology
The Mazowe Mine is situated within the Harare-Bindura-Shamva greenstone belt of the Zimbabwean (Archaean) Craton, on the margin of the Chinhamhora Batholith. The Harare-Bindura-Shamva greenstone belt comprises major meta-volcano-sedimentary sequences, structurally intruded by the Chinhamhora Batholith, linking northwards through the Mazowe Mine area, and then eastwards along the Mazowe Valley, through the Harare-Bindura-Shamva greenstone belt.
History
The history of the Mazowe Mine is largely associated with that of the Jumbo Mine. It is estimated that prior to 1980, at least 150koz of gold were extracted. In 1903, the Jumbo Gold Mining Company was created.
In 1953, all existing tributes were terminated, and holdings were acquired by Lonrho Zimbabwe Ltd (“Lonrho”), which operated the area as a single entity. This was achieved using a system of cross-cuts, mined to link the various holdings. Today these cross-cuts serve as haulages. During this period, both Nucleus and Carnbrae continued to operate separately under the Murdoch Eaton brothers, but were finally acquired by Lonrho in 1962. From 1962 onwards, production became steady and continuous. Production peaked between 1965 and 1973 when it averaged approximately 3.2koz per month. After 1973, it declined reaching its lowest levels in 1991. In the same year, Independence Gold Mining (Pvt) Limited (“IGM”) took over the mine.
In 2002, BCM acquired IGM and took over GFM.Since then, post-Independence gold mining production rose from a low of 12.1koz in 2001 to 15.1koz in 2005. After 2005, production declined due to poor economic conditions. Gold production sat at around ten to 12koz for the period 2012 to 2016 and declined to approximately 6koz in 2017 and 1koz in 2018 when the mine was placed on care and maintenance.
69
The Zimbabwe Supreme Court ordered a Corporate Rescue of the mine in February 2020. The Corporate Rescue proceedings were nullified in October 2021.
Mineral Tenure
Access to the mine site and to the ore is authorized by the applicable mining legislation and the Mazowe Mining Company’s title and mining rights. Mining exploration and exploitation works conducted or to be conducted on site are authorized in accordance with the applicable legislation and the Mazowe Mining Company’s title and mining rights. Other required permits and authorizations (e.g., environmental, building, etc.) are applied for by the Mazowe Mining Company in accordance with the applicable legislation.
The Mazowe Mining Company currently possesses total ground holdings under ML 35 totaling 1,955.5 ha.
Renewal of environmental permits and licenses is part of the process to restart operations of the Mazowe Mine and is currently underway.
Mining Method
Mazowe underground mining operation has historically used traditional narrow vein mining methods with labor-intensive handheld techniques, rail transport, and shaft hoisting. The mine is pneumatic powered with rail haulage via lead acid battery powered locomotives hauling rail cars to a shaft where it is hoisted to surface. Mining is conducted using conventional drilling and blasting techniques using handheld jackhammer machines. Minimal support is used, and explosives are manually initiated. Scrapers and hand lashing are used to move muck into passes and chutes with fines swept and bagged for transport to the plant.
Operations were halted and the Mazowe Mine was placed on care and maintenance in August 2018. Efforts to resume are underway. Due to this pause, flooding of the mine to approximately 50 m below surface has occurred.
Mineral Processing
Prior to August 2018, the Mazowe Mining Company applied a standard minimum stope width of 0.87 meters at the Mazowe Mine for the purpose of defining stope envelopes for estimating Mineral Reserves. During that time, ore was processed via treatment in stages comprising crushing, milling, gravity concentration, cyanidation, adsorption, elution, electro-winning, and smelting. However, the existing process plant for underground ore at the Mazowe Mine is in poor condition and utilizes old process technology and equipment. Such plant will require re-evaluation and a determination of either upgrading or replacement prior to the restart of operations. The sands re-processing plant and tailings ownership currently resides with another party following auction and disposal by the receiver, now the subject of a legal dispute in progress. It will be necessary to successfully resolve legal proceedings to establish ownership and future potential.
Qualified Persons
Information in the Mazowe Mine Technical Report Summary has been prepared under the supervision of WSP. WSP is not an insider, associate, or affiliate of the Company or any of its subsidiaries. The results of the technical review by the QP are not dependent on any prior agreements concerning the conclusions to be reached, nor are there any undisclosed understandings concerning any future business dealings. WSP employees personally visited the Mazowe Mine in May 2024.
Exploration
Underground diamond core drilling is the primary drilling method employed at the Mazowe Mine. Diamond drill core is logged and sampled, with sample length dictated by the width of the mineralized shear zone. One sample each of the barren hanging wall and footwall is also taken and submitted for assay. Surface exploration consisting of a ground magnetic survey and reverse circulation drilling was conducted on the Amatola Prospect during 2016, aimed at exploring near-surface gold resources with the potential for open-pit mining.
The QP considers the data collected, including the method of collection and storage, to be appropriate for the preparation of geological models and Mineral Resources estimates, and that the data has been considered during resource classification.
70
The Mazowe orebodies are predominantly characterized by multitudes of subparallel, auriferous shear zones. Thus, we plan to concentrate exploration in and around the current workings from 2026 through 2030, at a cost of approximately $7.0 million, before exploring surrounding properties and claims holdings. We are also planning exploratory surface drilling in 2026.
Mineral Resource Estimate
The QP is satisfied that there has been sufficient orebody knowledge work completed to support reasonable prospects for economic extraction at the Mazowe Mine from a Mineral Resources perspective. The effective date of the Mineral Resources estimates is December 31, 2023. The total estimated underground measured and indicated Mineral Resource is approximately 1.17Mt at 7.77g/t Au, for approximately 291koz of gold, and the estimated underground inferred Mineral Resource is approximately 3.29Mt at 8.65g/t Au, for approximately 915koz of gold.
Given there has been no mining or exploration conducted since the mine was placed on care and maintenance while the workings have been flooded, in the QPs opinion the 2018 assumptions for definition of the resource base, including those described below, remained current as of December 31, 2023.
A new COG for 2023 was calculated based on the three-year trailing average gold price at December 2023 (with a gold price multiplier of 30%), applicable mill recovery, and revised operating and sustaining capital costs.
|
Parameter |
Mineral |
||
|
Au COG (g/t) |
|
2.58 |
|
|
Gold Price |
$ |
2,340/oz |
|
The below table presents the Mineral Resources (exclusive of Mineral Reserves) reported as at December 31, 2023 and 2022. Mineral Resources are reported on an in-situ basis, assuming a gold metallurgical recovery of 88.0%.
|
Fiscal Year Ended December 31, |
||||||||||||
|
2023 |
2022 |
|||||||||||
|
Mineral Resource Category |
Tonnes |
Grade |
Au Metal |
Tonnes |
Grade |
Au Metal |
||||||
|
Measured |
260 |
9.01 |
75 |
260 |
8.99 |
75 |
||||||
|
Indicated |
910 |
7.45 |
217 |
910 |
7.42 |
217 |
||||||
|
Total Measured and Indicated |
1,170 |
7.77 |
291 |
1,170 |
7.75 |
292 |
||||||
|
Inferred |
3,290 |
8.65 |
915 |
3,320 |
8.60 |
917 |
||||||
____________
Notes: kt = thousand tonnes; Au Grade g/t = gold grams per tonne; koz = thousand ounces.
It should be noted that the underground and surface Mineral Resources estimate for the Mazowe Mine is reported exclusive of Mineral Reserves. The Mineral Resources presented in this Section are not Mineral Reserves and do not reflect demonstrated economic viability. The reported Inferred Mineral Resources are considered too speculative geologically to have the economic considerations applied to them that would enable them to be categorized as Mineral Reserves. There is no certainty that all or any part of this Mineral Resource will be converted into Mineral Reserve.
Mineral Reserve Estimate
No Mineral Reserves have been estimated as of December 31, 2023. Any future estimation of Mineral Reserves and potential recommencement of operations will require the support of an additional drilling and resource definition campaign and at least a pre-feasibility to feasibility level of evaluation.
71
Quality Assurance Quality Control
Quality Assurance and Quality Control (“QAQC”) procedures used at the Mazowe Mine are as follows.
For channel sampling, one CRM sample (either a standard or a blank) is inserted for every bench sampled, or one in every twelve samples. All CRM samples are tested for compliance to set tolerance ranges, typically ± 2 SD from the designated mean value. Assay batches that are rejected are subjected to either re-assay or discarded with appropriate qualifications, such as for contamination, sample ticket mix up, or transcription errors. Channel sampling assay data is routinely subjected to validation by way of scatter and regression plots.
For core sampling, for every 10 samples of diamond drill core, at least one CRM sample (either a standard or a blank) is inserted into the sampling stream. Core being sampled is halved, with one half of the core taken for assay and the other half being stored in the core library as a duplicate. For cases where the core splitter is not functioning, the full core is sampled, and the resultant pulp is stored in the core library as a duplicate. If the tenth drill core sample is a blank, then the twentieth sample becomes a standard and the thirtieth becomes a duplicate. This cycle is on occasion rotated to avoid predictability of results. All CRM samples are tested for compliance to set tolerance ranges, typically ± 2 standard deviations (SD) from the designated mean value. Assay batches that are rejected are subjected to either re-assay or discarded with appropriate qualifications such as for, contamination, sample ticket mix up, and transcription errors. Core drilling assay data is routinely subjected to validation by way of scatter and regression plots.
For grab sampling, at least one CRM sample (either a standard or a blank) is inserted per day for each main tramming level. All CRM samples are tested for compliance to set tolerance ranges, typically ± 2 SD from the designated mean value. Assay batches that are rejected are subjected to either re-assay or discarded with appropriate qualifications such as for, contamination, sample ticket mix up, and transcription errors. Grab sampling assay data is routinely subjected to validation by way of scatter and regression plots.
Under our general guidelines, a minimum of fifteen CRM samples (standards and/or blanks) are submitted every month. All standards, blanks, and duplicates are recorded in the site QAQC book along with the sampling date, mean value, assay value, and SD. The Section Geologist compiles a QAQC report as part of the site weekly report. All assay data is subjected to QAQC iterations, such as line graphs and regression plots, and is analyzed for compliance with the set tolerance ranges, typically ± 2 SD from the designated mean value. For any other sampling projects carried out on surface or underground, outside of the normal sampling processes, CRM samples are inserted and analyzed for compliance with set tolerance ranges, typically ±2 SD from the designated mean value. Anomalous results are handled in the same manner that core drilling, grab sample, and channel samples are handled.
The process plant remains on care and maintenance, and accordingly, in the opinion of the QP, the processing and recovery methods data used to inform product predictions are adequate for the purposes used.
The QP is satisfied that the stated Mineral Resources classification reflects the appropriate level of confidence and considers those factors relevant to the deposit, and that the application of resource categories appropriately considers the relevant factors used in the classification process. Examples of specific factors that can influence the risk and uncertainty of the Mineral Resources estimates that are considered in the resource classification include: (1) interpretation of the mineralization boundary; (2) drill hole spacing and adequacy in defining geology, mineralization, structure, and grade; (3) quality of samples, assays, and geological information; (4) a COG for certain surface resources will be required; (5) pay limits are average block cut-off gold grades used to filter stoping blocks as either economic, or sub-economic; (6) the COG previously applied is not adequately explained but is understood to generally correspond with the “upper” COG to achieve breakeven, inclusive of the cost of all mine development, stoping, process, and administration costs; (7) the Mineral Resources estimates have been estimated to two decimal places for gold grade, and to the nearest tonne for tonnage, but have been reported to one decimal place for gold grade, to the neatest ounce for metal content, and to the nearest thousand tonnes for tonnage when previously reported; (8) the Mineral Resource estimation has only been subjected to visual validation by Mazowe Mining Company staff, while standard industry practice is to conduct both visual and statistical validation.
72
Redwing Mine
Property Description
The Redwing Mine is located in Penhalonga, approximately 20 km north-northeast of the City of Mutare, Manicaland Province, in the Mutare Mining District of Zimbabwe. The Redwing Mining Company, a wholly owned subsidiary of KD Mining Company (UK) Limited, which is a wholly owned subsidiary of BMC, currently holds Mining Lease 34 (“ML 34”). The Redwing Mine is classified as an exploration stage property and is currently in care and maintenance.
The following graphic illustrates the location of the Redwing Mine and its proximity to major infrastructure.
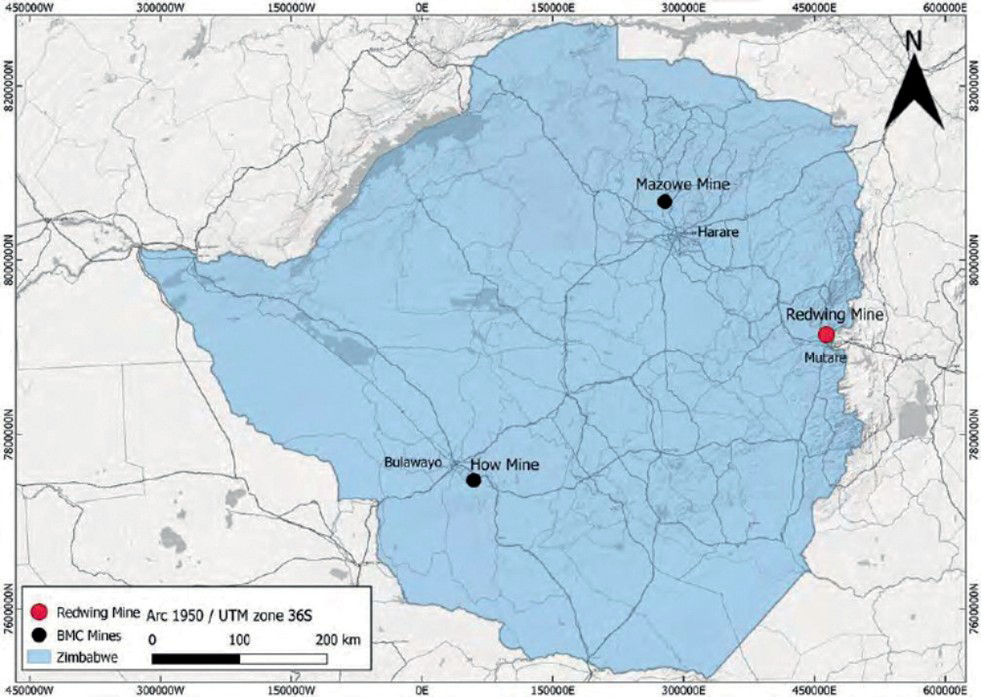
There are no known significant encumbrances to the Redwing Mine that would impact the current Mineral Resources, risks to access the Redwing Mine, or title or right to perform work.
Plans to Recommence Operations
The Redwing Mine is currently in care and maintenance. We intend to prepare for recommencement of operations at the Redwing Mine, with such preparatory work first consisting of completing a scoping study, which is anticipated to be completed within 9 to 15 months at a cost of approximately $2.5 million. We began to dewater the flooded working areas of the mine in February 2026, and we estimate that dewatering the mine will take approximately 8 months, at a cost of approximately $1.0 million, and it will take approximately 12 to 18 months to complete a feasibility study. We then intend to commence exploratory drilling, initiate small-scale production to comply with certain obligations, upgrade a decline and a hoist, construct a tailings storage facility, construct a new shaft, and install a new processing plant. Assuming we obtain the required capital resources, we expect that recommencement of mine operations could occur within a three-year period following receipt of adequate financing, of which there can be no certainty. However, we may not be able to achieve such results on the anticipated timeline or at all. Our ability to execute our restart strategy may be influenced by a variety of factors associated with the mining sector, including but not limited to obtaining the necessary financing, we encounter unexpected issues or delays in the dewatering and other pre-operational activities required to restart the mine, or we are impacted by unexpected local or global events beyond our control.
73
Operational Infrastructure
The Redwing Mine contains a series of five access shafts, with hoists, through which personnel and material may access the mine from the surface. In 2018, we had been working on the refurbishment of a rod mill and its associated circuit to improve milling capacity. Although the rod mill was expected to be commissioned by the end of 2018, certain operational challenges prevented its commissioning and mining operations were consequently suspended in March 2019, at which time Redwing Mine was placed in care and maintenance.
When operational, the Redwing Mine is serviced by its own dedicated processing facilities and accompanying infrastructure. The Redwing Mine is linked to major commercial centers by a well-established network of primary asphalt roads and is accessible from the surrounding communities through secondary gravel roads. Consumables and spares are sourced locally with a few exceptional cases where some are imported, especially from South Africa. The regional infrastructure includes access to a national power supply grid and water supply by way of river diversion and a sump pump.
The net book value for property, plants, and equipment at the Redwing Mine at December 31, 2025 was approximately $0.08 million. The plant and equipment at the Redwing Mine is obsolete and is not considered for the planned resumption of operations.
Geology
The Redwing Mine is located within the Mutare Greenstone Belt (“MGB”) which extends from the Mozambique Belt in the east into the granites and gneisses of the Zimbabwe Craton in the west. The geology is dominated by an east-west trending series of metavolcanics consisting of olivine cumulates, komatiites, komatiitic basalts, and high iron tholeiites. The rocks are extrusive, indicated by the presence of spinifex texture and pillow lavas as well as lenses of intercalated clastic sediments and discontinuous strings of BIF. The MGB is bounded by the Penhalonga Diorite to the north and south.
History
Portions of the Redwing Mine are part of the shallow historical workings that exploited the MSZ above the water table. In 1889, Baron de Rezende and James Henry Jeffreys pegged the Rezende Mineralised Shear Zone and began mining operations.
In 2008, the Redwing Mine was flooded. The causes of flooding were attributed to a shortage of foreign currency emanating from the global recession in 2008, prolonged power outages, and ZESA’s inability to supply adequate power to the region. The situation was worsened by aged pumps that were due for replacement. Consequently, in September 2008, the mine suspended operations as working areas and other critical equipment were submerged. The mine subsequently acquired five submersible pumps in the first quarter of 2010, each pumping an average of 140 cubic meters per hour. Two pumps were installed in the Rezende shaft, two in the Redwing main shaft and one in the old west shaft. The pumps were commissioned in March 2010.
The Redwing Mine resumed operations in September 2009 with re-treatment of tailings (sands) dumps, namely the Duiker and Concentrate Dumps. This re-treatment ceased in September 2013, mainly due to depressed feed grades that rendered re-processing of sands not economically viable. After pumping water to below a workable level, the Redwing Mine resumed underground mining in February 2015 in preparation of production of gold from underground that commenced in November 2015.
Following an organizational re-structuring process which became effective in June 2016, the Redwing Mine was owned by The King’s Daughter Mining Company (Private) Limited, a wholly owned subsidiary of BMC.
The Redwing Mine was placed on care and maintenance in April 2019. Supreme Court-ordered corporate rescue proceedings were implemented in July 2020. During the corporate rescue period, Betterbrands Mining Company (Pvt) Ltd. (“BBM”) was engaged as a tributor to the Redwing Mine on ML 34. Mine dewatering was maintained until suspended in December 2020 due to power supply disconnections. The water level has since risen to approximately 47 meters from the Redwing Shaft surface collar and has been stagnant at that level since April 2021. Any recommencement of mining operations will require dewatering to access Mineral Resources. The Corporate Rescue proceedings were nullified in September 2022.
In January 2024, 15 artisanal miners were trapped for three days at the Redwing Mine. On March 8, 2024, the non-standard tribute agreement with BBM was cancelled, and BBM was evicted from ML 34.
74
Mineral Tenure
Access to the mine site and to the ore, as well as mining exploration and exploitation works conducted or to be conducted on site, are authorized by applicable mining legislation and the Redwing Mining Company’s title and mining rights. Other required permits and authorizations (e.g., environmental, building, etc.) are applied for by the Redwing Mining Company in accordance with the applicable legislation.
The Redwing Mining Company holds ML 34. The area covered by the ML was surveyed in 2015 as having a surface area of 1,254 ha. Cases of illegal gold mining activities have been reported in some sections of the ML, including along the Mutare River.
Renewal of environmental permits and licenses is part of the process to restart operations of the Redwing Mine and is currently underway.
Mining Method
Three mining methods are applied at the Redwing Mine depending on the nature of the orebody and the rock mechanics considerations. The geometry of each stoping block in terms of dip and width and the nature of the mineralization largely determines the mining method:
• Up-Dip Room and Pillar: For stoping of the wide and shallow dipping felsite.
• Long Hole Open Stope: Used for the steeply dipping Rezende and Village North reefs. As conditions warrant, used in combination with the underhand mining method.
• Underhand Mining Method: Used for the narrow, steeply dipping Bromley and Kent reefs.
The mine formerly operated as a rail mine serviced by vertical and underlay (inclined shafts). Level development headings are of relatively small dimension of approximately 2 mW x 2 mH installed on approximately 100-foot intervals. The mine is pneumatic powered with rail haulage via lead acid battery powered locomotives hauling rail cars to a shaft where it is hoisted to surface. Mining is conducted using conventional drilling and blasting techniques using handheld jackhammer machines. Minimal support is used, and explosives are manually initiated. Larger long hole stoping and underhand benching has employed larger pneumatic drill rigs secured by bar and arm.
There is no backfill used for stope support apart from opportunistic disposal of development waste. Further options for mechanizing the method to improve productivity could be considered, including alternate decline access and extraction.
Operations were halted and the Redwing Mine was placed on care and maintenance in April 2019. Efforts to resume are underway. Due to this pause, flooding of the mine to approximately 50m below surface has occurred.
Mineral Processing
Prior to 2019, the Redwing Mine applied a standard minimum stope width of 90 cm for the purpose of defining stope envelopes for estimating Mineral Reserves. During that time, ore was processed via treatment in stages comprising crushing, milling, gravity separation, flotation, Merril-Crowe Process, CIP, and elution. However, the existing process plant for underground ore at the Redwing Mine is in poor condition and utilizes old process technology and equipment. Such plant will require re-evaluation and a determination of either upgrading or replacement prior to the restart of operations.
Qualified Persons
Information in the Redwing Mine Technical Report Summary has been prepared under the supervision of WSP. WSP is not an insider, associate, or affiliate of the Company or any of its subsidiaries. The results of the technical review by the QP are not dependent on any prior agreements concerning the conclusions to be reached, nor are there any undisclosed understandings concerning any future business dealings. WSP employees personally visited the Redwing Mine in May 2024.
75
Exploration
An exploration drilling campaign targeting mostly the felsite orebody was carried out around the Redwing Mine in the early 1980s. A total of 78 vertical holes were drilled. Currently, diamond core drilling is the drilling method employed at the Redwing Mine. Diamond drill core is logged and sampled on a one-meter interval depending on geology. Samples are taken to at least one meter beyond the geologically defined mineralization boundary in all drill holes. Core size drilled at the Redwing Mine is typically AXT (35.51 mm core diameter) and BQ (36.50 mm core diameter) for evaluation and exploration drill holes respectively. All exploration drill holes are collar and downhole surveyed.
The QP considers the data collected, including the method of collection and storage to be appropriate for the preparation of geological models and Mineral Resources estimates, and that the data has been considered during resource classification.
We plan to concentrate exploration in and around the down dip and strike extensions of the various reefs and felsite orebody of the Redwing Mine, outside the confines of the inferred mineral resource blocks. We intend to conduct such exploration, which is intended to include both surface and underground from 2024 through 2028 at a cost of $9.7 million.
Mineral Resource Estimate
The QP is satisfied that there has been sufficient orebody knowledge work completed to support reasonable prospects for economic extraction at the Redwing Mine from a Mineral Resources perspective. The effective date of the Mineral Resources estimates is December 31, 2023. The total estimated underground measured and indicated Mineral Resource is approximately 9.65Mt at 3.83g/t Au for approximately 1,188koz of gold, and the underground inferred Mineral Resource is approximately 15.83Mt at 2.61g/t Au for approximately 1,328koz of gold.
Given there has been no mining or exploration conducted since the mine was placed on care and maintenance while the workings have been flooded, in the QPs opinion the 2018 assumptions for definition of the resource base, including those described below, remain current as of December 31, 2023. Classification of blocks into relevant groupings was completed following standard procedures as defined and recommended in the SAMREC (2016). The stoping pay-limit defines the lower grade cut-off that is used in the process.
A new COG for 2023 was calculated based on the three-year trailing average gold price at December 2023 (with a gold price multiplier of 30%), applicable mill recovery, and revised operating and sustaining capital costs.
|
Parameter |
ROM Felsite |
ROM MSZ |
Combined |
||||||
|
Pay Limit (g/t) |
|
1.06 |
|
1.53 |
|
1.26 |
|||
|
Gold Price |
$ |
2,340/oz |
$ |
2,340/oz |
$ |
2,340/oz |
|||
The below table presents the underground Mineral Resources (exclusive of Mineral Reserves) reported as at December 31, 2023 and 2022. Mineral Resources are reported on an in-situ basis, assuming a gold metallurgical recovery of 90.0%.
|
Fiscal Year Ended December 31, |
||||||||||||
|
2023 |
2022 |
|||||||||||
|
Mineral Resource Category |
Tonnes |
Grade |
Au Metal |
Tonnes |
Grade |
Au Metal |
||||||
|
Measured |
1,450 |
2.92 |
136 |
1,450 |
2.92 |
136 |
||||||
|
Indicated |
8,200 |
3.99 |
1,052 |
8,200 |
3.99 |
1,052 |
||||||
|
Total Measured and Indicated |
9,650 |
3.83 |
1,188 |
9,650 |
3.83 |
1,88 |
||||||
|
Inferred |
15,830 |
2.61 |
1,328 |
15,380 |
2.61 |
1,328 |
||||||
____________
Notes: kt = thousand tonnes; Au Grade g/t = gold grams per tonne; koz = thousand ounces.
76
It should be noted that the underground and surface Mineral Resources estimate for the Redwing Mine is reported exclusive of Mineral Reserves. The Mineral Resources presented in this Section are not Mineral Reserves and do not reflect demonstrated economic viability. The reported Inferred Mineral Resources are considered too speculative geologically to have the economic considerations applied to them that would enable them to be categorized as Mineral Reserves. There is no certainty that all or any part of this Mineral Resource will be converted into Mineral Reserve.
Mineral Reserve Estimate
No Mineral Reserves have been estimated as of December 31, 2023. Any future estimation of Mineral Reserves and potential recommencement of operations will require the support of an additional drilling and resource definition campaign and at least a pre-feasibility to feasibility level of evaluation.
Quality Assurance Quality Control
Quality Assurance and Quality Control (“QAQC”) procedures used at the Redwing Mine are as follows.
For drill core, core derived from surface exploration activities is logged and split into two halves using a core splitter prior to sampling. Underground core (both exploration and evaluation) is logged and sampled without being split. Standard and duplicate samples are inserted at a rate of 10%, while blank samples are inserted at a rate of 20%. An accredited laboratory is used for analysis of surface exploration diamond drill core samples. A separate laboratory is used as an umpire laboratory, analyzing pulp duplicate samples. The on-site assay laboratory is used for analysis of drill core derived from underground exploration and evaluation drilling. Reference material is tested for compliance to set standards, typically ± 2 SD from the designated mean value. Assay batches that are rejected are subject to either re-assay or discarded with appropriate qualifications, such as for contamination, ticket mix-up, or transcription errors.
For channel and grab samples, house standards, duplicate samples, and blank samples are used for QAQC to monitor the day-to-day running of the mining operation. These samples are inserted at a rate of 20%. Reference material is tested for compliance to set standards, typically ± 2 SD from the designated mean value. Assay batches that are rejected are subject to either re-assay or discarded with appropriate qualifications, such as for contamination, ticket mix-up, or transcription errors. The on-site assay laboratory has its own duplicate and standard samples that the chief assayer uses to monitor laboratory performance. For every batch of 16 samples, one high-grade standard and one low-grade standard sample are utilized. Blanks are inserted at a rate of 20% for drill core, channel samples, and grab samples.
Regarding duplicates, an accredited laboratory is used for analysis of surface exploration diamond drill core samples. A separate laboratory is used as an umpire laboratory, analyzing pulp duplicate samples. The on-site assay laboratory is used for analysis of drill core derived from underground exploration and evaluation drilling. The on-site assay laboratory has its own duplicate and standard samples that the chief assayer uses to monitor laboratory performance of channel and grab samples. For every batch of 16 samples, one high-grade standard and one low-grade standard sample are utilized.
The process plant remains on care and maintenance, and accordingly, in the opinion of the QP, the processing and recovery methods data used to inform product predictions are adequate for the purposes used.
The QP is satisfied that the stated Mineral Resources classification reflects the appropriate level of confidence and considers those factors relevant to the deposit, and that the application of resource categories appropriately considers the relevant factors used in the classification process. Examples of specific factors that can influence the risk and uncertainty of the Mineral Resources estimates that are considered in the resource classification include: (1) interpretation of the mineralization boundary; (2) drill hole spacing and adequacy in defining geology, mineralization, structure, and grade; (3) quality of samples, assays, and geological information; (4) the Mineral Resource estimation has only been subjected to visual validation, while standard industry practice is to conduct both visual and statistical validation; (5) the COG used for Mineral Resource estimation seems reasonable on face value; however; the methodology used for determination of these values has not been clearly reported by Redwing Mining Company and requires further explanation; (6) the nominal estimates for extraction ratio are presumably based on historical experience and may require a more targeted application based on stoping area, method, orebody disposition and ground conditions; and (7) the Mineral Resources estimates have been estimated to two decimal places for gold grade, and to the nearest tonne for tonnage, but have been reported to one decimal place for gold grade, to the neatest ounce for metal content, and to the nearest thousand tonnes for tonnage when previously reported.
77
MANAGEMENT
Board of Directors and Management
The Company Board is comprised of Tulani Sikwila; Ibrahima Tall; Siphesihle Mchunu; Dennis A. Johnson; and Tito Botelho Martins Júnior. The directors of the Company are divided into three (3) classes designated as Class I, Class II, and Class III, respectively. At the 2026 annual general meeting, the term of office of the Class I directors shall expire and Class I directors are to be elected for a full term of three (3) years. At the 2027 annual general meeting, the term of office of the Class II directors shall expire and Class II directors shall be elected for a full term of three (3) years. At the 2028 annual general meeting, the term of office of the Class III directors shall expire and Class III directors are to be elected for a full term of three (3) years. At each succeeding annual general meeting, the directors are to be elected for a full term of three (3) years to succeed the directors of the class whose terms expire at such annual general meeting. No decrease in the number of directors constituting the Company Board is to shorten the term of any incumbent director.
The Company’s directors and executive officers are listed below.
|
Name |
Age |
Title |
Class |
|||
|
Tulani Sikwila |
46 |
Chief Executive Officer, Chief Financial Officer and Director |
III |
|||
|
Ibrahima Tall |
48 |
Director |
III |
|||
|
Siphesihle Mchunu |
36 |
Chief Legal Officer and Director |
II |
|||
|
Dennis A. Johnson |
65 |
Director |
I |
|||
|
Tito Botelho Martins Júnior |
63 |
Director |
I |
Mr. Sikwila was appointed to the role of Chief Executive Officer on March 13, 2026 in addition to his continuing role as Chief Financial Officer. Mr. Tall resigned from his role as Chief Executive Officer on March 13, 2026. Molly P. Zhang (aka Peifang Zhang) resigned as a director of the Company, effective April 1, 2026.
Tulani Sikwila. Mr. Sikwila serves as a Director, the Chief Executive Officer and the Chief Financial Officer of the Company. Mr. Sikwila was appointed to the additional role of Chief Executive Officer upon the resignation of Mr. Tall on March 13, 2026, and has served as Chief Financial Officer since June 2025. Mr. Sikwila has over 20 years of experience in finance, accounting, audit, tax, compliance, investment management, and corporate finance, with long-standing service to the Company and its predecessor companies. Prior to joining Namib Minerals, Mr. Sikwila served as Chief Financial Officer and Group Financial Controller of Metallon Corporation Limited from May 2005 to April 2025, where he was responsible for investment management, corporate finance, tax, compliance, financial reporting, treasury, budgeting, audit, and broader operational finance leadership. He also served as a director of Gold and General, a private company, from January 2012 to May 2024, leading corporate due diligence, valuation, modelling and transaction support. Mr. Sikwila previously worked as an Audit Senior at Ernst & Young in Zimbabwe from April 2001 to April 2005. Mr. Sikwila is a Chartered Accountant of England and Wales (ICAEW ACA), a Chartered Accountant (South Africa) (CA(SA)), holds an Executive M.Sc. in Finance from HEC Paris, a Diploma in Management Accounting and Financial Management from CIMA, a Bachelor of Accounting Science (Honours) from the University of South Africa, and a Bachelor of Commerce in Accounting from Rhodes University. Mr. Sikwila also serves as a director of Metallon Corporation Limited and Standard Telecom Congo, both private companies.
Ibrahima Tall. Mr. Tall serves as a Director and, until his resignation on March 13, 2026, served as the Chief Executive Officer of the Company. Mr. Tall holds a master’s degree in civil engineering from Ecole Hassania des travaux Publics (EHTP) of Casablanca Morocco and has over 24 years of experience in mining operations and management in West and South Africa. Mr. Tall joined the Company and its predecessor companies in January 2019 as Chief Operating Officer and served as Chief Executive Officer from June 2022 to March 13, 2026. Prior to his time at the Company, Mr. Tall served in various management roles at Semafo and Managem. Mr. Tall also serves as a director of Standard Telecom Congo, a private company.
Siphesihle Mchunu. Mr. Mchunu serves as a Director and the Chief Legal Officer of the Company. Mr. Mchunu holds a Master of Laws from the University of Cape Town and a Bachelor of Laws from the University of Johannesburg and has over ten years of experience with a focus in energy, infrastructure, and mining. Mr. Mchunu joined the Company and its predecessor companies as its General Counsel in June 2020 and is responsible for
78
managing the Company’s legal affairs. Prior to his time at the Company, Mr. Mchunu worked as an associate and/or senior associate at Poswa Incorporated, Routledge Modise (formerly Eversheds), and Hogan Lovells in South Africa. Mr. Mchunu also serves as a director of Standard Telecom Congo and Hatim Financial Solutions (Pty) Ltd, both private companies.
Dennis A. Johnson. Dennis A. Johnson serves as a Director of the Company and the chairperson of our audit committee. Mr. Johnson is also a member of the compensation committee and the nominating and corporate governance committee. Mr. Johnson graduated from Virginia Commonwealth University School of Business with a master’s degree in finance and the Virginia Military Institute with a bachelor’s degree in economics and is a Chartered Financial Analyst (“CFA”) Charter-holder. Mr. Johnson has over 40 years of experience as a global finance and investment executive and has served on the board of directors and as board committee chair for both public and private companies. He served as Managing Director at Citigroup from 1994 to 2005, Head of Global Corporate Governance for California Public Employees’ Retirement System (“CalPERS”), the largest public pension fund in the U.S., from 2005 to 2008, and non-executive director and member of the nominating & governance and compensation committees for Texas Industries (NYSE-TXI), one of the largest publicly traded cement and aggregates companies in the U.S. from 2009 to 2010. Mr. Johnson was also previously appointed to the SEC Investor Advisory Committee by SEC Chair Mary Shapiro. Mr. Johnson served as the Chief Investment Officer at TIAA, a Fortune 500 financial services company, from 2016 to 2018, and then served as Chief Strategy Officer at Public Investment Fund the sovereign wealth fund for the Kingdom of Saudi Arabia, from 2018 to 2020 and was based in Riyadh. Most recently, Mr. Johnson served as non-executive director and executive committee member for EasyKnock, a venture capital-backed fintech company, from 2023 to 2024 and was non-executive director and Chair of the audit committee for Glass Lewis & Company from 2022 to 2024. Mr. Johnson also served six years as an officer in the U.S. Army Reserve receiving an honorable discharge.
Tito Botelho Martins Júnior. Tito Botelho Martins Júnior serves as a Director of the Company and the chairperson of our nominating and corporate governance committee. Mr. Martins is also a member of the audit committee and compensation committee. Mr. Martins holds a Bachelor of Economics from the Federal University of Minas Gerais and an MBA from the IEAD Federal University of Rio de Janeiro, Brazil. He is a Certified Director with the National Association of Corporate Directors and has over 35 years of executive experience in the metals, mining, logistics, and energy sectors. Mr. Martins served in many executive positions at Vale S.A. from 1984 to 2003 and as Chief Executive Officer of Caemi Mineração Metalurgia from 2003 to 2006. Mr. Martins served in a variety of roles at Vale S.A. from 2006 to 2012, including most recently as Chief Financial Officer and Investor Relations Officer. From 2012 to 2021, Mr. Martins served as Chief Executive Officer and President of Nexa Resources SA (formerly Votorantim Metais) where he led the company’s initial public offering and listing on the New York Stock Exchange and the Toronto Stock Exchange. He was also Director of Cia Brasileira de Aluminio CBA, a private company, and Nexa Peru and Nexa Resources Atacocha, both public companies listed on the Lima Stock Exchange. Mr. Martins founded Kaiau Consultoria, a business and strategy consulting company, in 2022 and continues to serve as a Senior Advising Consultant. Mr. Martins currently serves as a director of Akasha Inc. and Capzul Corporation, both private companies.
Foreign Private Issuer Exemption
We are a “foreign private issuer,” as defined by the SEC. As a result, in accordance with Nasdaq rules, we may choose to comply with certain home country governance requirements and certain exemptions thereunder rather than complying with Nasdaq corporate governance standards. We currently do not choose to follow home country practice with respect to corporate governance matters; however, we may choose to do so in the future.
As a foreign private issuer, we report under the Exchange Act as a non-U.S. company with foreign private issuer status — this means that we are subject to reduced and less timely disclosure requirements and are exempt from certain provisions of the U.S. securities rules and regulations applicable to U.S. domestic issuers, including:
• the sections of the Exchange Act regulating the solicitation of proxies, consents or authorizations in respect of a security registered under the Exchange Act;
• the rules under the Exchange Act requiring the filing with the SEC of quarterly reports on Form 10-Q containing unaudited financial and other specified information, or current reports on Form 8-K, upon the occurrence of specified significant events; and
• the selective disclosure rules by issuers of material non-public information under Regulation FD.
79
We may take advantage of these exemptions until such time as we are no longer a foreign private issuer. We would cease to be a foreign private issuer at such time as more than 50% of our outstanding voting securities become directly or indirectly held of record by U.S. holders and any of the following three circumstances applies: (i) the majority of our executive officers or directors are U.S. citizens or residents, (ii) more than 50% of our assets are located in the United States or (iii) our business is administered principally in the United States.
As a result of the foregoing, our shareholders may not have the same protections afforded to shareholders of companies that are subject to all of the corporate governance requirements and the information contained herein may be different than the information you receive from other public companies in which you hold equity securities.
Controlled Company
The SelliBen Trust owns approximately 63% of the issued and outstanding Ordinary Shares. As a result, the Company is a “controlled company” within the meaning of Nasdaq listing standards because the SelliBen Trust beneficially owned greater than 50% of the total voting power of all of the Company’s issued and outstanding securities. Under these rules, a company of which more than 50% of the voting power is held by an individual, group or another company is a “controlled company.” For so long as the Company is a “controlled company,” it may elect not to comply with certain corporate governance requirements, including:
• the requirement that a majority of the board of directors consist of independent directors;
• the requirement that we have a compensation committee that is composed entirely of independent directors with a written charter addressing the committee’s purpose and responsibilities;
• the requirement that we have a nominating and corporate governance committee that is composed entirely of independent directors with a written charter addressing the committee’s purpose and responsibilities; and
• the requirement for an annual performance evaluation of the nominating and corporate governance and compensation committees.
The Company does not currently intend to rely on these exemptions. In the event that we cease to be a “controlled company” and our Ordinary Shares continue to be listed on Nasdaq, we will be required to comply with these provisions within the applicable transition periods.
Insider Trading Policy
The Company has adopted an insider trading policy governing the purchase, sale, and other dispositions of the Company’s securities by its directors, executive officers, employees, and agents that are designed to promote compliance with applicable insider trading laws, rules and regulations, including in the United States and the Cayman Islands, and Nasdaq listing standards.
Independence of our Board of Directors
The Company Board has determined that Dennis A. Johnson and Tito Botelho Martins Júnior are “independent directors,” as defined in Nasdaq listing standards and applicable SEC rules and that each satisfy the independence criteria set forth in Rule 10A-3 under the Exchange Act and the listing requirements of Nasdaq applicable to audit committee members. We intend on appointing one additional independent director within one year of the Closing Date so that a majority of the Company Board will be independent, consistent with the applicable “phase-in” period pursuant to the rules of Nasdaq. The Company Board has an independent audit committee, nominating committee, and compensation committee.
Directors may be appointed and removed by an ordinary resolution of the shareholders. In addition, directors may be appointed either to fill a vacancy arising from the resignation of a former director or as an addition to the existing board by the affirmative vote of a simple majority of the directors present and voting at a board meeting. A director may be removed by a resolution passed by all of the other directors at a meeting of the directors, or by written notice from all of the other directors. Each of our directors holds office until he or she resigns or is vacated from office.
80
Our board is divided into three (3) classes designated as Class I, Class II and Class III, respectively serving staggered three-year terms. Upon expiration of the term of a class of directors, directors in that class will be eligible to be elected for a new three-year term at the annual meeting of stockholders in the year in which their term expires. As a result of this classification of directors, it generally takes at least two annual meetings of stockholders for stockholders to effect a change in a majority of the members of our board of directors. Tito Botelho Martins Júnior and Dennis A. Johnson are Class I directors and will serve until our annual meeting in 2026. Siphesihle Mchunu is a Class II director and will serve until our annual meeting in 2027. Ibrahima Tall and Tulani Sikwila are Class III directors and will serve until our annual meeting in 2028.
Board Committees
Audit Committee
Our audit committee is responsible for, among other things:
• selecting, retaining, overseeing, compensating, evaluating and terminating our independent registered public accounting firm;
• assessing our independent registered public accounting firm their independence from management;
• reviewing and discussing, with our independent registered public accounting firm, the scope and results of their audit;
• approving all audit and permissible non-audit services to be performed by our independent registered public accounting firm;
• overseeing the financial reporting process and discussing with management and our independent registered public accounting firm the annual financial statements that we file with the SEC;
• overseeing our financial and accounting controls and compliance with legal and regulatory requirements;
• reviewing our policies on risk assessment and risk management;
• reviewing related person transactions; and
• establishing procedures for the confidential anonymous submission of concerns regarding questionable accounting, internal controls or auditing matters.
Our audit committee consists of Dennis A. Johnson and Tito Botelho Martins Júnior, each of whom qualify as independent directors according to the rules and regulations of the SEC and Nasdaq with respect to audit committee membership. In addition, all of the audit committee members meet the requirements for financial literacy under applicable SEC and Nasdaq rules, and Dennis A. Johnson qualifies as an “audit committee financial expert,” as such term is defined in Item 407(d) of Regulation S-K. Dennis A. Johnson serves as the chairperson of our audit committee. The Company Board has adopted a written charter for the audit committee, which is available on the Company’s website. The reference to the Company’s website address in this prospectus does not include or incorporate by reference the information on the Company’s website into this prospectus.
Compensation Committee
Our compensation committee is responsible for, among other things:
• setting and overseeing our executive compensation policy;
• reviewing and approving annually the corporate goals and objectives related to the CEO’s compensation, evaluating the CEO’s performance of and approving the CEO’s compensation;
• reviewing and approving the compensation of all other officers and all employment agreements and severance arrangements with our executive officers;
• overseeing our equity-based compensation plans;
81
• reviewing and approving executive employment agreements, severance policies, and change-in-control arrangements;
• making recommendations to our board of directors regarding the compensation of our directors; and
• retaining and overseeing any compensation independent advisors.
Our compensation committee consists of Tito Botelho Martins Junior and Dennis A. Johnson, each of whom qualify as independent directors according to the rules and regulations of the SEC and Nasdaq with respect to compensation committee membership, including the heightened independence standards for members of a compensation committee. The Company Board adopted a written charter for the compensation committee, which is available on the Company’s website. The reference to the Company’s website address in this prospectus does not include or incorporate by reference the information on the Company’s website into this prospectus.
Nominating and Corporate Governance Committee
Our nominating and corporate governance committee is responsible for, among other things:
• evaluating the qualifications of potential directors proposed for appointment;
• identifying and recommending individuals qualified to become members of our board of directors, consistent with criteria approved by our board of directors;
• reviewing succession planning for our Chief Executive Officer and other executive officers;
• recommend to our board of directors the structure of our board of directors and its committees and corporate governance principles;
• leading the annual performance evaluation of our board of directors; and
• retaining and overseeing independent governance advisors.
Our nominating and corporate governance committee consists of Dennis A. Johnson, and Tito Botelho Martins Júnior, each of whom qualify as independent directors according to the rules and regulations of the SEC and Nasdaq with respect to nominating corporate governance committee membership. Tito Botelho Martins Júnior serves as chairperson of our nominating and corporate governance committee. The Company Board adopted a written charter for the nominating and corporate governance committee, which is available on the Company’s website. The reference to the Company’s website address in this prospectus does not include or incorporate by reference the information on the Company’s website into this prospectus.
Duties of Directors
Under Cayman Islands law, our directors owe fiduciary duties to the Company. These include, among others (i) duty to act in good faith in what the director believes to be in the best interests of the Company as a whole; (ii) duty to exercise powers for the purposes for which those powers were conferred and not for a collateral purpose; (iii) directors should not improperly fetter the exercise of future discretion; (iv) duty not to put themselves in a position in which there is a conflict between their duty to the Company and their personal interests; and (v) duty to exercise independent judgment. In addition to the above, our directors also owe a duty to act with skill, care and diligence. This duty has been defined as a requirement to act as a reasonably diligent person having both the general knowledge, skill and experience that may reasonably be expected of a person carrying out the same functions as are carried out by that director in relation to the company and the general knowledge skill and experience which that director has.
As set out above, our directors have a duty not to put themselves in a position of conflict and this includes a duty not to engage in self-dealing, or to otherwise benefit as a result of their position. However, in some instances what would otherwise be a breach of this duty can be forgiven and/or authorized in advance by the shareholders provided that there is full disclosure by the directors. This can be done by way of permission granted in the Company Organizational Documents or alternatively by shareholder approval at general meetings.
82
The Company Board has all the powers necessary for managing, and for directing and supervising, our business affairs. The functions and powers of our board of directors include, among others:
• convening shareholders’ annual and extraordinary general meetings and reporting its work to shareholders at such meetings;
• declaring dividends and distributions;
• appointing officers and determining the term of office of the officers;
• exercising the borrowing powers of our company and mortgaging the property of our company; and
• approving the transfer of Ordinary Shares in our company, including the registration of such shares in our share register.
Risk Oversight
The Company Board is responsible for overseeing our risk management process. The Company Board focuses on our general risk management strategy, the most significant risks facing us, and oversees the implementation of risk mitigation strategies by management. Our audit committee is also responsible for discussing our policies with respect to risk assessment and risk management. Our board of directors believes its administration of its risk oversight function has not negatively affected our board of directors’ leadership structure.
Code of Business Conduct and Ethics
The Company Board has adopted a Code of Business Conduct and Ethics applicable to our directors, executive officers and team members that complies with the rules and regulations of Nasdaq and the SEC. The Code of Business Conduct and Ethics is available on the Company’s website. In addition, the Company has posted on the Corporate Governance section of its website all disclosures that are required by law or Nasdaq listing standards concerning any amendments to, or waivers from, any provision of the Code of Business Conduct and Ethics. The reference to the Company’s website address in this prospectus does not include or incorporate by reference the information on the Company’s website into this prospectus.
Compensation of Directors and Officers
Our compensation committee and the Company Board, as applicable, will make decisions with respect to the compensation of our executive officers and senior management team, including our named executive officers.
Each of our executive officers entered into employment agreements with us. Each employment agreement provides for a base salary and eligibility for bonuses and equity compensation as well as certain non-competition and non-solicitation covenants post-termination. Each of our executive officers’ employment is at-will, and any termination other than for death, disability or cause, as defined in the employment agreement, will entitle such executive officer to severance benefits consisting principally of a lump sum payment equal to six months base salary and, if such individual was participating in the Company’s health insurance, continuing health care coverage for up to six months.
For the year ended December 31, 2025, our executive officers earned aggregate cash compensation of approximately $1.40 million. The aggregate compensation paid directly or indirectly or accrued to our executive officers consisted of salaries. The Company has not set aside or accrued any amount to provide pension, retirement or other similar benefits to its executive officers or directors as of December 31, 2025. In December 2025, each of Messrs. Tall, Mchunu, and Sikwila was granted restricted stock units (“RSUs”) pursuant to the Namib Minerals 2025 Equity Incentive Plan which will provide for the right to receive, subject to vesting and the conditions set forth therein, including continued service with the Company, 174,336, 56,504 and 92,937 Ordinary Shares, respectively. Half of the RSUs will vest on December 6, 2026, and the remainder will vest on December 6, 2027; however, Mr. Tall’s RSUs vested in full in connection with his resignation as Chief Executive Officer, as detailed below.
In December 2025, each of Messrs. Tall, Mchunu, and Sikwila was also granted performance share awards of 174,336, 56,504 and 92,937 Ordinary Shares, respectively, pursuant to the Namib Minerals 2025 Equity Incentive Plan. The actual number of Ordinary Shares that will be issued, if any, will range from 0% to 200% of the applicable
83
award amount, depending on the price performance of our Ordinary Shares as compared to a benchmark of primarily gold mining companies from the date of grant to the date of vesting, and will be subject to the conditions set forth therein, including continued service with the Company. Each of the performance share awards will vest on December 6, 2027. Mr. Tall agreed to waive the right to his PSUs in connection with his resignation as Chief Executive Officer, as detailed below.
For the year ended December 31, 2025, our independent directors received aggregate cash compensation of approximately $0.35 million. In October 2025, each of Ms. Zhang and Messrs. Johnson and Martins was granted RSUs pursuant to the Namib Minerals 2025 Equity Incentive Plan which provide for the right to receive, subject to vesting and the conditions set forth therein, including continued service with the Company, 47,929, 38,344 and 38,344 Ordinary Shares, respectively. The RSUs vested on April 1, 2026.
On March 13, 2026, Mr. Tall resigned (the “Resignation”) as Chief Executive Officer of the Company but remained a director. In connection with the Resignation, Mr. Tall and the Company entered into a settlement agreement which provides that, among other things, Mr. Tall will release the Company from any and all claims relating to Mr. Tall’s employment with the Company, Mr. Tall will receive a cash payment of $834,416.50 and an equivalent dollar amount in ordinary shares, par value $0.0001 per share, of the Company based on the 10-day VWAP, resulting in 255,722 shares, and all of Mr. Tall’s outstanding RSUs vest, effective March 13, 2026. Mr. Tall also agreed to waive the right to his PSUs.
Ms. Zhang resigned as a director of the Company, effective April 1, 2026.
Equity Incentive Plan
The Company adopted the Namib Minerals 2025 Equity Incentive Plan in connection with the Closing of the Business Combination, a copy of which is filed as an exhibit to the registration statement of which this prospectus forms a part. Under the 2025 Equity Incentive Plan, the Company may grant cash and equity incentive awards to eligible service providers in order to attract, motivate and retain the talent. We anticipate that equity-based awards for our directors and named executive officers will be awarded in future years under the Equity Incentive Plan.
We filed a registration statement on Form S-8 under the Securities Act that registered the 5,367,742 Ordinary Shares reserved for issuance under the incentive plan. The Ordinary Shares covered by such registration statement are eligible for sale in the public markets, subject to vesting restrictions and any applicable holdings periods and Rule 144 limitations applicable to affiliates.
84
MANAGEMENT’S DISCUSSION AND ANALYSIS OF FINANCIAL CONDITION
AND RESULTS OF OPERATIONS
The following discussion and analysis of our financial condition and results of operations should be read together with Namib Minerals’ audited consolidated financial statements as of December 31, 2025, and 2024 and for each of the years in the three-year period ended December 31, 2025, together with related notes thereto, included elsewhere in this prospectus. The following discussion contains forward-looking statements that reflect future plans, estimates, beliefs, and expected performance. The forward-looking statements are dependent upon events, risks and uncertainties that may be outside of our control. Our actual results may differ significantly from those projected in the forward-looking statements. Factors that might cause future results to differ materially from those projected in the forward-looking statements include, but are not limited to, those discussed in the sections entitled “Risk Factors” and “Cautionary Note Regarding Forward-Looking Statements” included elsewhere in this prospectus.
Overview
Our mission is to become a leading Pan-African multi-asset mining platform for precious and critical metals, particularly gold, and to create safe, sustainable, and profitable mining operations for our employees, our communities, and our shareholders.
We are an established gold producer with an attractive portfolio of three gold mines in Zimbabwe, Africa. Our extensive track record of owning and operating gold mines spans over two decades, and our strategic footprint consists of one producing gold mine and two historically producing gold mines that we are currently positioning to restart operations. Our How Mine is an established underground gold mine with a strong track record of operations having produced an aggregate of approximately 1.84Moz of gold from 1941 through December 31, 2025. Our other principal assets, the Mazowe Mine and the Redwing Mine, are historically producing gold mines with significant mineral resources. These assets provide us with an identified pathway to operate as a multi-asset gold producer in Africa, as preparatory work is currently underway to restart operations at both mines. On a consolidated basis, combining our estimate as of December 31, 2025 for the How Mine and our estimates as of December 31, 2023 for the Mazowe Mine and the Redwing Mine, our underground measured and indicated gold resources (exclusive of reserves) totaled 2.5Moz at a grade of 2.26g/t Au and our underground inferred gold resources totaled 4.4Moz. We are also evaluating opportunities to acquire mining interests in, and expand our operations to, the DRC to unlock critical battery metals in the region
Business Combination
On June 5, 2025, Namib Minerals consummated the Business Combination. As a result, Greenstone Merger Sub merged with and into Greenstone, with Greenstone continuing as the surviving company and becoming a wholly-owned subsidiary of Namib Minerals, and SPAC Merger Sub merged with and into Red Rock Acquisition Corp. (formerly known as Hennessy Capital Investment Corp. VI, “Red Rock” or “HCVI”), with Red Rock continuing as the surviving company and becoming a wholly owned subsidiary of Namib Minerals. On June 6, 2025, the Ordinary Shares and Warrants of Namib Minerals began trading on Nasdaq under the symbols “NAMM” and “NAMMW,” respectively.
Since Red Rock did not meet the definition of a business under the guidance of IFRS as issued by the IASB, IFRS 3, Business Combination (“IFRS 3”), the Business Combination was accounted for as a share-based payment transaction in accordance with IFRS 2, Share-based Payment (“IFRS 2”), and the Business Combination was accounted for as a reverse capitalization in accordance with IFRS. Under this method of accounting, Red Rock was treated as the acquired company for financial reporting purposes and Greenstone was treated as the accounting acquirer. Accordingly, for accounting purposes, the Business Combination was treated as the equivalent of Greenstone issuing shares for the net assets of Red Rock and any difference in the fair value of the shares deemed to have been issued by Greenstone and the fair value of the accounting Red Rock’s identifiable net assets represented a service received by Greenstone, and thus it was recognized as an IFRS 2 listing service expense upon consummation of the Business Combination.
85
Key Factors and Trends Affecting Performance
As a producer of gold and other metals, we operate within the economic and regulatory environment surrounding the mining industry. Our performance and results of operations are driven by key external trends and factors including the supply and demand in the gold and metals markets, and the economic and legislative environment as well as internal factors including production, capital expenditures, reserves, and health and safety programs.
Gold Prices
Our results of operations are largely driven by the price and demand for gold. Gold has long maintained a key role as a strategic long-term investment and a critical component of investor diversification strategies. Historically, investors have gravitated toward gold for its safe-haven status during periods of economic uncertainty. This safe-haven status is driven by gold’s high liquidity, lack of credit risk, and scarcity. Gold prices have risen by 8% per annum in U.S. dollars since 1971, according to the World Gold Council, and have recently reached all-time record highs with the spot price reaching approximately $5,510 per ounce in January 2026. An increased price of gold drives increasing revenues and cash flows for the Company. Significant changes in the pricing, demand and supply of gold can significantly impact our revenue and cash flow projections and future results.
Economic and Legislative Environment
Gold mining remains critically important to Zimbabwe’s economic outlook, accounting for 80% of exports, 19% of government revenues, and 14% of national income, according to the COMZ’s 2024 Mining Industry Prospects Report, and has continued to strengthen in Zimbabwe. According to the COMZ Quarterly Member Brief for the third quarter of 2025, gold deliveries to Fidelity increased by 26% during the third quarter of 2025, reaching 12,979 kg, up from 10,310 kg in the same period the prior year.
We believe that the legislative environment is supportive of mining and development. For example, Zimbabwe passed the Responsible Mining Initiative in May 2023 to combat illegal mining, and in 2020 Zimbabwe removed the historical indigenization rule which required 51% indigenous Zimbabwean investor ownership. Special mining leases (“SMLs”), allowing for the direct export of gold and increased exposure to the U.S. dollar, reduce foreign exchange risk for entities operating in Zimbabwe. We intend to pursue SMLs for our Mazowe Mine and Redwing Mine in part to reduce our risk exposure to local currency dynamics, including inflation. The Gold Trade Act requires us to pay 5% of gold sales refined in-country to the Zimbabwean Government, which is reflected in our royalties expense. Effective January 1, 2026, the royalties percentage increases to 10% when the gold price exceeds $5,000 per ounce. A change in the percentage remitted to the government would impact our royalty expense recognized and our results of operations.
As we continue to evaluate mining opportunities in the DRC we will be subject to additional regulations. The mining industry in the DRC is primarily regulated by the Mining Code which outlines the legal framework for exploration and extraction of minerals. The Mining Code was last revised in 2018. Future economic and legislative issues in the DRC or other jurisdictions in which we operate could significantly impact our results. See “Risk Factors — Risks Related to Our Business, Operations and Industry — Our assets and operations are subject to political, economic, and other uncertainties as a result of being located in Zimbabwe and the DRC” for additional information.
As part of our Company’s environmental initiative, we recognize a provision for rehabilitation when the obligation under current environmental legislation to settle environmental disturbances created as a result of our mines’ production arises. This provision reflects our legal commitment to responsible environmental stewardship and is based on the anticipated costs that will be incurred during the decommissioning of our plant and equipment at the end of the life of the mine, as well as reclamation activities related to the restoration of the environment at each mine. Rehabilitation will occur at the end of the life of the mine, which is expected to begin in 2034 for the How Mine. With respect to the Mazowe Mine and the Redwing Mine, the timing of rehabilitation costs to be incurred is dependent on the timing of the Company restarting each mine’s operations and will be determined in a future period. We calculated the provisions for the year ended December 31, 2025 using a 4.17% discount rate for the How Mine. For the Redwing Mine and the Mazowe Mine, the rehabilitation provision is not discounted. These rates are based on the present value of each mine’s provision for rehabilitation cost based on a risk-free rate with cash flows adjusted for an average 2.3% inflation. Changes in discount rates used for each mine could significantly impact the recorded rehabilitation provisions.
86
There were important fiscal developments in Zimbabwe that occurred in mid-December 2025 following government budget revisions:
• Gold Royalty Threshold: The government reversed a proposal to double gold royalties to 10% at a gold price of $2,501 per ounce. Effective January 2026, the 5% baseline rate will now apply unless the gold price exceeds $5,000 per ounce, in which case the rate is 10%.
• Tax Incentives Retained: A proposed change to spread the 100% upfront tax deduction for capital expenditure over a project’s life was withdrawn, allowing the Company to continue deducting expansion costs immediately.
Health and Safety Initiatives
We are committed to ensuring the safety of our mines through our Safety, Health, Environment, and Quality (“SHEQ”) Initiative in an effort to create a company-wide “zero harm” environment. This program intends to create a “zero-harm” environment through occupational health and safety and dedication to safety and adherence to safety standards. Our Lost Time Injury Frequency Rate for the year ended December 31, 2025, has improved to 0.06, which is below our target of 1.00. Safety incidents could lead to increased costs, including administrative costs related to legal fees and insurance expenses, employee costs related to loss of productivity and medical expenses, and losses related to any damage caused to the mine assets. Additionally, we anticipate costs related to maintaining safety initiatives to increase in the foreseeable future as we continue to invest in occupational health, medical examinations, training, emergency preparedness, and reducing our environmental impact.
Impairment charges
Our operational performance and asset valuations are subject to the influence of unforeseen natural events. These events have previously caused impairments to our mining assets. For instance, we experienced considerable flooding at the Redwing Mine in 2015, and the Mazowe Mine was similarly affected in 2018. These natural events resulted in damage to the infrastructure and equipment, rendering reserves inaccessible and necessitating the decommissioning of certain mine shafts.
The impact of these natural events on our operations underscores the necessity of integrating climate-related risk assessments into our strategic planning. While the How Mine is insured against a variety of risks, the occurrence of such events can lead to considerable financial implications, including asset impairment and increased insurance premiums. We ceased insurance coverage for the Mazowe Mine and the Redwing Mine once mining operations were halted in 2018 and 2019, respectively, but intend on obtaining insurance coverage as part of the restart process at each mine.
Reserves and changes in reserves
The integrity and performance of our operations are intrinsically linked to the estimation and management of our ore reserves. Our property, plant, and equipment assets are subject to regular reviews for impairment, with recoverability assessed against the higher of ‘value in use’ and ‘fair value less costs to sell’. These assessments hinge on the precision of our estimates regarding economically recoverable ore reserves, anticipated production levels, commodity prices, and operational costs. Fluctuations in these variables can lead to significant adjustments in impairment losses, thereby influencing our financial outcomes.
Depreciation of our mining assets is calculated on a straight-line basis over the LOM, which is determined by the estimated quantities of mineral resources and reserves, encompassing measured, indicated, and inferred categories. The inherent uncertainties in estimating mineral resources and ore reserves mean that assumptions made at the time of estimation may later be altered by new information. Factors such as expected production from inferred resources and the quality and quantity of ore extracted are critical to these estimations.
Currency fluctuations and inflation
Our financial performance is influenced by currency fluctuations and inflationary pressures, which impact our operational costs, revenue, and profitability. Historically, our operations have been susceptible to the economic environment in which we operate, as exemplified by the hyperinflationary period in Zimbabwe in 2008 and 2009. The hyperinflation experienced in Zimbabwe led to an economic downturn that resulted in a halt in operations in 2008; however, we have been able to continuously produce since this period of instability.
87
The volatility of local currencies against the U.S. dollar, which is the Group’s functional currency and the primary currency in which transactions are conducted, may result in significant fluctuations in exchange rates, impacting procurement costs and overall operating expenses. Inflation, particularly in the form of hyperinflation, can erode the purchasing power of money, disrupt supply chains, and escalate the costs of inputs and labor. These factors combined can diminish our financial stability and strain our cash flow management. See “Risk Factors — Risks Related to Our Business, Operations and Industry — Fluctuating foreign currency and exchange rates as well as Zimbabwean exchange controls may negatively impact our business, results of operations, and financial position” for additional information.
Our revenues are generated primarily from sales of gold, the majority of which are settled in U.S. dollars and the remaining portion in local currency. Our functional currency is the U.S. dollar and greater than 90% of our transactions are conducted in U.S. dollars. These factors combined minimize our exposure to movement in foreign currency exchange rates. We incur some expenses in foreign currencies, predominantly in ZiG. To further reduce exposure to currency fluctuation, we seek to settle obligations due in local currency from recent sales settled in local currency. Zimbabwe’s past hyperinflation and currency crisis inhibited mining operations due to the country’s poor economic condition. Future decreases in the value of the Zimbabwe dollar or high rates of inflation could negatively impact our results of operations.
Availability and cost of energy
The availability and cost of energy are key factors affecting the performance of our mining operations in Zimbabwe. The country’s energy infrastructure can be challenged by an inadequate electricity supply, which is further complicated by the need to import power due to local generation limitations. The primary electricity sources, such as the Kariba hydro station and coal-fired power stations, are subject to fluctuations in output due to environmental and regional factors, which can lead to inconsistent power delivery to our mines. See “Risk Factors — Risks Related to Our Business, Operations and Industry — Our operations are vulnerable to infrastructure constraints, including power and water supply.”
In addition to supply concerns, the price of energy represents a significant component of our operational expenses. Energy price volatility can have a direct and material impact on our cost structure and overall financial results. Fluctuations in the cost of diesel fuel, which is used in our backup power solutions, can lead to further increased operational costs.
Production
The performance of our mining operations is driven by various factors influencing production. Unplanned downtime due to labor supply, safety incidents, geological, or geopolitical issues could significantly decrease production and impact the amount of gold we are able to mine and sell. Increasing labor costs and increasing energy costs will lead to an increased cost of production, which could negatively impact our results of operations. Additionally, we estimate the grade of the ore we mine. If the ore mined results in a lower density of gold than anticipated, our production will be less efficient and result in lower quantities of gold produced.
Capital Expenditures
Over the next three years, we anticipate approximately $9.5 million of additional capital expenditures will increase the capacity of the How Mine and the Mazowe Mine and the Redwing Mine restorations will require additional capital expenditures to return to production, and, assuming we obtained the required capital resources, we expect each restart could be completed in a three year period upon receipt of adequate financing, of which there can be no certainty. See “Property, Plants and equipment — Mineral Resources and Mineral Reserve Summary Disclosure — Mazowe Mine — Plans to Recommence Operations” and “Property, Plants and equipment — Mineral Resources and Mineral Reserve Summary Disclosure — Redwing Mine — Plans to Recommence Operations” for more information. Our preliminary estimate is that the restart of the Mazowe and Redwing Mines may cost up to approximately $300 to $400 million, with the majority allocated to the Redwing Mine and the balance to the Mazowe Mine. However, such estimate is preliminary and subject to a number of assumptions, risks and uncertainties, including the feasibility of current development plans and the cost of related equipment and construction, many of which are beyond our control and subject to change. As of December 31, 2025, we have not yet incurred capital expenditures for the Mazowe and Redwing Mine restorations. We expect these expenditures
88
to result in more productive and diversified operations. Evolving economic conditions, the potential for increased maintenance costs, and deviations from our cash flow estimates from the capital expenditures could result in less-productive investments than we anticipate. Our cash flow and operating results could be negatively impacted by the actual returns on our capital expenditures. While our current operations provide sufficient funding to sustain operations at the How Mine, our future capital expenditures to restore the Mazowe and Redwing mines and to expand investment to the DRC are expected to be financed with external sources of financing.
Copper and Cobalt Market Dynamics
In addition to our gold mining activities, we are also evaluating opportunities to acquire mining interests in, and expand our operations to, the DRC to mine battery metals including copper and cobalt, which play a critical role in technologies like electric vehicles and renewable energy infrastructure.
Recent Strategic Developments
The Company transitioned to a Nasdaq-listed entity (ticker: NAMM) following the closing of the Business Combination. While 2025 was a year of grade consolidation and optimization, the Company successfully stabilized operations and continued implementing expansion plans.
How Mine Capacity Expansion
The Company plans to expand ore milling capacity at its flagship How Mine from 40,500 to 55,000 tonnes per month. This planned 35% increase in throughput is designed to offset lower ore grades and is expected to be fully operational by late 2026.
Project Development & Expansion
To unlock long-term value and scale production, the Company has initiated several critical workstreams focused on technical validation and infrastructure preparation at its primary expansion sites:
• Feasibility Studies: WSP Australia Pty Limited has been engaged to conduct definitive feasibility studies for the Redwing and Mazowe restarts. These studies, expected to conclude within 12 to 18 months, are anticipated to provide the technical and economic framework required for large-scale development.
• Redwing Enabling Works: Operational activity has officially commenced at Redwing with the launch of a dewatering program that is anticipated to take approximately 8 months. This is a critical prerequisite to accessing targeted underground mining levels and begin next mine-restart processes.
• Capital Allocation: The total expansion program is estimated to require approximately $300 to $400 million in capital expenditure for the restarts of the Mazowe and Redwing Mines, with the majority allocated to the Redwing Mine and the balance to the Mazowe Mine. Funding will be prioritized towards Redwing to support its transition back into a high-output producer. Such estimate is preliminary and subject to a number of assumptions, risks and uncertainties, including the feasibility of current development plans and the cost of related equipment and construction, many of which are beyond our control and subject to change. We expect each restart could be completed in a three-year period subject to receipt of adequate financing, of which there can be no certainty.
Liquidity and Funding Strategy
The currently estimated capital required to restart the Redwing and Mazowe Mines is approximately $300 to $400 million, but that capital is not required all at once in one funding arrangement. It is expected to be phased over the life of the development program into various tranches and aligned to key project milestones.
Strategic Exploration & Critical Minerals
Beyond current production restarts, the Company is aggressively pursuing resource growth, particularly at the Redwing Mine where the Company has launched a targeted exploration program with the goal of increasing the resource base there. The Company is also evaluating opportunities in the DRC in order to diversify its portfolio into critical minerals to leverage the global energy transition.
89
Key Performance Indicators
The following table presents a summary of our key performance indicators for the years ended December 31, 2025, 2024, and 2023:
|
(In thousands, except percentages, grade, gold sales and per |
Year ended December 31, |
||||||||
|
2025 |
2024 |
2023 |
|||||||
|
Gold sales – oz(1) |
|
24,860 |
|
37,346 |
|
33,994 |
|||
|
Tonnage(2) |
|
476 |
|
478 |
|
454 |
|||
|
Grade – (g/t)(3) |
|
1.9 |
|
2.7 |
|
2.6 |
|||
|
Recovery – (%)(4) |
|
89 |
|
90 |
|
90 |
|||
|
Average net realized price(5) |
$ |
3,156 |
$ |
2,185 |
$ |
1,776 |
|||
|
Operating profit |
$ |
110,443 |
$ |
14,683 |
$ |
17,555 |
|||
|
C1 cost per ounce ($/oz)(6) |
$ |
1,653 |
$ |
1,150 |
$ |
1,174 |
|||
|
AISC per ounce ($/oz)(7) |
$ |
2,546 |
$ |
1,535 |
$ |
1,628 |
|||
|
Adjusted EBITDA(8) |
$ |
29,004 |
$ |
24,548 |
$ |
20,260 |
|||
|
Net cash flow generated from operating activities |
$ |
13,791 |
$ |
19,131 |
$ |
14,921 |
|||
____________
(1) Gold sales is defined as the ounces of gold sold in the period presented.
(2) Tonnage is defined as the total weight in tonnes of all material mined.
(3) Grade is defined as the average amount of gold contained in the mined ore. A higher grade represents higher density of gold in the ore.
(4) Recovery is defined as the percentage of gold in the raw ore collected in the concentrate, which is the product created from separating valuable minerals in the mined ore from the commercially valueless material in which ore is found.
(5) Net realized price is the actual selling price of an ounce of gold after deduction of royalties.
(6) C1 cost per ounce is a non-IFRS financial measure. For the definition of C1 cost per ounce and a reconciliation to the most directly comparable financial measure calculated and presented in accordance with IFRS, see “Non-IFRS Measures” below.
(7) AISC per ounce is a non-IFRS financial measure. For the definition of AISC per ounce and a reconciliation to the most directly comparable financial measure calculated and presented in accordance with IFRS, see “Non-IFRS Measures” below.
(8) Adjusted EBITDA is a non-IFRS financial measure. For the definition of Adjusted EBITDA and a reconciliation to the most directly comparable financial measure calculated and presented in accordance with IFRS, see “Non-IFRS Measures” below.
Non-IFRS Measures
We utilize non-IFRS financial measures, including Adjusted EBITDA, C1 cost per ounce, and AISC per ounce, to complement our IFRS reporting and provide stakeholders with a deeper understanding of our operational performance and financial health. These measures offer insights into trends and factors that IFRS metrics may not fully capture, and we believe they are essential for formulating strategic decisions and business plans. Non-IFRS financial measures should not be considered in isolation from, or as a substitute for, financial information presented in compliance with IFRS, and non-IFRS financial measures as used by Namib Minerals may not be comparable to similarly titled amounts used by other companies. While not a substitute for IFRS results, they exclude items not indicative of our core operations, enhancing comparability across periods.
90
Adjusted EBITDA
We define Adjusted EBITDA as profit for the period before finance cost, related party credit loss, taxes, changes in the fair value of earnout liability, changes in fair value of warrants, listing expenses, depreciation and amortization, impairment, interest income, financial guarantee remeasurement, transaction expense and disposal of investment. The tables below present our Adjusted EBITDA, reconciled to our Profit for the years ended December 31, 2025, 2024 and 2023, which is the most comparable IFRS measure, for the periods indicated:
|
(In thousands) |
Year ended December 31, |
|||||||||||
|
2025 |
2024 |
2023 |
||||||||||
|
Profit/(loss) for the period |
$ |
101,180 |
|
$ |
3,588 |
|
$ |
3,627 |
|
|||
|
Finance cost |
|
1,952 |
|
|
1,522 |
|
|
2,415 |
|
|||
|
Related party credit loss |
|
— |
|
|
1,426 |
|
|
6,818 |
|
|||
|
Income tax expense |
|
7,327 |
|
|
10,907 |
|
|
5,254 |
|
|||
|
Change in fair value of earnout liability |
|
(158,822 |
) |
|
— |
|
|
— |
|
|||
|
Change in fair value of warrants |
|
(5,725 |
) |
|
— |
|
|
— |
|
|||
|
Listing expense |
|
65,381 |
|
|
— |
|
|
— |
|
|||
|
Depreciation and amortization |
|
7,267 |
|
|
4,141 |
|
|
2,705 |
|
|||
|
Impairment |
|
240 |
|
|
5,724 |
|
|
— |
|
|||
|
Interest income |
|
(16 |
) |
|
(14 |
) |
|
(114 |
) |
|||
|
Financial guarantee remeasurement |
|
— |
|
|
(2,746 |
) |
|
(486 |
) |
|||
|
Transaction expense |
|
10,220 |
|
|
— |
|
|
— |
|
|||
|
Disposal of investment |
|
— |
|
|
— |
|
|
41 |
|
|||
|
Adjusted EBITDA |
$ |
29,004 |
|
$ |
24,548 |
|
$ |
20,260 |
|
|||
C1 cost per ounce
We define C1 cost as the sum of IFRS production costs and royalties’ expense. C1 cost per ounce is calculated as the C1 cost divided by the ounces of gold sold.
|
($ in thousands, unless |
How Mine |
Redwing Mine |
Total |
||||||||||||||||
|
Year ended December 31, |
Year ended December 31, |
Year ended December 31, |
|||||||||||||||||
|
2025 |
2024 |
2023 |
2025 |
2024 |
2023 |
2025 |
2024 |
2023 |
|||||||||||
|
Production cost (IFRS) |
$ |
36,958 |
38,648 |
36,501 |
— |
23 |
241 |
36,958 |
38,671 |
36,742 |
|||||||||
|
Royalties |
|
4,138 |
4,279 |
3,153 |
— |
2 |
6 |
4,138 |
4,281 |
3,159 |
|||||||||
|
C1 cost |
$ |
41,096 |
42,927 |
39,654 |
— |
25 |
247 |
41,096 |
42,952 |
39,901 |
|||||||||
|
Gold sales (oz) |
|
24,860 |
37,239 |
33,585 |
— |
107 |
409 |
24,860 |
37,346 |
33,994 |
|||||||||
|
C1 cost per ounce ($/oz) |
$ |
1,653 |
1,153 |
1,181 |
— |
234 |
604 |
1,653 |
1,150 |
1,174 |
|||||||||
AISC per ounce
We define AISC as the sum of C1 cost, sustaining capital expenditure, administrative expenses, and silver by-product credit. We define sustaining capital expenditure as capital expenditures which are necessary to maintain current gold production and execute our current mines plans. Unless otherwise specified, our sustaining capital expenditures are determined based on our additions to property, plant and equipment in any given reporting period, and are inclusive of additions included in trade payables. The silver by-product credit represents small quantities of silver which are extracted during the gold production process and sold together with gold bullion. The silver by-product credit is calculated based on a specified sale price for the by-product, which is exclusive of sale price for gold bullion. Sales of the silver by-product are reported as “Silver sales” within the notes to our consolidated financial statements. AISC per ounce is calculated as the AISC divided by the ounces of gold sold. We use this
91
metric to measure the cost of extracting an ounce of gold and measure the efficiency of our mining operations. The table below presents our AISC per ounce, reconciled to our Production cost, which is the most comparable IFRS measure, for the periods indicated.
|
($ in thousands, |
How Mine |
Redwing Mine |
Mazowe Mine |
Corporate |
Total |
||||||||||||||||||||||||||||||||||||||||||||
|
Year ended |
Year ended |
Year ended |
Year ended |
Year ended |
|||||||||||||||||||||||||||||||||||||||||||||
|
2025 |
2024 |
2023 |
2025 |
2024 |
2023 |
2025 |
2024 |
2023 |
2025 |
2024 |
2023 |
2025 |
2024 |
2023 |
|||||||||||||||||||||||||||||||||||
|
Production cost (IFRS) |
$ |
36,958 |
|
$ |
38,648 |
|
$ |
36,501 |
|
$ |
— |
$ |
23 |
$ |
241 |
$ |
— |
$ |
— |
$ |
— |
$ |
— |
$ |
36,958 |
|
$ |
38,671 |
|
$ |
36,742 |
|
|||||||||||||||||
|
Royalties (IFRS) |
|
4,138 |
|
|
4,279 |
|
|
3,153 |
|
|
— |
|
2 |
|
6 |
|
— |
|
— |
|
— |
|
— |
— |
— |
|
4,138 |
|
|
4,281 |
|
|
3,159 |
|
|||||||||||||||
|
C1 cost |
|
41,096 |
|
|
42,927 |
|
|
39,654 |
|
|
— |
|
25 |
|
247 |
|
— |
|
— |
|
— |
|
— |
— |
— |
|
41,096 |
|
|
42,952 |
|
|
39,901 |
|
|||||||||||||||
|
Sustaining capital expenditure |
|
9,070 |
|
|
8,394 |
|
|
6,481 |
|
|
— |
|
— |
|
— |
|
— |
|
— |
|
— |
|
— |
— |
— |
|
9,070 |
|
|
8,394 |
|
|
6,481 |
|
|||||||||||||||
|
Administrative expenses(1) |
|
2,438 |
|
|
1,387 |
|
|
1,029 |
|
|
2,533 |
|
2,618 |
|
3,244 |
|
1,634 |
|
2,024 |
|
4,689 |
|
6,598 |
— |
— |
|
13,203 |
|
|
6,029 |
|
|
8,992 |
|
|||||||||||||||
|
Silver by product credit |
|
(55 |
) |
|
(64 |
) |
|
(32 |
) |
|
— |
|
— |
|
— |
|
— |
|
— |
|
— |
|
— |
— |
— |
|
(55 |
) |
|
(64 |
) |
|
(32 |
) |
|||||||||||||||
|
AISC |
|
52,549 |
|
|
52,644 |
|
|
47,132 |
|
|
2,533 |
|
2,643 |
|
3,491 |
|
1,634 |
|
2,024 |
|
4,689 |
|
6,598 |
— |
— |
|
63,314 |
|
|
57,311 |
|
|
55,342 |
|
|||||||||||||||
|
Gold sales (oz) |
|
24,860 |
|
|
37,239 |
|
|
33,585 |
|
|
— |
|
107 |
|
409 |
|
— |
|
— |
|
— |
|
— |
— |
— |
|
24,860 |
|
|
37,346 |
|
|
33,994 |
|
|||||||||||||||
|
AISC per ounce ($/oz) |
$ |
2,114 |
|
$ |
1,414 |
|
$ |
1,403 |
|
$ |
NM |
$ |
24,701 |
$ |
8,535 |
$ |
NM |
$ |
NM |
$ |
NM |
$ |
NM |
NM |
NM |
$ |
2,546 |
|
$ |
1,535 |
|
$ |
1,628 |
|
|||||||||||||||
____________
NM — not meaningful.
(1) The year ended December 31, 2025 total administrative expenses of $13.1 million in the above table excludes $10.2 million of non-recurring transaction expenses which are not attributable to How Mine, Redwing Mine, or Mazowe Mine. Total administrative expenses for the year ended December 31, 2024 totaled $6.0 million.
Components of Results of Operations
Revenue
Our revenue from operations is comprised primarily of the sale of gold. Additional revenues from operations include royalties received from third-party miners contracted to mine surface level ore (additional revenue was $0 in 2025). All revenues recognized from the sale of gold are attributable to a single customer, Fidelity Gold Refinery, LTD.
Production costs
Production costs consist of mine labor costs, stores costs, electricity costs, bullion transportation costs, fuel issue costs, bullion refinery charges, and repairs and renewals costs.
Depreciation and amortization
Depreciation and amortization primarily consist of depreciation of property, plant and equipment involved in the extraction of gold, which are depreciated over the life of mine.
Royalties
Royalties primarily consisted of the 5% royalty paid on gold sales refined in-country remitted to the Zimbabwean government under the Mines and Minerals Act. Effective January 1, 2026, the royalties percentage increases to 10% when the gold price exceeds $5,000 per ounce.
92
Other income
Other income primarily consists of rehabilitation provision adjustment, milling recoveries, scrap sales, income associated with rental income as well as share of income from third party contractors.
Administrative expenses
Administrative costs primarily consist of staff costs, general and administrative charges, share-based payments, welfare costs, fines and penalties, directors’ fees, audit fees, travel, bank charges, consultancy fees and other items.
Allowance for credit losses, net of recoveries
The allowance for credit losses primarily relate to the receivables from royalty revenues recognized on the arrangements with third-party miners contracted to mine surface level ore.
Change in fair value of earnout liability
Change in fair value of earnout liability is related to the periodic remeasurement of the earnout liability at each period-end, as the earnout liability has been classified as a derivative liability under IAS 32.
Change in fair value of warrants
Change in fair value of warrants is related to the periodic remeasurement of the warrants at each period-end, as the warrants have been classified as derivative liabilities under IAS 32.
Share listing under IFRS 2
Share-listing expenses are in relation to the business combination and consist of the excess fair value of the equity interests issued to HCVI over the fair value of HCVI’s identifiable net assets.
Impairment
Our impairment costs consist of write-downs of the fair value of non-financial assets other than inventories and deferred tax assets. These costs primarily consist of impairment charges related to our capital assets including shafts, surface plant and equipment, and pre-production assets.
Foreign exchange gain
Our functional currency is the United States Dollar, and a majority of revenue was received in the United States Dollar. Foreign exchange gains primarily relate to amounts settled in local currency.
Finance cost
Our finance costs consist of interest on borrowings, the unwinding of the discount relating to the provision for rehabilitation costs, and finance charges on trade payables and other payables.
Income tax expense
We are subject to tax in multiple jurisdictions, including those in Zimbabwe, the United Kingdom, and the Cayman Islands. The tax jurisdictions in which we operate have different statutory tax rates. Accordingly, our effective tax rate will vary depending on the relative proportion of income in each jurisdiction, changes in the valuation allowance on our deferred tax assets, and changes in tax laws.
93
Results of Operations
Comparison of the results of operations for the Year Ended December 31, 2025, and December 31, 2024
The following table sets forth a summary of our consolidated results of operations for the year ended December 31, 2025, compared to the year ended December 31, 2024.
|
(In thousands, except for percentages) |
Year ended December 31, |
||||||||||||||
|
2025 |
2024 |
$ Change |
% Change |
||||||||||||
|
Gross Revenue |
$ |
82,595 |
|
$ |
85,882 |
|
$ |
(3,287 |
) |
(4 |
)% |
||||
|
Production costs |
|
(36,958 |
) |
|
(38,671 |
) |
|
1,713 |
|
(4 |
)% |
||||
|
Depreciation and amortization |
|
(7,267 |
) |
|
(4,141 |
) |
|
(3,126 |
) |
75 |
% |
||||
|
Royalties |
|
(4,138 |
) |
|
(4,281 |
) |
|
143 |
|
(3 |
)% |
||||
|
Gross profit |
|
34,232 |
|
|
38,789 |
|
|
(4,557 |
) |
(12 |
)% |
||||
|
Other income |
|
777 |
|
|
716 |
|
|
61 |
|
9 |
% |
||||
|
Administrative expenses |
|
(23,403 |
) |
|
(20,101 |
) |
|
(3,302 |
) |
16 |
% |
||||
|
Change in fair value of earnout liability |
|
158,822 |
|
|
— |
|
|
158,822 |
|
N/A |
|
||||
|
Change in fair value warrants |
|
5,725 |
|
|
— |
|
|
5,725 |
|
N/A |
|
||||
|
Listing expense |
|
(65,381 |
) |
|
— |
|
|
(65,381 |
) |
N/A |
|
||||
|
Allowance for credit losses |
|
(23 |
) |
|
(13 |
) |
|
(10 |
) |
77 |
% |
||||
|
Impairment |
|
(240 |
) |
|
(5,724 |
) |
|
5,484 |
|
(96 |
)% |
||||
|
Foreign exchange gain/(loss) |
|
(66 |
) |
|
1,016 |
|
|
(1,082 |
) |
(106 |
)% |
||||
|
Operating profit/(loss) before interest and taxation |
|
110,443 |
|
|
14,683 |
|
|
95,760 |
|
652 |
% |
||||
|
Finance cost |
|
(1,952 |
) |
|
(1,522 |
) |
|
(430 |
) |
28 |
% |
||||
|
Disposal on investment |
|
— |
|
|
— |
|
|
— |
|
N/A |
|
||||
|
Related party credit loss |
|
— |
|
|
(1,426 |
) |
|
1,426 |
|
(100 |
)% |
||||
|
Interest income |
|
16 |
|
|
14 |
|
|
2 |
|
14 |
% |
||||
|
Financial guarantee remeasurement |
|
— |
|
|
2,746 |
|
|
(2,746 |
) |
(100 |
)% |
||||
|
Profit/(loss) before taxation |
|
108,507 |
|
|
14,495 |
|
|
94,012 |
|
649 |
% |
||||
|
Income tax expense |
|
(7,327 |
) |
|
(10,907 |
) |
|
3,580 |
|
(33 |
)% |
||||
|
Profit/(loss) for the period |
$ |
101,180 |
|
$ |
3,588 |
|
$ |
97,592 |
|
2,720 |
% |
||||
The following table provides summarized financial information for our reportable segments for the year ended December 31, 2025, compared to results for the year ended December 31, 2024.
|
(In thousands, except for percentages) |
Year ended December 31, |
||||||||||||||
|
2025 |
2024 |
$ Change |
% Change |
||||||||||||
|
How Mine |
|
|
|
|
|
|
|
||||||||
|
Revenue |
$ |
82,595 |
|
$ |
85,632 |
|
$ |
(3,037 |
) |
(4 |
)% |
||||
|
Production costs |
|
(36,958 |
) |
|
(38,648 |
) |
|
1,690 |
|
(4 |
)% |
||||
|
Depreciation and amortization |
|
(7,226 |
) |
|
(4,057 |
) |
|
(3,169 |
) |
78 |
% |
||||
|
Royalties |
|
(4,138 |
) |
|
(4,279 |
) |
|
141 |
|
(3 |
)% |
||||
|
|
|
|
|
|
|
|
|||||||||
|
Mazowe Mine |
|
|
|
|
|
|
|
||||||||
|
Revenue |
|
— |
|
|
— |
|
|
— |
|
N/A |
|
||||
|
Production costs |
|
— |
|
|
— |
|
|
— |
|
N/A |
|
||||
|
Depreciation and amortization |
|
(33 |
) |
|
(81 |
) |
|
48 |
|
(59 |
)% |
||||
|
Royalties |
|
— |
|
|
— |
|
|
— |
|
N/A |
|
||||
|
|
|
|
|
|
|
|
|||||||||
|
Redwing Mine |
|
|
|
|
|
|
|
||||||||
|
Revenue |
|
— |
|
|
1,994 |
|
|
(1,994 |
) |
(100 |
)% |
||||
|
Production costs |
|
— |
|
|
(241 |
) |
|
241 |
|
(100 |
)% |
||||
|
Depreciation and amortization |
|
(8 |
) |
|
(1 |
) |
|
(7 |
) |
700 |
% |
||||
|
Royalties |
|
— |
|
|
(6 |
) |
|
6 |
|
(100 |
)% |
||||
94
Revenue
Gross revenue for the year ended December 31, 2025, was $82.6 million, a decrease of 4% from $85.9 million for the year ended December 31, 2024. This decline was primarily driven by a 33% reduction in gold grade at How Mine, which fell from 2.7 g/t Au to 1.8 g/t Au. The lower production volume was significantly mitigated by a 64% increase in the average net realized gold price, which rose from $2,185 per ounce to $3,156 per ounce during the period.
Production costs
Production costs decreased slightly by 4% to $37.0 million for the year ended December 31, 2025 from $38.7 million for the year ended December 31, 2024. While tonnage remained stable at approximately 476ktpa, production costs per ounce of ore processed increased. This increase reflects the lower gold output resulting from the planned grade consolidation phase.
Depreciation and amortization
Depreciation and amortization expense increased by 75% to $7.3 million for the year ended December 31, 2025, from $4.1 million for the year ended December 31, 2024. This was largely due to significant additions to property, plant, and equipment assets mainly driven by the commissioning of the 16N7 Phase 2 shaft sinking project at the How Mine and the acquisition of buildings at the How Mine during the year ended December 31, 2025.
Royalties
Our royalties expense decreased by $0.1 million, or 3%, to $4.1 million for the year ended December 31, 2025, from $4.3 million for the year ended December 31, 2024, in line with our sales of gold extracted from How Mine. Royalties represented approximately 5% of our revenue for the years ended December 31, 2025, and 2024.
Other income
Other income increased by $0.1 million, or 9%, to $0.8 million for the year ended December 31, 2025, compared to $0.7 million in 2024. There were decreased milling recoveries and a reduction in royalties received from third-party miners using the Mazowe mine production facilities which were offset by an increase in the rehabilitation provision.
Administrative expenses
Administrative expenses rose 16% to $23.4 million for the year ended December 31, 2025 from $20.1 million during the year ended December 31, 2024. This increase reflects that there were $10.2 million in non-recurring transaction expenses related to the Nasdaq listing and business combination compared to $7.2 million for the year ended December 31, 2024.
Share-listing expenses under IFRS 2
Since the Business Combination was accounted for in accordance with IFRS 2, the difference in the fair value of the shares deemed to have been issued by the accounting acquirer and the fair value of the accounting acquiree’s identifiable net assets represented a service received by the accounting acquirer, and thus was recognized as an expense upon consummation of the Business Combination.
Upon Closing, the excess fair value of the equity interests deemed to have been issued to HCVI as consideration over the fair value of HCVI’s identifiable net assets was recognized as listing expense in the amount of $65.4 million in the consolidated statements of profit or loss and other comprehensive income for the year ended December 31, 2025. The fair value of the equity interests was measured at the closing market price of HCVI’s publicly traded shares on June 5, 2025, which was $11.40 per share.
95
Fair value impacts of warrants and earnout
Warrants
In connection with the closing of the Business Combination, the Company issued warrants to replace each of the then outstanding warrants of HCVI (“SPAC Warrants”), effectively converting each SPAC Warrant into a right to acquire Ordinary Shares. Classified as derivative liabilities under IAS 32, these warrants reflected changes in fair value in earnings. For the year ended December 31, 2025, a gain of $5.7 million was recorded due to fluctuations in the fair value of SPAC Warrants.
Earnout shares
Following the Business Combination, the Former Greenstone Shareholders may receive up to 30 million additional Ordinary Shares over eight years, contingent upon achieving specific operational and valuation milestones. This earnout arrangement is classified as a derivative financial liability and will be revalued each reporting period, with changes recorded in profit or loss. As of December 31, 2025, the earnout liability was recognized at a total fair value of $9.9 million. By December 31, 2025, the fair value of the earnout liability decreased to $9.9 million, reflecting a remeasurement gain of $158.8 million due to changes in the expected achievement of milestones and stock price fluctuations.
Impairment
Our impairment costs consist of write-downs of non-financial assets other than inventories and deferred tax assets. This impairment ($0.2 million during the year ended December 31, 2025) primarily consists of the write-down of the rehabilitation provision related to Mazowe.
Foreign exchange loss and gain
Foreign exchange loss was $0.1 million during the year ended December 31, 2025, compared to a gain of $1 million during the year ended December 31, 2024, driven by fluctuating exchange rates and the volume of transactions denominated in a currency other than our reporting currency. The Company’s exposure to foreign currency exchange movement is primarily related to historical liabilities associated with the Redwing and Mazowe Mines which are denominated in ZiG. The Zimbabwean dollar has experienced many fluctuations due to economic factors, hyperinflation, and monetary policy decisions made by the Zimbabwean government and the Reserve Bank of Zimbabwe.
Operating profit
Operating profit before interest and taxation during the year ended December 31, 2025 was a gain of $110.4 million compared to a operating profit of $14.7 million for the year ended December 31, 2024, an increase of approximately 652%. The Company’s increase in profit for the period was driven by gross profit of $34.2 million, reflecting revenue of $82.6 million partially offset by production costs of $37.0 million, depreciation and amortization of $7.2 million and royalties of $4.2 million. Operating profit was further impacted by non-recurring transaction costs of $10.2 million included in administrative expenses, a one-time non-cash listing expense of $65.4 million, a net fair value gain on warrant of $5.7 million, and net fair value gains on earnout liability of $158.8 million (gain due to remeasurement). While gold production volumes declined, the impact was mitigated by significantly higher gold prices, which reached approximately $4,481 per ounce in December 2025.
Finance Costs
Finance costs increased by $0.4 million to $2.0 million during the year ended December 31, 2025 compared to $1.6 million during the year ended December 31, 2024 driven by an increase in borrowings.
96
Comparison of the results of operations for the Year Ended December 31, 2024, and December 31, 2023
The following table sets forth a summary of our consolidated results of operations for the year ended December 31, 2024, compared to the year ended December 31, 2023.
|
(In thousands, except for percentages) |
Year ended December 31, |
||||||||||||||
|
2024 |
2023 |
$ Change |
% Change |
||||||||||||
|
Gross Revenue |
$ |
85,882 |
|
$ |
65,063 |
|
$ |
20,819 |
|
32 |
% |
||||
|
Production costs |
|
(38,671 |
) |
|
(36,742 |
) |
|
(1,929 |
) |
5 |
% |
||||
|
Depreciation and amortization |
|
(4,141 |
) |
|
(2,705 |
) |
|
(1,436 |
) |
53 |
% |
||||
|
Royalties |
|
(4,281 |
) |
|
(3,159 |
) |
|
(1,122 |
) |
36 |
% |
||||
|
Gross profit |
|
38,789 |
|
|
22,457 |
|
|
16,332 |
|
73 |
% |
||||
|
Other income |
|
716 |
|
|
3,915 |
|
|
(3,199 |
) |
(82 |
)% |
||||
|
Administrative expenses |
|
(20,101 |
) |
|
(8,992 |
) |
|
(11,109 |
) |
124 |
% |
||||
|
Change in fair value of earnout liability |
|
— |
|
|
— |
|
|
— |
|
N/A |
|
||||
|
Change in fair value warrants |
|
— |
|
|
— |
|
|
— |
|
N/A |
|
||||
|
Listing expense |
|
— |
|
|
— |
|
|
— |
|
N/A |
|
||||
|
Allowance for credit losses |
|
(13 |
) |
|
(1,283 |
) |
|
1,270 |
|
(99 |
)% |
||||
|
Impairment |
|
(5,724 |
) |
|
— |
|
|
(5,724 |
) |
N/A |
|
||||
|
Foreign exchange gain/(loss) |
|
1,016 |
|
|
1,458 |
|
|
(442 |
) |
(30 |
)% |
||||
|
Operating profit/(loss) before interest and taxation |
|
14,683 |
|
|
17,555 |
|
|
(2,872 |
) |
(16 |
)% |
||||
|
Finance cost |
|
(1,522 |
) |
|
(2,415 |
) |
|
893 |
|
37 |
% |
||||
|
Disposal on investment |
|
— |
|
|
(41 |
) |
|
41 |
|
100 |
% |
||||
|
Related party credit loss |
|
(1,426 |
) |
|
(6,818 |
) |
|
5,392 |
|
(79 |
)% |
||||
|
Interest income |
|
14 |
|
|
114 |
|
|
(100 |
) |
(88 |
)% |
||||
|
Financial guarantee remeasurement |
|
2,746 |
|
|
486 |
|
|
2,260 |
|
465 |
% |
||||
|
Profit/(loss) before taxation |
|
14,495 |
|
|
8,881 |
|
|
5,614 |
|
63 |
% |
||||
|
Income tax expense |
|
(10,907 |
) |
|
(5,254 |
) |
|
(5,653 |
) |
108 |
% |
||||
|
Profit/(loss) for the period |
$ |
3,588 |
|
$ |
3,627 |
|
$ |
(39 |
) |
(1 |
)% |
||||
The following table provides summarized financial information for our reportable segments for the year ended December 31, 2024, compared to results for the year ended December 31, 2023.
|
(In thousands, except for percentages) |
Year ended December 31, |
||||||||||||||
|
2024 |
2023 |
$ Change |
% Change |
||||||||||||
|
How Mine |
|
|
|
|
|
|
|
||||||||
|
Revenue |
$ |
85,632 |
|
$ |
63,069 |
|
$ |
22,563 |
|
36 |
% |
||||
|
Production costs |
|
(38,648 |
) |
|
(36,501 |
) |
|
(2,147 |
) |
6 |
% |
||||
|
Depreciation and amortization |
|
(4,057 |
) |
|
(2,647 |
) |
|
(1,410 |
) |
53 |
% |
||||
|
Royalties |
|
(4,279 |
) |
|
(3,153 |
) |
|
(1,126 |
) |
36 |
% |
||||
|
|
|
|
|
|
|
|
|||||||||
|
Mazowe Mine |
|
|
|
|
|
|
|
||||||||
|
Revenue |
|
— |
|
|
— |
|
|
— |
|
N/A |
|
||||
|
Production costs |
|
— |
|
|
— |
|
|
— |
|
N/A |
|
||||
|
Depreciation and amortization |
|
(81 |
) |
|
(57 |
) |
|
(24 |
) |
42 |
% |
||||
|
Royalties |
|
— |
|
|
— |
|
|
— |
|
N/A |
|
||||
|
|
|
|
|
|
|
|
|||||||||
|
Redwing Mine |
|
|
|
|
|
|
|
||||||||
|
Revenue |
|
250 |
|
|
1,994 |
|
|
(1,744 |
) |
(87 |
)% |
||||
|
Production costs |
|
(23 |
) |
|
(241 |
) |
|
218 |
|
(90 |
)% |
||||
|
Depreciation and amortization |
|
(3 |
) |
|
(1 |
) |
|
(2 |
) |
200 |
% |
||||
|
Royalties |
|
(2 |
) |
|
(6 |
) |
|
4 |
|
(67 |
)% |
||||
97
Revenue
Our revenue increased by $20.8 million, or 32%, to $85.9 million in 2024 from $65.1 million in 2023, primarily driven by an increase in production and the price of gold. We increased production by 8%, from 34.1 thousand to 36.7 thousand ounces, and average net realized gold prices increased by $409, from $1,776 per ounce to $2,185 per ounce, or 23%.
Revenue for the How Mine increased by $22.6 million, or 36%, to $85.6 million in 2024 from $63.1 million in 2023, primarily driven by an increase in production and the price of gold. We increased production by 9%, from 33.7 thousand to 36.6 thousand ounces, and average net realized gold prices increased by $411, from $1,774 per ounce to $2,185 per ounce, or 23%.
Nominal revenues were recognized in 2023 and 2024 for the Redwing Mine through access to surface level ore, under an arrangement with a third-party miner. These amounts aren’t reflective of the expected operating capacity of the mine.
The Mazowe Mine was inactive in 2023 and 2024 and therefore had no production or revenue.
Production costs
Our production costs, primarily attributable to the How Mine, increased by $1.9 million, or 5%, to $38.7 million in 2024 from $36.7 million in 2023, primarily driven by the total increase in tonnage milled of 5%, directionally in line with the increase in production of 8%. Production costs accounted for approximately 45% of our revenue in 2024, as opposed to 56% of our revenue in 2023.
Depreciation and amortization
Our depreciation and amortization expense increased by $1.4 million, or 53%, to $4.1 million in 2024 from $2.7 million in 2023, primarily related to updated LOM and rehabilitation costs estimates that resulted in additions to property, plant and equipment assets. Depreciation accounted for approximately 5% of our revenue in 2024, as opposed to 4% of our revenue in 2023.
Royalties
Our royalties expense increased by $1.1 million, or 36%, to $4.3 million in 2024 from $3.2 million in 2023, primarily driven by increased royalties paid on increased revenues from sales of gold extracted from the How Mine. Royalties accounted for approximately 5% of our revenue in 2024 compared to 5% in 2023.
Other income
Our other income decreased by $3.2 million, or 82%, to $0.7 million in 2024 from $3.9 million in 2023, primarily driven by decreased milling recoveries and royalties income from third parties using the Mazowe mine production facilities.
Administrative expenses
Administrative expenses increased by $11.1 million in 2024, or 124%, to $20.1 million in 2024 from $9.0 million in 2023, primarily driven by an increase in general and administrative costs, staff costs, and fuel.
Allowance for credit losses
Our allowance for credit losses decreased by $1.3 million in 2024, or 99%, to $0.0 million in 2024 from $1.3 million in in 2023. The 2023 balance related to a subcontracting arrangement through which the Company earned a royalty on precious metals extracted by a third-party miner from the Redwing mine.
98
Impairment
Our impairment loss for 2024 was $5.7 million related to updated LOM and rehabilitation cost estimates which led to additions to property, plant and equipment assets, of which $5.4 million was immediately impaired as it related to the suspended and impaired Redwing and Mazowe mines. The remaining $0.3 million was attributable to the impairment of plant equipment at Mazowe mine. We did not impair any assets in 2023.
Foreign exchange gain
Foreign exchange gain decreased by $0.4 million, or 30%, to $1.0 million in 2024 from $1.5 million in 2023, primarily driven by fluctuating exchange rates and the volume of transactions denominated in a currency other than our reporting currency. The Company’s exposure to foreign currency exchange movement is primarily related to historical liabilities associated with the Redwing and Mazowe Mines which are denominated in ZWL. The Zimbabwean dollar has experienced many fluctuations due to economic factors, hyperinflation, and monetary policy decisions made by the Zimbabwean government and the Reserve Bank of Zimbabwe.
Liquidity and Capital Resources
We measure liquidity in terms of our ability to fund the cash requirements of our business operations, including working capital needs, capital expenditures, contractual obligations, debt service, and other commitments with cash flows from operations and other sources of funding. Our principal sources of liquidity to date have included cash from operating activities, cash on hand, and debt.
As of December 31, 2025, our current liabilities due within one year consisted of trade and other payables of $37.9 million, current tax payable of $6.6 million, excise tax payable of $3.6 million, and borrowings of $3.2 million and amounts due to related parties of $2.3 million. This represents a total of $53.6 million of liabilities due within one year, compared to a total of $46.0 million due within the same period as of December 31, 2024. Our current assets as of December 31, 2025, totaled $16.2 million, compared to $9.0 million as of December 31, 2024 mainly attributable to the excise duty indemnification of $3.6 million.
The Group has historically been profitable, generating positive net earnings and positive operating cash flows, and able to satisfy its obligations when due. Management anticipates that the Group will continue to be able to meet its liquidity requirements based on the Group’s cash flows projections, indicating the same for the next two years. The Group’s cash flows projections indicate working capital improvements over the next two years resulting from the Group’s planned increase in gold production at How Mine which, in tandem with rising gold prices, may result in increased profitability and increased cash flows. Profit as of December 31, 2025 is driven by the gross profit representing $34.2 million partly offset by the non-recurring transaction costs, representing $10.2 million included in administrative expenses, and the non-cash listing transactions (shares listing expense (non-recurring), earnout and warrants) representing $99.1 million.
In October 2025, Bulawayo Mining Company (Private) Limited entered into a new $8.5 million Facility Agreement (the “2025 Facility”) with African Banking Corporation of Zimbabwe Limited (ABC Banc) to fund capital expenditure and working capital, replacing the December 2024 facility. The 2025 Facility carried over the existing term loan with ABC Banc with over $3.5 million of existing borrowings (the “Existing Term Loan Facility”) and a maturity of March 31, 2028 and created three new facilities: (i) a $2.5 million term loan facility (the “New Term Loan Facility”); (ii) a $1.0 million overdraft facility (the “Overdraft Facility”); and (iii) a $1.5 million promissory notes facility (“Note Facility” and, together with the Existing Term Loan Facility, the New Term Loan Facility, and the Overdraft Facility, the “Facilities”). The New Term Loan Facility has a maturity of twenty-four (24) months from the date of drawdown, the Overdraft Facility is available until July 31, 2026, and the Note Facility has a maturity of twelve (12) months from the date of drawdown.
The 2025 Facilities provides for restrictive covenants, including limitations on additional debt, the maintenance of a debt service cover ratio, and limitations on certain liens. The interest rate on outstanding borrowings under the Existing Term Loan Facility, the New Term Loan Facility and the Overdraft Facility is based on the base lending rate quoted by ABC Banc. The 2025 Facility is secured by a $15 million deed of hypothecation over the mining lease of the How Mining Company and a lien over certain plant and equipment with a cession of insurance over such assets and a limited guarantee from Namib Minerals of $8.5 million.
99
The Group has contractual capital commitments of $6.6 million relating primarily to the implementation of its enterprise resource planning system, being Microsoft Dynamics 365, feasibility studies at Redwing and Mazowe Mines, which are required to support the planned resumption of operations, equipment at How Mine to support operations and short term leases which are immaterial.
Cash Flows
The following table summarizes our cash flows and cash and cash equivalents, for the periods indicated:
|
(In thousands) |
Year ended December 31, |
|||||||||||
|
2025 |
2024 |
2023 |
||||||||||
|
Net cash provided by operating activities |
$ |
13,791 |
|
$ |
19,131 |
|
$ |
14,921 |
|
|||
|
Net cash used in investing activities |
|
(12,392 |
) |
|
(10,065 |
) |
|
(5,625 |
) |
|||
|
Net cash provided by/(used in) financing activities |
|
795 |
|
|
(9,651 |
) |
|
(9,066 |
) |
|||
|
Net increase/(decrease) in cash and cash equivalents |
|
2,194 |
|
|
(585 |
) |
|
230 |
|
|||
|
Effect of exchange rate fluctuation on cash and cash equivalents |
|
8 |
|
|
(8 |
) |
|
(11 |
) |
|||
|
Cash and cash equivalents at the beginning of year |
|
(315 |
) |
|
278 |
|
|
59 |
|
|||
|
Cash and cash equivalents, net as of period end |
$ |
1,887 |
|
|
(315 |
) |
|
278 |
|
|||
Net cash provided by operating activities
For the year ended December 31, 2025, net cash provided by operating activities was $13.8 million, compared to $19.1 million for the year ended December 31, 2024. This decrease in cash generation was primarily driven by lower gold production volumes resulting from a 32% decline in gold grade at the How Mine, which was only partially offset by a 64% increase in the average net realized gold price.
Net cash used in investing activities
Net cash used in investing activities increased by $2.3 million, or 23%, to $12.4 million for the year ended December 31, 2025, compared to $10.1 million for the year ended December 31, 2024. This increase reflects prioritized capital expenditures for exploration and infrastructure, specifically concentrated on the How Mine capacity expansion.
Net cash provided by (used in) financing activities
Net cash provided by financing activities was $0.8 million for the year ended December 31, 2025, compared to negative $9.7 million used in financing activities for the year ended December 31, 2024. The year-over-year movement resulted primarily from $9.0 million of dividends paid in 2024 and the reclassification of $1.0 million of overdraft facilities from cash and cash equivalents to borrowings.
Critical Accounting Policies and Estimates
Our consolidated financial statements have been prepared in accordance with IFRS. Preparation of the financial statements requires our management to make judgments, estimates and assumptions that impact the reported number of net sales and expenses, assets and liabilities and the disclosure of contingent assets and liabilities. We consider an accounting judgment, estimate or assumption to be critical when the estimate or assumption is complex in nature or requires a high degree of judgment and the use of different judgments, estimates and assumptions could have a material impact on our consolidated financial statements. Management periodically reviews the Company’s estimates and makes adjustments when facts and circumstances dictate. To the extent that there are material differences between these estimates and actual results, its financial condition or results of operations will be affected.
An accounting policy is considered to be critical if it requires an accounting estimate to be made based on assumptions about matters that are highly uncertain at the time the estimate is made, and if different estimates that reasonably could have been used, or changes in the accounting estimates that are reasonably likely to occur periodically, could materially impact the consolidated financial statements. The Company believes that its critical accounting policies reflect the more significant estimates and assumptions used in the preparation of its consolidated
100
financial statements. The critical accounting policies, judgments and estimates should be read in conjunction with the Company’s consolidated financial statements and the notes thereto and other disclosures included elsewhere in this this prospectus.
Our significant accounting policies are described in Note 3 to our audited consolidated financial statements included elsewhere in this prospectus. Our critical accounting policies are described below.
Revenue Recognition
Revenue from the sale of precious metals is recognized at the point in time when control is transferred to the refinery, and the receipt of proceeds is substantially assured. We measure revenue based on the metal price at the transaction date, reflecting the consideration we are entitled to in exchange for the goods transferred.
Impairment of Financial Assets and Property, Plant, and Equipment
We assess our financial assets and property, plant, and equipment for impairment at each reporting date. This process involves judgments about whether there is observable data indicating a measurable decrease in estimated future cash flows. For financial assets, we use historical experience, external indicators, and forward-looking information to calculate expected credit losses. For property, plant, and equipment, impairment reviews are conducted when there are indications that the carrying amount may not be recoverable. The recoverable amount is based on the higher of value in use and fair value less costs to sell, which are derived from estimates of future cash flows, commodity prices, and production costs.
Depreciation and amortization
Mining assets, which includes infrastructure, property plant and equipment, and buildings used in mining production, are depreciated on a straight-line basis over the life of the mine. Estimating the quantities of economically recoverable ore reserves and mineral resources used in the life of mine estimate is inherently uncertain.
Assumptions about commodity prices, exchange rates, production costs, and recovery rates are subject to change and can significantly affect the economic viability of our reserves. These changes could impact depreciation and amortization rates, asset carrying values, and our provision for rehabilitation costs. Our estimates are based on the best available information and are reviewed periodically to reflect the latest data and economic conditions.
Provision for Rehabilitation Cost
As a mining company, we recognize a provision for rehabilitation costs when there is a present obligation under environmental laws and our social responsibility commitments to remediate environmental disturbances caused by our mining activities. The determination of these provisions is complex and requires management to make significant judgments about the future outflow of resources to settle these obligations. We estimate the costs based on current legal requirements and our understanding of the extent of the disturbance. These estimates are reviewed regularly to ensure that the carrying amount aligns with the fair value at the end of the reporting period. Any changes in the fair value estimates are recognized in profit or loss and accumulated in the rehabilitation reserve, reflecting the inherent risks and uncertainties of such obligations.
Exploration and Evaluation Assets
We recognize that the value of our exploration and evaluation assets are based in future events and circumstances, including our mining projects’ future technical feasibility and commercial viability. These assumptions may change as new information becomes available; in which case we assess if the recovery of expenditures is unlikely. The recoverable amount is dependent on the availability of sufficient funding to bring the properties into commercial production, the price of the products to be recovered and the undertaking of profitable mining operations.
101
New Accounting Standards
New accounting standards are described in Note 3.23 to our audited consolidated financial statements included elsewhere in this prospectus.
Quantitative and Qualitative Disclosures About Market Risk
Our future income, cash flows and fair values relevant to financial instruments are dependent upon prevailing market interest rates. Market risk refers to the risk of loss from adverse changes in market prices and interest rates. The primary market risk we are exposed to are the prevailing market prices of gold and silver. These prices fluctuate for many reasons, including speculative positions taken by investors or traders in gold, monetary policies announced or implemented by central banks, including the U.S. Federal Reserve, changes in the demand for gold as an investment or as a result of leasing arrangements, and changes in the demand for gold used in jewelry and for other industrial uses, including as a result of prevailing economic conditions. Generally, we sell our products at current market price and do not enter into hedging arrangements.
We operate on an international scale and engage in transactions denominated in the U.S dollar, Zimbabwean dollar, South African Rand, and more recently, ZiG. As a result, we are exposed to market risks associated with currency exchange rate fluctuations. The volatility of currency exchange rates may lead to significant fluctuations in our financial results from period to period. We recognize gains and losses from currency exchange rate movements in our financial statements, which can materially affect our net income. Operations in Zimbabwe expose us to risks related to hyperinflationary conditions. Zimbabwe has experienced significant economic challenges, including high inflation rates, currency devaluation, and currency changes evidenced by the reintroduction of the Zimbabwean dollar in 2019 as the sole legal tender, followed in 2024 by the monetary policy update requiring the ZiG to be used by all entities in Zimbabwe effective April 8, 2024. These factors contribute to a highly unpredictable operating environment, with frequent changes in monetary and exchange rate policies that can affect the stability and convertibility of the local currency. Additionally, our expenses paid in the Zimbabwean dollar, such as production labor costs, are likely to fluctuate greatly as the exchange rate between that and the U.S. dollar changes. It is important to note that while we strive to manage our currency risk effectively, there is no assurance that our efforts will fully mitigate currency and exchange risks. We analyze our sensitivity of income to foreign exchange rate changes. In this analysis, if there is a 5% strengthening or weakening of the ZiG local currency against the U.S. Dollar functional currency, we estimate that there would be either a $65,000 increase (in case of a 5% strengthening) or a $65,000 decrease (in case of a 5% weakening) to our profit for the year ended December 31, 2025.
102
CERTAIN RELATIONSHIPS AND RELATED PERSON TRANSACTIONS
The following includes summaries of transactions or agreements, since January 1, 2023, to which the Company has been a party, and in which any of its directors and executive officers, or affiliates of any of the foregoing persons, had or will have a direct or indirect material interest, other than equity and other compensation, termination, change in control and other similar arrangements, which are described under “Management” or “Security Ownership of Certain Beneficial Owners and Management.”
Relationship with the SelliBen Trust
The SelliBen Trust owns approximately 63% of the issued and outstanding Ordinary Shares. Three Rivers PTC Limited (“Three Rivers”) is the trustee of the SelliBen Trust, and Tulani Sikwila, our Chief Executive Officer and Chief Financial Officer and Director, is one of four members of the board of directors of Three Rivers. Tulani Sikwila and our other executive officers, Ibrahima Tall and Siphesihle Mchunu, are directors of Standard Telecom Congo, private company and indirect majority-owned subsidiary of the SelliBen Trust.
The Issuance of Earnout Shares Pursuant to the Business Combination Agreement
The Business Combination Agreement provides that, during the Earnout Period, the Company is obligated to issue, in addition to the Ordinary Shares issued at the Closing, up to 30.0 million Ordinary Shares to the Former Greenstone Shareholders, including the SelliBen Trust, entities controlled by our executive officers, and Khumalo, a holder of greater than 5% of our Ordinary Shares, upon and subject to achievement of the following milestones:
(i) 1.0 million Ordinary Shares, when the Company delivers a bankable feasibility study for the Mazowe Mine;
(ii) 4.0 million Ordinary Shares, if the Mazowe Mine reaches commercial production (i.e., the production of the first gold bar after processing and smelting);
(iii) 1.0 million Ordinary Shares, when the Company delivers a bankable feasibility study for the Redwing Mine;
(iv) 4.0 million Ordinary Shares, if the Redwing Mine reaches commercial production (i.e., the production of the first gold bar after processing and smelting); and
(v) 10.0 million Ordinary Shares, if the net present value of certain exploration projects in the DRC, as identified in a bankable feasibility study, is greater than or equal to $1.0 billion, with an additional 10.0 million shares if such net present value is greater than or equal to $2.0 billion
Upon the occurrence of a change of control (as defined in the Business Combination Agreement) of the Company during the Earnout Period, then all milestones described above will be deemed to have been satisfied and all Earnout Shares that have not been previously issued will be issued to the Former Greenstone Shareholders effective as of immediately prior to the consummation of such change of control. A copy of the Business Combination Agreement has been filed as an exhibit to the Registration Statement of which this prospectus forms a part.
Shareholder Support Agreement
Concurrently with the execution and delivery of the Business Combination Agreement, the SelliBen Trust, Red Rock, and Greenstone entered into a shareholder support agreement (the “Shareholder Support Agreement”), pursuant to which, among other things, and subject to the terms and conditions set forth therein, the SelliBen Trust agreed to (a) vote all shares of Greenstone held by the SelliBen Trust in favor of the Business Combination Agreement, the Business Combination and any related actions, and against any other transactions or proposals intended, or would reasonably be expected, to prevent, impede, interfere with, delay, postpone or adversely affect the Business Combination in any material respect or the failure of any closing conditions of the Business Combination Agreement, (b) adopt prior to the Closing a written resolution approving the Business Combination Agreement and the other transaction documents and approving the Business Combination and adopting the Company Organizational
103
Documents to be in effect as of the Closing, (c) take all actions reasonably necessary to consummate the Business Combination, and (d) not transfer any shares of Greenstone held by the SelliBen Trust, subject to certain exceptions. The Shareholder Support Agreement terminated in connection with Closing.
Registration Rights and Lock-up Agreement
On the Closing Date and in connection with the Business Combination, the Company, the Initial Shareholders, and certain Former Greenstone Shareholders, consisting of the SelliBen Trust, Khumalo and entities controlled by our executive officers (collectively, the “Holders”) entered into the Registration Rights and Lock-up Agreement pursuant to which, among other things, the Company granted the Holders customary demand and piggyback registration rights. In addition, the Holders, other than Khumalo, agreed not to transfer for a period of 12 months after the Closing any equity in the Company acquired by such person in connection with the Business Combination (such equity, “Lock-up Shares”), subject to certain exceptions, including the transfer of the Sponsor Warrants (and the Ordinary Shares underlying such Warrants), the Polar Shares, and 800,000 Ordinary Shares initially held by the SPAC Sponsor, provided that (x) 50% of the Lock-up Shares will be released on such date on which the last reported sale price of the Ordinary Shares equals or exceeds $12.50 per Ordinary Share (as adjusted for share splits, share combinations, share dividends, reorganizations, recapitalizations and the like) for any 20 trading days within a 30-trading day period commencing at least 150 days after the Closing Date; and (y) the other 50% of the Lock-up Shares will be released on the date on which the last reported sale price of the Ordinary Shares equals or exceeds $15.00 per Ordinary Share (as adjusted for share splits, share combinations, share dividends, reorganizations, recapitalizations and the like) for any 20 trading days within a 30-trading day period commencing at least 150 days after the Closing Date. A copy of the Registration Rights and Lock-up Agreement has been filed as an exhibit to the Registration Statement of which this prospectus forms a part.
Of the issued and outstanding Ordinary Shares, 44,999,296 are subject to the transfer restrictions contained the Registration Rights and Lock-up Agreement. The transfer restrictions of the Registration Rights and Lock-up Agreement do not apply to, among other exceptions, the securities held by Khumalo, the Polar Shares, transfers of the Sponsor Warrants (including any Ordinary Shares issuable upon the exercise of any such warrant), and transfers of an aggregate of 800,000 Ordinary Shares initially held by the SPAC Sponsor at Closing. A copy of the Registration Rights and Lock-up Agreement has been filed as an exhibit to this Report.
Agreement for the Purchase of BMC
Greenstone entered into a Share Purchase Agreement, dated June 17, 2024, as amended on January 17, 2025 (the “BMC Purchase Agreement”), with Metallon Corporation Limited, a company incorporated in England and Wales and undergoing insolvency proceedings (the “Administration”) in the U.K. (“Metallon”), the appointed administrators of Metallon (the “Administrators”), Khumalo, and the SelliBen Trust (together with Khumalo, the “Guarantors”), pursuant to which, among other things, Metallon sold all of the shares of BMC to Greenstone in exchange for consideration of approximately £53.2 million (the “Purchase Price”) to be paid by the Guarantors. The Guarantors controlled an aggregate of 84% of Metallon prior to its administration. Under the terms of the BMC Purchase Agreement, the Guarantors have agreed to indemnify and keep the Administrators, Metallon, and Greenstone fully indemnified, for a period of six years, against any and all claims or expenses arising directly or indirectly in connection with the purchase of BMC pursuant to the BMC Purchase Agreement.
Under the BMC Purchase Agreement, the Guarantors are responsible for payment of the Purchase Price, which to date has not been satisfied. However, certain Ordinary Shares held by the SelliBen Trust are held as security for the Guarantors’ obligations under the BMC Purchase Agreement. Notwithstanding the outstanding obligations of the Guarantors, Greenstone is the registered owner of all of the shares of BMC in accordance with the terms of the BMC Purchase Agreement. The Administration may not be completed until, among other things, the Purchase Price has been satisfied and all third-party creditor liabilities of Metallon have been discharged in accordance with and in satisfaction of the Administration. See “Risk Factors — Risks Related to Our Business, Operations and Industry — Greenstone’s purchase of the Mazowe Mine, the Redwing Mine, and the How Mine from Metallon may be subject to potential that may have a material adverse effect on the Company’s assets and operations.”
104
Guarantors’ Indemnification
The Guarantors have agreed to indemnify the Company, Greenstone, and their respective officers and directors in connection with any actions of the Guarantors or their affiliates taken prior to the Closing. Any claims made by the liquidator of a former majority shareholder of Metallon (which was under common control with Metallon) relating to such actions are expressly included in the scope of the indemnity. See “Risk Factors — Risks Related to Our Business, Operations and Industry — Greenstone’s purchase of the Mazowe Mine, the Redwing Mine, and the How Mine from Metallon may be subject to potential claims that may have a material adverse effect on the Company’s assets and operations.”
Guarantee of Metallon Debt by BMC
In September 2023, BMC granted a security interest in all of the shares of Gold Fields of Mazowe (UK) Limited, which holds all of the shares of the Mazowe Mining Company, in connection with a guarantee of certain outstanding debt of Metallon owed to Africorp Solutions and Advisory (PTY) Ltd. The security interest was released and the guarantee was terminated in June 2024. See Note 32 “Financial Guarantee” of our consolidated audited financial statements included elsewhere in this prospectus.
Guarantee of How Mining Debt by Metallon
On December 1, 2021, the How Mining Company entered into a $4 million Facility Agreement (the “2021 Facility”) with African Banking Corporation of Zimbabwe Limited (“ABC Banc”) which was guaranteed by Metallon (the “Metallon Guarantee”). On July 8, 2024, the How Mining Company entered into a $1 million overdraft Facility Agreement (the “Overdraft Facility”) with ABC Banc. On December 9, 2024, the How Mining Company entered into a $4 million Facility Agreement (the “2024 Facility”) with ABC Banc that was guaranteed by the Metallon Guarantee and replaced both the 2021 Facility and the Overdraft Facility. The aggregate borrowings of $1.5 million outstanding under the 2021 Facility and the Overdraft Facility were rolled into the 2024 Facility, and the 2024 Facility provided an additional $4.0 million available to be drawn. On October 15, 2025, the How Mining Company entered into a $8 million Facility Agreement (the “2025 Facility”) with ABC Banc that replaced the 2024 Facility. The 2025 Facility is guaranteed by the Company and not by the Metallon Guarantee. The Metallon Guarantee was terminated.
Payment of Employees, Short-term Borrowings, and General Administrative Expenses
BMC and Metallon, or one or more of their subsidiaries or affiliates, have historically incurred various general and administrative expenses on behalf of each other. As of December 31, 2024, the Company recorded a receivable on its balance sheet of approximately $0.8 million for general administrative expenses the Company incurred on behalf of Metallon, Metallon Management Services (“MMS”), a wholly owned subsidiary of Metallon, Metallon Gold Zimbabwe (“MGZ”), an affiliate of Metallon, and Metallon Corporation Limited (US), of which Khumalo is a significant shareholder. There were no receivables recorded as of December 31, 2025. The Company recorded a liability of approximately $2.3 million and $3.4 million as of December 31, 2025 and 2024, respectively, related to historical general administrative expenses. See Note 2 “Related party balances and transactions” of the Company’s consolidated audited financial statements included elsewhere in this prospectus. In addition, a wholly owned subsidiary of Metallon has historically paid certain executives of the Company.
BMC also issued short-term notes to various lenders that were secured by assets pledged by MGZ. The aggregate outstanding amount of such short-term notes was $0.5 million as of December 31, 2024, and there were no amounts outstanding as of December 31, 2025.
Proceeds Related to Asset Sale
On November 1, 2022, BMC divested 100% of its equity interest in an entity which held mining rights in Zimbabwe for total consideration of $1.0 million in cash and a $7.3 million note receivable (the “Note Receivable”). BMC entered into arrangements in 2022 and 2023 with third-party purchasers to convey the Note Receivable to such third parties in exchange for cash payments (“Cash Arrangement Payments”). BMC agreed for Cash Arrangement Payments of $4.8 million and $2.2 million in 2023 and 2022, respectively, to be paid directly to Metallon to assist with its working capital needs. BMC recognized estimated credit losses of $4.8 million in 2023 and $2.2 million in 2022 for such payments due to solvency and liquidity concerns at Metallon.
105
Real Estate Leased and Purchased from Related Party
The How Mining Company has historically occupied residential properties owned by MGZ. Starting January 1, 2025, the How Mining Company started paying rental payments for the real estate and paid approximately $48 thousand in rent through September 30, 2025. On September 30, 2025, the How Mining Company completed the acquisition of the applicable real estate for $1.2 million. See Note 29 “Related party information” of the Company’s consolidated audited financial statements included elsewhere in this prospectus.
Policy for related party transactions
The Company Board adopted a written related party transaction policy (the “Policy”) that sets forth certain policies and procedures for the review and approval or ratification of related person transactions, a copy of which is included in the Corporate Governance section of the Company’s website. The reference to the Company’s website address in this prospectus does not include or incorporate by reference the information on the Company’s website into this prospectus. The Policy is administered by the Company’s audit committee and requires pre-approval by the audit committee before the Company may enter into a transaction with a related party.
Under the Policy, a “related party” generally means: (i) any person who is, or at any time during the applicable period was, one of the Company’s executive officers, directors or nominee for director or any other key management personnel having authority and responsibility for planning, directing and controlling the activities of the Company; (ii) any person who is known by the Company to be the beneficial owner of more than 5% of the Ordinary Shares; (iii) any immediate family member of any of the foregoing; and (iv) enterprises in which a substantial interest in the voting power is owned, directly or indirectly, by any person described in (i), (ii), (iii), or (iv) or over which such person is able to exercise significance influence (as defined therein).
106
U.S. FEDERAL INCOME TAX CONSIDERATIONS
The following section is a summary of certain material U.S. federal income tax consequences generally applicable to the ownership and disposition of the Company’s Ordinary Shares and Warrants (collectively “Securities”) by U.S. holders (as defined below). This discussion addresses only those U.S. Holders that hold their Securities as a capital asset within the meaning of Section 1221 of the Code and does not address all the U.S. federal income tax consequences that may be relevant to particular holders in light of their individual circumstances or to holders that are subject to special rules, such as:
• financial institutions;
• entities classified as partnerships or other pass-through entities for U.S. federal income tax purposes;
• insurance companies;
• real estate investment trusts or regulated investment companies,
• accrual method taxpayers subject to special tax accounting rules as a result of their use of financial statements;
• investors who are U.S. expatriates, former U.S. citizens, or former long-term residents of the United States;
• individual retirement or other tax-deferred accounts;
• holders liable for alternative minimum tax;
• holders that actually, indirectly, or constructively owns 5% or more of (i) the total combined voting power of all classes of the Company’s shares or (ii) the total value of all classes of the Company’s shares;
• tax-exempt organizations;
• dealers in securities, commodities, or currencies;
• traders in securities that elect to use a mark-to-market method of accounting;
• persons holding Securities as part of a “straddle,” “hedge,” “conversion transaction,” “synthetic security,” or other integrated investment;
• a U.S. holder whose functional currency is not the U.S. dollar; and
• holders other than U.S. holders.
If an entity or arrangement treated as a partnership (or other pass-through entity or arrangement) for U.S. federal income tax purposes holds Securities, the tax treatment of the persons treated as partners (or other owners) in the partnership will depend on the status of the partners, the activities of the partnership and certain determinations made at the partner level. Accordingly, partnerships (or other pass-through entities or arrangements) holding Securities and the partners (or other owners) in such partnerships (or other pass-through entities or arrangements) are urged to consult their tax advisors regarding the U.S. federal income tax consequences to them.
This discussion is based upon the Code, applicable treasury regulations thereunder, published rulings, and court decisions, all as currently in effect as of the date hereof, and all of which are subject to change, possibly with retroactive effect. Tax considerations under state, local, and foreign laws, or federal laws other than those pertaining to U.S. federal income tax, are not addressed. Additionally, this discussion does not discuss the tax consequences under the alternative minimum tax or the Medicare surtax on net investment income. The Company does not intend to request any ruling from the U.S. Internal Revenue Service (the “IRS”) as to the U.S. federal income tax matters discussed herein.
107
For purposes of this discussion, a “U.S. holder” is a beneficial owner of Securities who or which is any of the following for U.S. federal income tax purposes:
• an individual who is a citizen or resident of the United States;
• a corporation, including any entity treated as a corporation for U.S. federal income tax purposes, created or organized in or under the laws of the U.S., any state thereof, or the District of Columbia;
• an estate if its income is subject to U.S. federal income taxation regardless of its source; or
• a trust, if (a) a U.S. court can exercise primary supervision over its administration and one or more U.S. persons have the authority to control all of its substantial decisions or (b) it has in effect a valid election under applicable U.S. Treasury regulations to be treated as a U.S. person.
U.S. Federal Income Tax Treatment of the Company
A corporation is generally considered for U.S. federal income tax purposes to be a tax resident in the jurisdiction of its organization or incorporation. Accordingly, under generally applicable U.S. federal income tax rules, the Company, which is incorporated under the laws of the Cayman Islands, would be classified as a foreign corporation (and, therefore, not a U.S. tax resident) for U.S. federal income tax purposes. Section 7874 of the Code provides an exception to this general rule under which a non-U.S. incorporated entity may be treated as a U.S. corporation for U.S. federal income tax purposes if each of the following three conditions is met: (i) the non-U.S. corporation acquires, directly or indirectly, substantially all of the assets held, directly or indirectly, by a U.S. corporation; (ii) the non-U.S. corporation’s “expanded affiliated group” does not have “substantial business activities” in the non-U.S. corporation’s country of organization or incorporation; and (iii) after the acquisition, the former shareholders of the acquired U.S. corporation hold at least 80% (by either vote or value) of the shares of the non-U.S. acquiring corporation by reason of holding shares in the U.S. acquired corporation (taking into account the receipt of the non-U.S. corporation’s shares in exchange for the U.S. corporation’s shares) as determined for purposes of Section 7874 (the “ownership test”). The ownership test is modified with respect to potential “third-country transactions” such that the ownership test will be met if, after the acquisition, the former shareholders of the acquired U.S. corporation hold at least 60% (by either vote or value) of the shares of the non-U.S. acquiring corporation by reason of holding shares in the U.S. acquired corporation (the “modified ownership test”). The Business Combination is a potential third-country transaction, and if so treated, the modified ownership test will apply to determine whether the Company is treated as a U.S. corporation under Section 7874 of the Code. Further, the Treasury Regulations under Section 7874 further provide for a number of special rules that aggregate multiple acquisitions of U.S. corporations for purposes of Section 7874 that are conducted as part of a plan or conducted over a 36-month period, making it more likely that Section 7874 will apply to a foreign acquiring corporation.
For purposes of Section 7874 of the Code, the first two conditions described above are expected have been met with respect to the Business Combination because the Company acquired indirectly all of the assets of SPAC through the SPAC Merger, and the Company, including its “expanded affiliated group,” was not expected to satisfy the substantial business activities test upon consummation of the Business Combination. As a result, whether Section 7874 will apply to cause the Company to be treated as a U.S. corporation for U.S. federal income tax purposes following the SPAC Merger should depend on the satisfaction of the modified ownership test.
Based upon the terms of the Business Combination, the rules for determining share ownership under Section 7874 of the Code and the Treasury Regulations promulgated thereunder, and certain factual assumptions, it is expected that the Section 7874 ownership percentage of the SPAC stockholders in the Company should be less than 60% and thus the Business Combination is not expected to cause the Company to be treated as a U.S. corporation for U.S. federal income tax purposes or to otherwise be subject to Section 7874 of the Code. However, the calculations for determining share ownership for purposes of Section 7874 of the Code are complex, subject to detailed rules and regulations (the application of which is uncertain in various respects and could be impacted by changes to applicable rules and regulations under U.S. federal income tax laws, with possible retroactive effect), and subject to certain factual uncertainties. Furthermore, for purposes of determining the ownership percentage of former SPAC stockholders for purposes of Section 7874, among other adjustments required to be taken into account, former SPAC stockholders will be deemed to own an amount of Ordinary Shares in respect of certain redemptions by SPAC prior to the Business Combination. Accordingly, and given the inherently factual
108
nature of the analysis, the Company has not sought a legal opinion from counsel in respect of the potential applicability of Section 7874 to the Business Combination, and there can be no assurance that the IRS would not assert a contrary position to those described above or that such an assertion would not be sustained by a court.
If the Company were to be treated as a U.S. corporation for U.S. federal income tax purposes (and as a result holders of Securities were treated as holders of securities of a U.S. corporation), the Company and certain holders of Securities would be subject to significant adverse tax consequences, including a higher effective corporate income tax rate on the Company and future withholding taxes on certain holders of Securities, depending on the application of any income tax treaty that might apply to reduce such withholding taxes.
The remainder of this discussion assumes that the Company will not be treated as a U.S. corporation for U.S. federal income tax purposes under Section 7874 of the Code.
Ownership and Disposition of Ordinary Shares and Warrants
Distributions on Ordinary Shares
Subject to the discussion below under “Passive Foreign Investment Company Rules,” the gross amount of any distribution on Ordinary Shares that is made out of the Company current or accumulated earnings and profits (as determined for U.S. federal income tax purposes) generally will be taxable to a U.S. holder as ordinary dividend income on the date such distribution is actually or constructively received. Any such dividends will not be eligible for the dividends received deduction allowed to corporations in respect of dividends received from other U.S. corporations. However, a non-corporate U.S. holder may be eligible for taxation at the lower rates applicable to long-term capital gain, provided that such dividends constitute qualified dividend income with respect to such U.S. holder. Qualified dividend income generally includes a dividend paid by a foreign corporation if (i) the stock with respect to which the dividend is paid is readily tradable on an established securities market in the United States (such as Nasdaq, on which certain Ordinary Shares are listed), (ii) the foreign corporation is not a PFIC for the taxable year during which the dividend is paid and the immediately preceding taxable year (as discussed below), and (iii) the U.S. holder has owned the stock for more than 60 days during the 121-day period beginning 60 days before the date on which the stock become ex-dividend (and has not entered into certain risk limiting transactions with respect to such stock).
To the extent that the amount of the distribution exceeds the Company’s current and accumulated earnings and profits (as determined under U.S. federal income tax principles), such excess amount will be treated first as a non-taxable return of capital to the extent of the U.S. holder’s tax basis in its Ordinary Shares, and thereafter as capital gain recognized on a sale or exchange. The Company may not maintain calculations of its earnings and profits under U.S. federal income tax principles and, therefore, U.S. holders should expect that the entire amount of any distribution generally will be reported as dividend income to them.
Sale, Exchange, Redemption, or Other Taxable Disposition of Securities
Subject to the discussion below under “Passive Foreign Investment Company Rules,” a U.S. holder generally will recognize gain or loss on any sale, exchange, redemption, or other taxable disposition of Securities in an amount equal to the difference between (i) the amount realized on the disposition and (ii) such U.S. holder’s adjusted tax basis in such securities. Any gain or loss recognized by a U.S. holder on a taxable disposition of Securities generally will be capital gain or loss and will be long-term capital gain or loss if the holder’s holding period in such shares or such warrants exceeds one year at the time of the disposition. Preferential tax rates may apply to long-term capital gains of non-corporate U.S. holders (including individuals). The deductibility of capital losses is subject to limitations.
Exercise or Lapse of a Warrant
Subject to the PFIC rules discussed below, a U.S. holder generally will not recognize gain or loss upon the acquisition of an Ordinary Share on the exercise of a Warrant for cash. A U.S. holder’s tax basis in an Ordinary Share received upon exercise of the Warrant generally will be an amount equal to the sum of the U.S. holder’s tax basis in the Warrant exchanged therefor and the exercise price. The U.S. holder’s holding period for an Ordinary Share received upon exercise of the Warrant will begin on the date following the date of exercise (or possibly the date of
109
exercise) of the Warrant and will not include the period during which the U.S. holder held the Warrant. If a warrant is allowed to lapse unexercised, a U.S. holder generally will recognize a capital loss equal to such holder’s tax basis in the warrant.
The tax consequences of a cashless exercise of a Warrant are not clear under current law. A cashless exercise may not be taxable, either because the exercise is not a realization event or because the exercise is treated as a “recapitalization” for U.S. federal income tax purposes. In either situation, a U.S. holder’s tax basis in the Ordinary Shares received generally would equal the U.S. holder’s tax basis in the Warrants exercised therefor. If the cashless exercise were not a realization event, it is unclear whether a U.S. holder’s holding period for the Ordinary Shares will commence on the date of exercise of the Warrant or the day following the date of exercise of the Warrant. If the cashless exercise were treated as a recapitalization, the holding period of the Ordinary Shares would include the holding period of the Warrants exercised therefor.
It is also possible that a cashless exercise could be treated in whole or in part as a taxable exchange in which gain or loss would be recognized with respect to the portion of the exercised Warrants treated as surrendered to pay the exercise price of the Warrants. In such event, a U.S. holder could be deemed to have surrendered a number of warrants having an aggregate value (as measured by the excess of the fair market value of the Ordinary Shares over the exercise price of the Warrants) equal to the exercise price for the total number of Warrants to be exercised (i.e., the Warrants underlying the number of Ordinary Shares actually received by the U.S. holder pursuant to the cashless exercise). In this case, the U.S. holder would recognize capital gain or loss in an amount equal to the difference between the value of the Warrants deemed surrendered and the U.S. holder’s tax basis in such Warrants. Such gain or loss would be long-term or short-term, depending on the U.S. holder’s holding period in the Warrants deemed surrendered. In this case, a U.S. holder’s tax basis in the Ordinary Shares received would equal the sum of the U.S. holder’s tax basis in the Warrants exercised and the exercise price of such Warrants.
It is unclear whether a U.S. holder’s holding period for the Ordinary Shares would commence on the date following the date of exercise or on the date of exercise of the Warrant; in either case, the holding period would not include the period during which the U.S. holder held the Warrant. Alternative characterizations are also possible (including as a taxable exchange of all of the Warrants surrendered by the U.S. holder for Ordinary Shares received upon exercise). Due to the absence of authority on the U.S. federal income tax treatment of a cashless exercise, including when a U.S. holder’s holding period would commence with respect to the Ordinary Shares received, there can be no assurance which, if any, of the alternative tax consequences and holding periods described above would be adopted by the IRS or a court of law. Accordingly, U.S. holders should consult their tax advisors regarding the tax consequences of a cashless exercise.
If the Company redeems Warrants for cash pursuant to the terms thereof or if the Company purchases Warrants in an open market transaction, such redemption or purchase generally will be treated as a taxable disposition to the U.S. holder, taxed as described above under “Sale, Exchange, Redemption, or Other Taxable Disposition of Ordinary Shares or Warrants.”
Possible Constructive Distributions
The terms of each Warrant provide for an adjustment to the number of Ordinary Shares for which the Warrant may be exercised or to the exercise price of the Warrant in certain events. An adjustment which has the effect of preventing dilution generally is not taxable. U.S. holders of Warrants would, however, be treated as receiving a constructive distribution from the Company if, for example, the adjustment increases such U.S. holders’ proportionate interest in our assets or earnings and profits (e.g., through an increase in the number of Ordinary Shares that would be obtained upon exercise or through a decrease in the exercise price of the Warrant), which adjustment may be made as a result of a distribution of cash or other property to the holders of Ordinary Shares. Such constructive distribution to a U.S. Holder of Warrants would be treated as if such U.S. holder had received a cash distribution from the Company generally equal to the fair market value of such increased interest (taxed generally as described above under “Distributions on Ordinary Shares”).
Passive Foreign Investment Company Rules
The treatment of U.S. holders of the Securities could be materially different from that described above, if the Company is treated as a passive foreign investment company (a “PFIC”), for U.S. federal income tax purposes. A non-U.S. corporation, such as the Company, will be a PFIC for U.S. federal income tax purposes for any taxable
110
year in which, after the application of certain look-through rules either: (i) 75% or more of its gross income for such taxable year is passive income or (ii) 50% or more of the total value of its assets (generally based on an average of the quarterly values of the assets during such year) is attributable to assets, including generally cash, that produce passive income or are held for the production of passive income. Cash is generally a passive asset. Goodwill is active to the extent attributable to activities that produce or are intended to produce active income. Passive income generally includes dividends, interest, royalties, rents, annuities, net gains from the sale or exchange of property producing such income, and net foreign currency gains. The determination of whether the Company is a PFIC is based upon the composition of the Company’s income and assets, (including, among others, corporations in which the Company owns at least a 25% interest), and the nature of the Company’s activities.
Whether the Company is a PFIC for any taxable year is a fact-intensive inquiry that depends, in part, upon the composition and classification of the Company’s income and assets from time to time. The tests for determining PFIC status are applied annually after the close of the taxable year, and it is difficult to predict accurately future income and assets relevant to this determination. The fair market value of the assets of the Company is expected to depend, in part, upon (a) the market value of the Ordinary Shares and (b) the composition of the assets and income of the Company. A decrease in the market value of the Ordinary Shares and/or an increase in cash or other passive assets would increase the relative percentage of its passive assets. Accordingly, there can no assurance that the Company will not be a PFIC for its current taxable year or any future taxable year.
If the Company is or becomes a PFIC during any year in which a U.S. holder holds Ordinary Shares, unless the U.S. holder makes a qualified electing fund (QEF) election or mark-to-market election with respect to the shares, as described below, a U.S. holder generally would be subject to additional taxes (including taxation at ordinary income rates and an interest charge) on any gain realized from a sale or other disposition of the Ordinary Shares and on any “excess distributions” received from the Company, regardless of whether the Company qualifies as a PFIC in the year in which such distribution is received or gain is realized. For this purpose, a pledge of the Ordinary Shares as security for a loan may be treated as a disposition. The U.S. holder would be treated as receiving an excess distribution in a taxable year to the extent that distributions on the shares during that year exceed 125% of the average amount of distributions received during the three preceding taxable years (or, if shorter, the U.S. holder’s holding period). To compute the tax on excess distributions or on any gain, (i) the excess distribution or gain would be allocated ratably over the U.S. holder’s holding period, (ii) the amount allocated to the current taxable year and any year before the first taxable year for which the Company was a PFIC would be taxed as ordinary income in the current year and (iii) the amount allocated to other taxable years would be taxed at the highest applicable marginal rate in effect for each such year (i.e., at ordinary income tax rates) and an interest charge would be imposed to recover the deemed benefit from the deferred payment of the tax attributable to each such prior year.
If the Company were to be treated as a PFIC, a U.S. holder may avoid the excess distribution rules described above by electing to treat the Company (for the first taxable year in which the U.S. holder owns any shares) and any lower-tier PFIC (for the first taxable year in which the U.S. holder is treated as owning an equity interest in such lower-tier PFIC) as a QEF. If a U.S. holder makes an effective QEF election with respect to the Company (and any lower-tier PFIC), the U.S. holder will be required to include in gross income each year, whether or not the Company makes distributions (as capital gains), its pro rata share of the Company’s (and such lower-tier PFIC’s) net capital gains and its pro rata share of the Company’s (and such lower-tier PFIC’s) net earnings in excess of its net capital gains (as ordinary income). U.S. holders can make a QEF election only if the Company (and each lower-tier PFIC) provides certain information, including the amount of its ordinary earnings and net capital gains determined under U.S. tax principles. The Company does not expect to provide the information necessary for a U.S. holder to make a qualified electing fund election if the Company is classified as a PFIC.
As an alternative to making a QEF election, a U.S. holder may also be able to avoid some of the adverse U.S. tax consequences of PFIC status by making an election to mark the Ordinary Shares to market annually. A U.S. holder may elect to mark-to-market the Ordinary Shares only if they are “marketable stock.” The Ordinary Shares will be treated as “marketable stock” if they are regularly traded on a “qualified exchange.” Nasdaq, where the Ordinary Shares are currently listed, is a qualified exchange for these purposes. The Ordinary Shares will be treated as regularly traded in any calendar year in which more than a de minimis quantity of the Ordinary Shares are traded on at least 15 days during each calendar quarter.
111
The application of the PFIC rules to U.S. holders of Warrants is unclear. Section 1298(a)(4) of the Code provides that, to the extent provided in Treasury Regulations, any person who has an option to acquire stock in a PFIC shall be considered to own such stock in the PFIC for purposes of certain PFIC rules. Proposed Treasury Regulations under Section 1298(a)(4) of the Code, which were promulgated with a retroactive effective date, generally treat an “option” (which would include a Warrant) to acquire the stock of a PFIC as stock of the PFIC. However, no final Treasury Regulations are currently in effect under Section 1298(a)(4) of the Code. Therefore, it is possible that the proposed Treasury Regulations if finalized in their current form would apply to cause gain recognized on the taxable disposition of Warrants to be subject to the excess distribution regime discussed above. Additionally, final Treasury Regulations issued under the PFIC rules provide that the QEF election does not apply to options and no mark-to-market election is currently available with respect to options.
A U.S. holder that owns (or is deemed to own) shares in a PFIC during any taxable year of the U.S. holder generally is required to file an IRS Form 8621 with such U.S. holder’s U.S. federal income tax return and provide such other information as the IRS may require. Failure to file IRS Form 8621 for each applicable taxable year may result in substantial penalties and result in the U.S. holder’s taxable years being open to audit by the IRS until such forms are properly filed.
U.S. holders should consult their tax advisors regarding the U.S. federal income tax consequences of the PFIC rules. If the Company is treated as a PFIC, each U.S. holder generally will be required to file a separate annual information return with the IRS with respect to the Company and any lower-tier PFICs.
Additional Reporting Requirements
Certain U.S. holders holding specified foreign financial assets with an aggregate value in excess of the applicable dollar thresholds are required to report information to the IRS relating to Securities, subject to certain exceptions (including an exception for Securities held in accounts maintained by U.S. financial institutions), by attaching a complete IRS Form 8938 (Statement of Specified Foreign Financial Assets), with their tax return, for each year in which they hold Securities. Substantial penalties apply to any failure to file IRS Form 8938, unless the failure is shown to be due to reasonable cause and not willful neglect. Also, in the event a U.S. holder does not file IRS Form 8938 or fails to report a specified foreign financial asset that is required to be reported, the statute of limitations on the assessment and collection of U.S. federal income taxes of such U.S. holder for the related taxable year may not close before the date which is three years after the date on which the required information is filed. U.S. holders should consult their tax advisors regarding the effect, if any, of these rules on the ownership and disposition of Securities.
Information Reporting and Backup Withholding
In general, information reporting requirements may apply to dividends received by U.S. holders of Ordinary Shares, and the proceeds received on the sale, exchange or redemption of Ordinary Shares or Warrants effected within the United States (and, in certain cases, outside the United States), in each case other than U.S. holders that are exempt recipients (such as corporations). Backup withholding may apply to such amounts if the U.S. holder fails to provide an accurate taxpayer identification number (generally on an IRS Form W-9 provided to the paying agent of the U.S. holder’s broker) or is otherwise subject to backup withholding.
Backup withholding is not an additional tax. Amounts withheld as backup withholding may be credited against the U.S. holder’s U.S. federal income tax liability, and a U.S. holder may obtain a refund of any excess amounts withheld under the backup withholding rules by timely filing the appropriate claim for a refund with the IRS and furnishing any required information.
U.S. holders should consult their tax advisors regarding the application of the U.S. information reporting and backup withholding rules.
112
CERTAIN MATERIAL CAYMAN ISLAND TAX CONSIDERATIONS
The following description is not intended to constitute a complete analysis of all tax consequences relating to the acquisition, ownership, and disposition of the Ordinary Shares and should not be construed as legal or professional tax advice. You should consult your own tax advisor concerning the tax consequences of your particular situation, as well as any tax consequences that may arise under the laws of any state, local, foreign, or other taxing jurisdiction.
Prospective investors should consult their advisors on the possible tax consequences of investing in our securities under the laws of their country of citizenship, residence, or domicile.
Cayman Islands Tax Considerations
The following is a discussion on certain Cayman Islands income tax consequences of an investment in the securities of the Company. The discussion is a general summary of present law, which is subject to prospective and retroactive change. It is not intended as tax advice, does not consider any investor’s particular circumstances, and does not consider tax consequences other than those arising under Cayman Islands law.
Under Existing Cayman Islands Laws
Any payments of dividends and capital in respect of our securities will not be subject to taxation in the Cayman Islands and no withholding will be required on the payment of a dividend or capital to any holder of the securities nor will gains derived from the disposal of the securities be subject to Cayman Islands income or corporate tax. The Cayman Islands currently has no income, corporate, or capital gains tax and no estate duty, inheritance tax, or gift tax.
No stamp duty is payable in respect of the issue of our Ordinary Shares or on an instrument of transfer in respect of such shares. However, an instrument of transfer in respect of shares is stampable if executed in or brought into the Cayman Islands.
The Company has been incorporated under the laws of the Cayman Islands as an exempted company limited by shares and, as such, has applied for and received an undertaking from the Financial Secretary of the Cayman Islands in substantially the following form:
The Tax Concessions Act
(As Revised)
Undertaking as to Tax Concessions
In accordance with the provision of Section 6 of The Tax Concessions Act (As Revised), the following undertaking is hereby given to the Company:
1. That no law which is hereafter enacted in the Islands imposing any tax to be levied on profits, income, gains or appreciations shall apply to the Company or its operations; and
2. In addition, that no tax to be levied on profits, income, gains or appreciations or which is in the nature of estate duty or inheritance tax shall be payable:
2.1 On or in respect of the shares, debentures or other obligations of the Company; or
2.2 by way of the withholding in whole or part, of any relevant payment as defined in Section 6(3) of the Tax Concessions Act (As Revised).
These concessions shall be for a period of 30 years from the date hereof.
The Cayman Islands currently levy no taxes on individuals or corporations based upon profits, income, gains, or appreciations and there is no taxation in the nature of inheritance tax or estate duty. There are no other taxes likely to be material to the Company levied by the Government of the Cayman Islands save certain stamp duties which may be applicable, from time to time, on certain instruments executed in or brought into the jurisdiction of the Cayman Islands.
113
DESCRIPTION OF SECURITIES
Your rights as shareholders of Namib Minerals will be governed by the laws of the Cayman Islands and the Company Organizational Documents. We urge you to read the applicable provisions of Cayman Islands law and the Company Organizational Documents carefully and in their entirety because they describe your rights as a holder of Ordinary Shares.
The following description of the material terms of our securities includes a summary of specified provisions of the Company Organizational Documents. This description does not purport to be complete, and is subject, and qualified by reference, to the Company Organizational Documents. In this section, all capitalized terms used in this section are as defined in the Company Organizational Documents, unless elsewhere defined herein.
We are a Cayman Islands exempted company and our affairs are governed by the Company Organizational Documents, the Cayman Islands Companies Act and the common law of the Cayman Islands.
We are authorized to issue 500,000,000 ordinary shares, of a par value of $0.0001 each. We have one class of issued ordinary shares, the Ordinary Shares, which will have identical rights in all respects and shall rank pari passu with one another in all respects. As of March 25, 2026, there were 54,482,657 Ordinary Shares issued and outstanding and 18,576,677 Warrants issued and outstanding. The Company’s Ordinary Shares and Warrants are listed on Nasdaq under the ticker symbols “NAMM” and “NAMMW,” respectively.
Ordinary Shares
General
Holders of Ordinary Shares are entitled to one vote for each share held of record on all matters to be voted on by shareholders. Except as disclosed otherwise in this prospectus, none of the holders of Ordinary Shares have different voting rights from the other holders.
Unless specified in the Cayman Islands Companies Act, the Company Organizational Documents or applicable securities exchange rules, the affirmative vote of a majority of Ordinary Shares that are voted is required to approve any such matter voted on by our shareholders. Approval of certain actions will require a special resolution under Cayman Islands law and pursuant to the Company Organizational Documents. Such actions include amending the Company Organizational Documents and approving a statutory merger or consolidation with another company.
Holders of Ordinary Shares will not have any conversion, pre-emptive or other subscription rights and there will be no sinking fund or redemption provisions applicable to the Ordinary Shares. There is no cumulative voting with respect to the election of directors.
Dividends
Our shareholders are entitled to receive ratable dividends when, as and if declared by the Company Board out of funds legally available therefor.
The payment of cash dividends in the future, if any, will be at the discretion of the Company Board and will depend upon such factors as revenues, earnings levels, capital requirements, contractual restrictions, our overall financial condition, available distributable reserves and any other factors deemed relevant by the Company Board. Under Cayman Islands law, a Cayman Islands company may pay a dividend out of either profits (including retained earnings) or share premium, provided that in no circumstances may a dividend be paid if this would result in our being unable to pay our debts as they fall due in the ordinary course of its business.
Even if the Company Board decides to pay dividends, the form, frequency and amount will depend upon our future operations and earnings, capital requirements and surplus, general financial condition, contractual restrictions and other factors that the Company Board may deem relevant. In addition, the Company is a holding company and
114
depends on the receipt of dividends and other distributions from its majority-owned entities, controlled entities and corporate joint venture to pay dividends on Ordinary Shares. When making recommendations on the timing, amount and form of future dividends, if any, the Company Board will consider, among other things:
• our results of operations and cash flow;
• our expected financial performance and working capital needs;
• our future prospects;
• our capital expenditures and other investment plans;
• other investment and growth plans;
• dividend yields of comparable companies globally;
• restrictions on payment of dividend that may be imposed on us by financing arrangements; and
• the general economic and business conditions and other factors deemed relevant by the Company Board and statutory restrictions on the payment of dividends.
Liquidation
On a winding-up or other return of capital, subject to any special rights attaching to any other class of shares, holders of Ordinary Shares will be entitled to participate in any surplus assets in proportion to their shareholdings.
Transfers of Shares
Subject to the restrictions contained in the Company Organizational Documents, the Registration Rights and Lock-up Agreement and the rules or regulations of Nasdaq or any relevant securities laws, any shareholder may transfer all or any of his or her Ordinary Shares by an instrument of transfer in the usual or common form or in a form prescribed by Nasdaq or in any other form approved by our directors. However, our directors may, in their absolute discretion, decline to register any transfer of Ordinary Shares, subject to any applicable requirements imposed from time to time by the SEC and Nasdaq.
Register of Members
Under Cayman Islands law, we must keep a register of members and there shall be entered therein:
• the names and addresses of the members of the company, a statement of the shares held by each member, which:
• distinguishes each share by its number (so long as the share has a number),
• confirms the amount paid, or agreed to be considered as paid, on the shares of each member,
• confirms the number and category of shares held by each member, and
• confirms whether each relevant category of shares held by a member carries voting rights under the articles of association, and if so, whether such voting rights are conditional;
• the date on which the name of any person was entered on the register as a member; and
• the date on which any person ceased to be a member.
For these purposes, “voting rights” means rights conferred on shareholders, including the right to appoint or remove directors, in respect of their shares to vote at general meetings of the company on all or substantially all matters. A voting right is conditional where the voting right arises only in certain circumstances.
115
Under Cayman Islands law, the register of members of the Company is prima facie evidence of the matters set out therein (that is, the register of members will raise a presumption of fact on the matters referred to above unless rebutted) and a member registered in the register of members shall be deemed as a matter of Cayman Islands law to have legal title to the shares as set against its name in the register of members. Once our register of members has been updated, the shareholders recorded in the register of members shall be deemed to have legal title to the shares set against their name. However, there are certain limited circumstances where an application may be made to a Cayman Islands court for a determination on whether the register of members reflects the correct legal position. Further, the Cayman Islands court has the power to order that the register of members maintained by a company should be rectified where it considers that the register of members does not reflect the correct legal position. If an application for an order for rectification of the register of members were made in respect of our Ordinary Shares, then the validity of such shares may be subject to re-examination by a Cayman Islands court.
Calls on Shares and Forfeiture of Shares
The Company Board may from time to time make calls upon shareholders for any amounts unpaid on their Ordinary Shares. If a call or instalment of a call remains unpaid after it has become due and payable the Company Board may give to the person from whom it is due not less than fourteen clear days’ notice requiring payment of the amount unpaid together with any interest which may have accrued and any expenses incurred by us by reason of such non-payment. If the notice is not complied with, any Ordinary Shares in respect of which it was given may, before the payment required by the notice has been made, be forfeited by a resolution of the Company Board. Such forfeiture shall include all dividends, other distributions or other monies payable in respect of the forfeited Ordinary Share and not paid before the forfeiture.
Redemption and Repurchase of Shares
Subject to the provisions of the Cayman Islands Companies Act, we may issue shares that are to be redeemed or are liable to be redeemed at the option of the shareholder or us. The redemption of such shares will be effected in such manner and upon such other terms as our directors determine before the issue of the shares. We may also purchase our own shares (including any redeemable shares) on such terms and in such manner as the directors may determine and agree with the relevant shareholder(s).
Directors
Voting
The Company Organizational Documents provide that our directors may vote on resolutions relating to any contract or proposed contract or arrangement in which he/she is interested (and count as part of the quorum at any meetings where any such contract or proposed contract or arrangement is being considered) provided the nature of that interest has been disclosed to the other directors in accordance with the terms of the Company Organizational Documents. These provisions may be varied by a shareholders’ special resolution to make corresponding amendments to the Company Organizational Documents.
The above is also subject to (i) our directors’ ongoing adherence to their fiduciary duties (including to act in the best interests of the Company) and (ii) certain limited scenarios provided in the Company Organizational Documents.
Appointment and removal
The Company Organizational Documents provide that the number of directors shall be fixed by the directors from time to time, but shall not be less than one director. So long as the Ordinary Shares are listed on a Designated Stock Exchange (as defined in the Company Organizational Documents), the board of directors shall include such number of “independent directors” as the relevant rules applicable to the listing of any Ordinary Shares on the Designated Stock Exchange require, including applicable exemptions.
Our directors are to be divided into three (3) classes designated as Class I, Class II and Class III, respectively. At the 2026 annual general meeting, the term of office of the Class I directors shall expire and Class I directors are to be elected for a full term of three (3) years. At the 2027 annual general meeting, the term of office of the Class II directors shall expire and Class II directors shall be elected for a full term of three (3) years. At the 2028 annual
116
general, meeting, the term of office of the Class III directors shall expire and Class III directors are to be elected for a full term of three (3) years. At each succeeding annual general meeting, the directors are to be elected for a full term of three (3) years to succeed the directors of the class whose terms expire at such annual general meeting. No decrease in the number of directors constituting the Company Board is to shorten the term of any incumbent director.
Our directors by the affirmative vote of a simple majority of the remaining directors present and voting at a meeting of the directors, even if less than a quorum, shall have the power from time to time and at any time to appoint any person as a director to fill a casual vacancy on the board of directors or as an addition to the existing board of directors, subject to the Company Organizational Documents, the rules and regulations of the Designated Stock Exchange, the SEC and/or any other competent regulatory authority or otherwise under applicable law. A director appointed to fill a vacancy in accordance with the Company Organizational Documents shall be of the same class of director as the director he or she replaced and the term of such appointment shall terminate in accordance with that class of director. Any director so appointed shall hold office until the expiration of his or her term, until his or her successor shall have been duly elected and qualified or until his or her earlier death, resignation or removal.
We may by ordinary resolution appoint any person to be a director or may by ordinary resolution remove any director. The office of a director shall be vacated if: (a) the director gives notice in writing to the Company that they resign the office of director; or (b) the director is absent (for the avoidance of doubt, without being represented by proxy or an alternate director appointed by them) from three (3) consecutive meetings of the Company Board without special leave of absence from the directors, and the directors pass a resolution that they have by reason of such absence vacated office; or (c) the director dies, becomes bankrupt or makes any arrangement or composition with their creditors generally; or (d) is prohibited by applicable law or the Designated Stock Exchange, the SEC and/or any other competent regulatory authority or otherwise under applicable law from being a director; or (e) the director is found to be or becomes of unsound mind; or (f) all of the other directors (being not less than two (2) in number) determine that he or she should be removed as a director, either by a resolution passed by all of the other directors at a meeting of the directors duly convened and held in accordance with the Company Organizational Documents or by a resolution in writing signed by all of the other directors.
Warrants
The following is a description of our Warrants. We urge you to read the applicable provisions of the Warrant Agreement carefully and in its entirety because it governs the terms of the Warrants.
General Terms of the Warrants
Pursuant to the Warrant Agreement, each Warrant entitles the registered holder to purchase one Ordinary Share at a price of $11.50 per share, subject to certain adjustments. Pursuant to the Warrant Agreement, a Warrant holder may exercise its Warrants only for a whole number of Ordinary Shares. This means that only a whole Warrant may be exercised at any given time by a Warrant holder. Warrants will expire five years after the completion of the Business Combination, at 5:00 p.m., New York City time, or earlier upon redemption or liquidation.
No Warrant will be exercisable for cash or on a cashless basis, and we will not be obligated to issue any shares to holders seeking to exercise their Warrants, unless the issuance of the shares upon such exercise is registered or qualified under the securities laws of the state of the exercising holder, or an exemption from registration is available. In the event that the foregoing conditions are not satisfied with respect to a Warrant, the holder of such Warrant will not be entitled to exercise such Warrant and such Warrant may have no value and expire worthless.
We remain obligated to maintain a current prospectus relating to those Ordinary Shares until the Warrants expire or are redeemed.
Notwithstanding the above, if the Ordinary Shares are at the time of any exercise of a Warrant not listed on a national securities exchange such that they satisfy the definition of a “covered security” under Section 18(b)(1) of the Securities Act, we may, at our option, require holders of Warrants who exercise their Warrants to do so on a
117
“cashless basis” in accordance with Section 3(a)(9) of the Securities Act and, in the event we so elect, we will not be required to file or maintain in effect a registration statement, but will use our reasonable best efforts to qualify the shares under the applicable blue sky laws to the extent an exemption is not available.
We have agreed that, subject to applicable law, (i) any action, proceeding or claim against us arising out of or relating in any way to the Warrant Agreement will be brought and enforced in the courts of the State of New York in the Borough of Manhattan or the United States District Court for the Southern District of New York, and (ii) we irrevocably submit to such jurisdictions, which jurisdictions shall be the exclusive forums for any such action, proceeding or claim. We will waive any objection to such exclusive jurisdictions and that such courts represent inconvenient forums. This provision applies to claims under the Securities Act but does not apply to claims under the Exchange Act or any claim for which the federal district courts of the United States of America are the sole and exclusive forum.
Redemption of Warrants when the price per Ordinary Share equals or exceeds $18.00
We may call the Warrants for redemption:
• in whole and not in part;
• at a price of $0.01 per Warrant;
• upon not less than 30 days’ prior written notice of redemption, or the 30-day redemption period, to each Warrant holder; and
• if, and only if, the reported last reported sale price of the Ordinary Shares equal or exceed $18.00 per share (as adjusted for share subdivisions, share consolidations, share capitalizations, rights issuances, reorganizations, recapitalizations and the like) for any 20 trading days within a 30-trading day period ending on the third trading day prior to the date we send the notice of redemption to the Warrant holders.
If and when the Warrants become redeemable by the Company pursuant to the foregoing redemption method, the Company may exercise its redemption right even if the Company is unable to register or qualify the underlying securities for sale under all applicable state securities laws.
If the foregoing conditions are satisfied and the Company issues a notice of redemption of the Warrants, each Warrant holder will be entitled to exercise his, her, or its Warrant prior to the scheduled redemption date. However, the price of the Ordinary Shares may fall below the $18.00 redemption trigger price as well as the $11.50 Warrant exercise price after the redemption notice is issued.
Redemption of Warrants when the price per Ordinary Share equals or exceeds $10.00
The Company may call the Warrants for redemption:
• in whole and not in part;
• at $0.10 per Warrant upon a minimum of 30 days’ prior written notice of redemption provided that holders will be able to exercise their Warrants on a cashless basis prior to redemption and receive that number of shares determined by reference to the table below, based on the redemption date and the “fair market value” of an Ordinary Share except as otherwise described below; and
• if, and only if, the closing price of an Ordinary Share equals or exceeds $10.00 per share (as adjusted for adjustments to the number of shares issuable upon exercise or the exercise price of a Warrant as described under the heading “Description of Securities — Warrants — Anti-Dilution Adjustments”) on the trading day prior to the date on which we send the notice of redemption to the Warrant holders.
Beginning on the date the notice of redemption is given until the Warrants are redeemed or exercised, holders may elect to exercise their Warrants on a cashless basis. The numbers in the table below represent the number of Ordinary Shares that a Warrant holder will receive upon such cashless exercise in connection with a redemption by the Company pursuant to this redemption feature, based on the “fair market value” of an Ordinary Share on the corresponding redemption date (assuming holders elect to exercise their Warrants and such Warrants are not redeemed for $0.10 per Warrant), determined for these purposes based on volume weighted average price of an
118
Ordinary Share for the 10 trading days immediately following the date on which the notice of redemption is sent to the holders of Warrants, and the number of months that the corresponding redemption date precedes the expiration date of the Warrants, each as set forth in the table below. We will provide our Warrant holders with the final fair market value no later than one business day immediately following the 10 trading day period described above ends.
The share prices set forth in the column headings of the table below will be adjusted as of any date on which the number of shares issuable upon exercise of a Warrant or the exercise price of a Warrant is adjusted as set forth under the heading “Description of Securities — Warrants — Anti-dilution Adjustments” below. If the number of shares issuable upon exercise of a Warrant is adjusted, the adjusted share prices in the column headings will equal the share prices immediately prior to such adjustment, multiplied by a fraction, the numerator of which is the exercise price of the Warrant after such adjustment and the denominator of which is the exercise price of the Warrant immediately prior to such adjustment. In such an event, the number of shares in the table below shall be adjusted by multiplying such share amounts by a fraction, the numerator of which is the number of shares deliverable upon exercise of a Warrant immediately prior to such adjustment and the denominator of which is the number of shares deliverable upon exercise of a Warrant as so adjusted. If the exercise price of a Warrant is adjusted, (a) in the case of an adjustment pursuant to the fifth paragraph under the heading “Description of Securities — Warrants — Anti-dilution Adjustments” below, the adjusted share prices in the column headings will equal the unadjusted share price multiplied by a fraction, the numerator of which is the higher of the Market Value and the Newly Issued Price as set forth under the heading “Description of Securities — Warrants — Anti-dilution Adjustments” and the denominator of which is $10.00 and (b) in the case of an adjustment pursuant to the second paragraph under the heading “Description of Securities — Warrants — Anti-dilution Adjustments” below, the adjusted share prices in the column headings will equal the unadjusted share price less the decrease in the exercise price of a Warrant pursuant to such exercise price adjustment.
|
Redemption Date |
|
|||||||||||||||||
|
<10.00 |
11.00 |
12.00 |
13.00 |
14.00 |
15.00 |
16.00 |
17.00 |
>18.00 |
||||||||||
|
60 months |
0.261 |
0.281 |
0.297 |
0.311 |
0.324 |
0.337 |
0.348 |
0.358 |
0.361 |
|||||||||
|
57 months |
0.257 |
0.277 |
0.294 |
0.310 |
0.324 |
0.337 |
0.348 |
0.358 |
0.361 |
|||||||||
|
54 months |
0.252 |
0.272 |
0.291 |
0.307 |
0.322 |
0.335 |
0.347 |
0.357 |
0.361 |
|||||||||
|
51 months |
0.246 |
0.268 |
0.287 |
0.304 |
0.320 |
0.333 |
0.346 |
0.357 |
0.361 |
|||||||||
|
48 months |
0.241 |
0.263 |
0.283 |
0.301 |
0.317 |
0.332 |
0.344 |
0.356 |
0.361 |
|||||||||
|
45 months |
0.235 |
0.258 |
0.279 |
0.298 |
0.315 |
0.330 |
0.343 |
0.356 |
0.361 |
|||||||||
|
42 months |
0.228 |
0.252 |
0.274 |
0.294 |
0.312 |
0.328 |
0.342 |
0.355 |
0.361 |
|||||||||
|
39 months |
0.221 |
0.246 |
0.269 |
0.290 |
0.309 |
0.325 |
0.340 |
0.354 |
0.361 |
|||||||||
|
36 months |
0.213 |
0.239 |
0.263 |
0.285 |
0.305 |
0.323 |
0.339 |
0.353 |
0.361 |
|||||||||
|
33 months |
0.205 |
0.232 |
0.257 |
0.280 |
0.301 |
0.320 |
0.337 |
0.352 |
0.361 |
|||||||||
|
30 months |
0.196 |
0.224 |
0.250 |
0.274 |
0.297 |
0.316 |
0.335 |
0.351 |
0.361 |
|||||||||
|
27 months |
0.185 |
0.214 |
0.242 |
0.268 |
0.291 |
0.313 |
0.332 |
0.350 |
0.361 |
|||||||||
|
24 months |
0.173 |
0.204 |
0.233 |
0.260 |
0.285 |
0.308 |
0.329 |
0.348 |
0.361 |
|||||||||
|
21 months |
0.161 |
0.193 |
0.223 |
0.252 |
0.279 |
0.304 |
0.326 |
0.347 |
0.361 |
|||||||||
|
18 months |
0.146 |
0.179 |
0.211 |
0.242 |
0.271 |
0.298 |
0.322 |
0.345 |
0.361 |
|||||||||
|
15 months |
0.130 |
0.164 |
0.197 |
0.230 |
0.262 |
0.291 |
0.317 |
0.342 |
0.361 |
|||||||||
|
12 months |
0.111 |
0.146 |
0.181 |
0.216 |
0.250 |
0.282 |
0.312 |
0.339 |
0.361 |
|||||||||
|
9 months |
0.090 |
0.125 |
0.162 |
0.199 |
0.237 |
0.272 |
0.305 |
0.336 |
0.361 |
|||||||||
|
6 months |
0.065 |
0.099 |
0.137 |
0.178 |
0.219 |
0.259 |
0.296 |
0.331 |
0.361 |
|||||||||
|
3 months |
0.034 |
0.065 |
0.104 |
0.150 |
0.197 |
0.243 |
0.286 |
0.326 |
0.361 |
|||||||||
|
0 months |
— |
— |
0.042 |
0.115 |
0.179 |
0.233 |
0.281 |
0.323 |
0.361 |
|||||||||
The exact fair market value and redemption date may not be set forth in the table above, in which case, if the fair market value is between two values in the table or the redemption date is between two redemption dates in the table, the number of Ordinary Shares to be issued for each Warrant exercised will be determined by a straight-line interpolation between the number of shares set forth for the higher and lower fair market values and the earlier and later redemption dates, as applicable, based on a 365 or 366-day year, as applicable. For example, if the volume
119
weighted average price of an Ordinary Share for the 10 trading days ending on the third trading day prior to the date on which the notice of redemption is sent to the holders of the Warrants is $11.00 per share, and at such time there are 57 months until the expiration of the Warrants, holders may choose to, in connection with this redemption feature, exercise their Warrants for 0.277 Ordinary Shares for each whole Warrant. For an example where the exact fair market value and redemption date are not as set forth in the table above, if the volume weighted average price of an Ordinary Share for the 10 trading days ending on the third trading day prior to the date on which the notice of redemption is sent to the holders of the Warrants is $13.50 per share, and at such time there are 38 months until the expiration of the Warrants, holders may choose to, in connection with this redemption feature, exercise their Warrants for 0.298 Ordinary Shares for each whole Warrant. In no event will the Warrants be exercisable on a cashless basis in connection with this redemption feature for more than 0.361 Ordinary Shares per Warrant (subject to adjustment). Finally, as reflected in the table above, if the Warrants are out of the money and about to expire, they cannot be exercised on a cashless basis in connection with a redemption by us pursuant to this redemption feature, since they will not be exercisable for any Ordinary Shares.
This redemption feature is structured to allow for all of the outstanding Warrants to be redeemed when the Ordinary Shares are trading at or above $10.00 per share, which may be at a time when the trading price of Ordinary Shares is below the exercise price of the Warrants. This will provide the Company the ability to redeem the Warrants without the Warrants having to reach the $18.00 per share threshold set forth above under “Description of Securities — Warrants — Redemption of Warrants when the price Ordinary Share equals or exceeds $18.00.”
As stated above, we can redeem the Warrants when the Ordinary Shares are trading at a price starting at $10.00, which is below the exercise price of $11.50. If we choose to redeem the Warrants when the Ordinary Share is trading at a price below the exercise price of the Warrants, this could result in the Warrant holders receiving fewer Ordinary Shares than they would have received if they had chosen to wait to exercise their Warrants for Ordinary Shares if and when such Ordinary Share was trading at a price higher than the exercise price of $11.50.
No fractional Ordinary Shares will be issued upon exercise. If, upon exercise, a holder would be entitled to receive a fractional interest in a share, we will round down to the nearest whole number of the number of Ordinary Shares to be issued to the holder. If, at the time of redemption, the Warrants are exercisable for a security other than the Ordinary Share pursuant to the Warrant Agreement, the Warrants may be exercised for such security. At such time as the Warrants become exercisable for a security other than the Ordinary Shares, the Company (or surviving company) will use its commercially reasonable efforts to register under the Securities Act the security issuable upon the exercise of the Warrants.
Anti-dilution Adjustments
If the number of issued and outstanding Ordinary Shares is increased by a capitalization or share dividend payable in Ordinary Shares, or by a subdivision of Ordinary Shares or other similar event, then, on the effective date of such capitalization, share dividend, subdivision or similar event, the number of Ordinary Shares issuable on exercise of each Warrant will be increased in proportion to such increase in the issued and outstanding Ordinary Shares. A rights offering made to all or substantially all holders of Ordinary Shares entitling holders to purchase Ordinary Shares at a price less than the “historical fair market value” (as defined below) will be deemed a share dividend of a number of Ordinary Shares equal to the product of (i) the number of Ordinary Shares actually sold in such rights offering (or issuable under any other equity securities sold in such rights offering that are convertible into or exercisable for Ordinary Shares) multiplied by (ii) one minus the quotient of (x) the price per Ordinary Share paid in such rights offering divided by (y) the historical fair market value. For these purposes (i) if the rights offering is for securities convertible into or exercisable for Ordinary Shares, in determining the price payable for Ordinary Shares, there will be taken into account any consideration received for such rights, as well as any additional amount payable upon exercise or conversion and (ii) “historical fair market value” means the volume weighted average price of Ordinary Shares as reported during the 10-day trading period ending on the trading day prior to the first date on which the Ordinary Shares trade on the applicable exchange or in the applicable market, regular way, without the right to receive such rights.
120
In addition, if the Company, at any time while the Warrants are issued and outstanding and unexpired, pay to all or substantially all of the holders of Ordinary Shares a dividend or make a distribution in cash, securities or other assets to the holders of Ordinary Shares on account of such Ordinary Shares (or other securities into which the Warrants are convertible), other than (i) as described above or (ii) certain ordinary cash dividends, then the Warrant exercise price will be decreased, effective immediately after the effective date of such event, by the amount of cash and/or the fair market value of any securities or other assets paid on each Ordinary Share in respect of such event.
If the number of issued and outstanding Ordinary Shares is decreased by a consolidation, combination, reverse share subdivision, or reclassification of Ordinary Shares or other similar event, then, on the effective date of such consolidation, combination, reverse share subdivision reclassification, or similar event, the number of Ordinary Shares issuable on exercise of each Warrant will be decreased in proportion to such decrease in issued and outstanding Ordinary Shares.
Whenever the number of Ordinary Shares purchasable upon the exercise of the Warrants is adjusted, as described above, the Warrant exercise price will be adjusted by multiplying the Warrant exercise price immediately prior to such adjustment by a fraction (i) the numerator of which will be the number of Ordinary Shares purchasable upon the exercise of the Warrants immediately prior to such adjustment and (ii) the denominator of which will be the number of Ordinary Shares so purchasable immediately thereafter.
In case of any reclassification or reorganization of the issued and outstanding Ordinary Shares (other than those described above or that solely affects the par value of such Ordinary Shares), or in the case of any merger or consolidation of the Company with or into another corporation (other than a consolidation or merger in which the Company is the continuing corporation and that does not result in any reclassification or reorganization of the Company’s issued and outstanding Ordinary Shares), or in the case of any sale or conveyance to another corporation or entity of the assets or other property of the Company as an entirety or substantially as an entirety in connection with which the Company is dissolved, the holders of Warrants will thereafter have the right to purchase and receive, upon the basis and upon the terms and conditions specified in the Warrants and in lieu of Ordinary Shares immediately theretofore purchasable and receivable upon the exercise of the rights represented thereby, the kind and amount of shares, stock, or other securities or property (including cash) receivable upon such reclassification, reorganization, merger or consolidation, or upon a dissolution following any such sale or transfer, that the holder of Warrants would have received if such holder had exercised their Warrants immediately prior to such event. However, if such holders were entitled to exercise a right of election as to the kind or amount of securities, cash or other assets receivable upon such consolidation or merger, then the kind and amount of securities, cash or other assets for which each Warrant will become exercisable will be deemed to be the weighted average of the kind and amount received per share by such holders in such consolidation or merger that affirmatively make such election, and if a tender, exchange or redemption offer has been made to and accepted by such holders under circumstances in which, upon completion of such tender or exchange offer, the maker thereof, together with members of any group (within the meaning of Rule 13d-5(b)(1) under the Exchange Act) of which such maker is a part, and together with any affiliate or associate of such maker (within the meaning of Rule 12b-2 under the Exchange Act) and any members of any such group of which any such affiliate or associate is a part, own beneficially (within the meaning of Rule 13d-3 under the Exchange Act) more than 50% of the issued and outstanding Ordinary Shares, the holder of a Warrant will be entitled to receive the highest amount of cash, securities or other property to which such holder would actually have been entitled as a shareholder if such Warrant holder had exercised the Warrant prior to the expiration of such tender or exchange offer, accepted such offer and all of the Ordinary Shares held by such holder had been purchased pursuant to such tender or exchange offer, subject to adjustment (from and after the consummation of such tender or exchange offer) as nearly equivalent as possible to the adjustments provided for in the Warrant Agreement. Additionally, if less than 70% of the consideration receivable by the holders of Ordinary Shares in such a transaction is payable in the form of Ordinary Shares in the successor entity that is listed for trading on a national securities exchange or is quoted in an established over-the-counter market, or is to be so listed for trading or quoted immediately following such event, and if the registered holder of the Warrant properly exercises the Warrant within 30 days following public disclosure of such transaction, the Warrant exercise price will be reduced as specified in the Warrant Agreement based on the per share consideration minus Black-Scholes Warrant Value (as defined in the Warrant Agreement) of the Warrant.
121
You should review a copy of the Warrant Agreement, which will be filed as an exhibit to the registration statement of which this prospectus is a part, for a complete description of the terms and conditions applicable to the Warrants. The Warrant Agreement provides that the terms of the Warrants may be amended without the consent of any holder to cure any ambiguity or correct any defective provision, but requires the approval by the holders of at least a majority of the then issued and outstanding Warrants to make any change that adversely affects the interests of the registered holders of Warrants.
The Warrants may be exercised upon surrender of the warrant certificate on or prior to the expiration date at the offices of the warrant agent, with the exercise form on the reverse side of the warrant certificate completed and executed as indicated, accompanied by full payment of the exercise price (or on a cashless basis, if applicable), by certified or official bank check payable to the Company, for the number of Warrants being exercised. The Warrant holders do not have the rights or privileges of holders of Ordinary Shares and any voting rights until they exercise their Warrants and receive Ordinary Shares. After the issuance of Ordinary Shares upon exercise of the Warrants, each holder will be entitled to one vote for each Ordinary Share held of record on all matters to be voted on by shareholders.
Warrants may be exercised only for a whole number of Ordinary Shares. No fractional shares will be issued upon exercise of the Warrants. If, upon exercise of the Warrants, a holder would be entitled to receive a fractional interest in a share, the Company will, upon exercise, round down to the nearest whole number the number of Ordinary Shares to be issued to the Warrant holder.
Transfer Agent
The transfer agent for our Ordinary Shares and Warrants is Continental.
We will indemnify Continental in its roles as transfer agent, its agents and each of its shareholders, directors, officers and employees against all liabilities, including judgments, costs and reasonable counsel fees that may arise out of acts performed or omitted for its activities in that capacity, except for any liability due to any gross negligence, willful misconduct or bad faith of the indemnified person or entity.
Cayman Islands Corporate Law
Cayman Islands companies are governed by the Cayman Islands Companies Act. The Cayman Islands Companies Act is modeled on English law but does not follow recent English law statutory enactments and differs from laws applicable to United States corporations and their shareholders. Set forth below is a summary of certain material provisions of the Cayman Islands Companies Act applicable to the Company.
Mergers and Similar Arrangements
In certain circumstances, the Cayman Islands Companies Act allows for mergers or consolidations between two Cayman Islands companies, or between a Cayman Islands exempted company and a company incorporated in another jurisdiction (provided that is facilitated by the laws of that other jurisdiction).
Where the merger or consolidation is between two Cayman Islands companies, the directors of each company must approve a written plan of merger or consolidation containing certain prescribed information. That plan or merger or consolidation must then be authorized by either (i) a special resolution (usually a majority of 662/3% in value of the voting shares that attend and vote at a general meeting) of the shareholders of each company or (ii) such other authorization, if any, as may be specified in such constituent company’s articles of association. No shareholder resolution is required for a merger between a parent company (i.e., a company that owns at least 90% of the issued shares of each class in a subsidiary company) and its subsidiary company.
The consent of each holder of a fixed or floating security interest of a constituent company must be obtained, unless the court waives such requirement. If the Registrar of Companies of the Cayman Islands is satisfied that the requirements of the Cayman Islands Companies Act (which includes certain other formalities) have been complied with, the Registrar of Companies of the Cayman Islands will register the plan of merger or consolidation.
Where the merger or consolidation involves a foreign company, the procedure is similar, save that with respect to the foreign company, the directors of the Cayman Islands exempted company are required to make a declaration to the effect that, having made due enquiry, they are of the opinion that the requirements set out
122
below have been met: (i) that the merger or consolidation is permitted or not prohibited by the constitutional documents of the foreign company and by the laws of the jurisdiction in which the foreign company is incorporated, and that those laws and any requirements of those constitutional documents have been or will be complied with; (ii) that no petition or other similar proceeding has been filed and remains outstanding or order made or resolution adopted to wind up or liquidate the foreign company in any jurisdictions; (iii) that no receiver, trustee, administrator or other similar person has been appointed in any jurisdiction and is acting in respect of the foreign company, its affairs or its property or any part thereof; and (iv) that no scheme, order, compromise or other similar arrangement has been entered into or made in any jurisdiction whereby the rights of creditors of the foreign company are and continue to be suspended or restricted.
Where the surviving company is the Cayman Islands exempted company, the directors of the Cayman Islands exempted company are further required to make a declaration to the effect that, having made due enquiry, they are of the opinion that the requirements set out below have been met: (i) that the foreign company is able to pay its debts as they fall due and that the merger or consolidation is bona fide and not intended to defraud unsecured creditors of the foreign company; (ii) that in respect of the transfer of any security interest granted by the foreign company to the surviving or consolidated company (a) consent or approval to the transfer has been obtained, released or waived; (b) the transfer is permitted by and has been approved in accordance with the constitutional documents of the foreign company; and (c) the laws of the jurisdiction of the foreign company with respect to the transfer have been or will be complied with; (iii) that the foreign company will, upon the merger or consolidation becoming effective, cease to be incorporated, registered or exist under the laws of the relevant foreign jurisdiction; and (iv) that there is no other reason why it would be against the public interest to permit the merger or consolidation.
Where the above procedures are adopted, the Cayman Islands Companies Act provides for a right of dissenting shareholders to be paid a payment of the fair value of his shares upon their dissenting to the merger or consolidation if they follow a prescribed procedure. In essence, that procedure is as follows: (i) the shareholder must give his written objection to the merger or consolidation to the constituent company before the vote on the merger or consolidation, including a statement that the shareholder proposes to demand payment for his shares if the merger or consolidation is authorized by the vote; (ii) within 20 days following the date on which the merger or consolidation is approved by the shareholders, the constituent company must give written notice to each shareholder who made a written objection; (iii) a shareholder must within 20 days following receipt of such notice from the constituent company, give the constituent company a written notice of his intention to dissent including, among other details, a demand for payment of the fair value of his shares; (iv) within seven days following the date of the expiration of the period set out in paragraph (ii) above or seven days following the date on which the plan of merger or consolidation is filed, whichever is later, the constituent company, the surviving company or the consolidated company must make a written offer to each dissenting shareholder to purchase his shares at a price that the company determines is the fair value and if the company and the shareholder agree the price within 30 days following the date on which the offer was made, the company must pay the shareholder such amount; and (v) if the company and the shareholder fail to agree a price within such 30 day period, within 20 days following the date on which such 30 day period expires, the company (and any dissenting shareholder) must file a petition with the Cayman Islands courts to determine the fair value and such petition must be accompanied by a list of the names and addresses of the dissenting shareholders with whom agreements as to the fair value of their shares have not been reached by the company. At the hearing of that petition, the court has the power to determine the fair value of the shares together with a fair rate of interest, if any, to be paid by the company upon the amount determined to be the fair value. Any dissenting shareholder whose name appears on the list filed by the company may participate fully in all proceedings until the determination of fair value is reached. These rights of a dissenting shareholder are not available in certain circumstances, for example, to dissenters holding shares of any class in respect of which an open market exists on a recognized stock exchange or recognized interdealer quotation system at the relevant date or where the consideration for such shares to be contributed are shares of any company listed on a national securities exchange or shares of the surviving or consolidated company.
Moreover, Cayman Islands law also has separate statutory provisions that facilitate the reconstruction or amalgamation of companies in certain circumstances, and schemes of arrangement will generally be more suited for complex mergers or other transactions involving widely held companies, commonly referred to in the Cayman Islands as a “scheme of arrangement” which may be tantamount to a merger. In the event that a merger was sought pursuant to a scheme of arrangement (the procedures for which are more rigorous and take longer to complete than the procedures typically required to consummate a merger in the United States), the arrangement in question must
123
be approved by a majority in number of each class of shareholders and creditors with whom the arrangement is to be made and who must in addition represent three-fourths in value of each such class of shareholders or creditors, as the case may be, that are present and voting either in person or by proxy at an annual general meeting, or extraordinary general meeting summoned for that purpose. The convening of the meetings and subsequently the terms of the arrangement must be sanctioned by the Cayman Islands courts. While a dissenting shareholder would have the right to express to the court the view that the transaction should not be approved, the court can be expected to approve the arrangement if it satisfies itself that:
• the company is not proposing to act illegally or beyond the scope of its corporate authority and the statutory provisions as to majority vote have been complied with;
• the shareholders have been fairly represented at the meeting in question;
• the arrangement is such as a businessman would reasonably approve; and
• the arrangement is not one that would more properly be sanctioned under some other provision of the Cayman Islands Companies Act or that would amount to a “fraud on the minority.”
If a scheme of arrangement or takeover offer (as described below) is approved, any dissenting shareholder would have no rights comparable to appraisal rights (providing rights to receive payment in cash for the judicially determined value of the shares), which would otherwise ordinarily be available to dissenting shareholders of United States corporations.
Squeeze-Out Provisions
When a takeover offer is made and accepted by holders of 90% of the shares to whom the offer relates within four months, the offeror may, within a two-month period, require the holders of the remaining shares to transfer such shares on the terms of the offer. An objection can be made to the Cayman Islands courts, but this is unlikely to succeed unless there is evidence of fraud, bad faith, collusion or inequitable treatment of the shareholders.
Further, transactions similar to a merger, reconstruction and/or an amalgamation may in some circumstances be achieved through means other than these statutory provisions, such as a share capital exchange, asset acquisition or control, or through contractual arrangements of an operating business.
Shareholders Suits
Derivative actions have been brought in the Cayman Islands courts, and the Cayman Islands courts have confirmed the availability for such actions. In most cases, the Company will be the proper plaintiff in any claim based on a breach of duty owed to the Company, and a claim against (for example) the Company’s officers or directors usually may not be brought by a shareholder. However, based both on Cayman Islands authorities and on English authorities, which would in all likelihood be of persuasive authority and be applied by a court in the Cayman Islands, exceptions to the foregoing principle apply in circumstances in which:
• a company is acting, or proposing to act, illegally or beyond the scope of its authority;
• the act complained of, although not beyond the scope of the authority, could be effected if duly authorized by more than the number of votes which have actually been obtained; or
• those who control the company are perpetrating a “fraud on the minority.”
• A shareholder may have a direct right of action against us where the individual rights of that shareholder have been infringed or are about to be infringed.
Special Considerations for Exempted Companies
The Company is an exempted company with limited liability (meaning the Company’s public shareholders have no liability, as members of the Company, for liabilities of the Company over and above the amount paid for their shares) under the Cayman Islands Companies Act. The Cayman Islands Companies Act distinguishes between ordinary resident companies and exempted companies. Any company that is registered in the Cayman Islands but
124
conducts business mainly outside of the Cayman Islands may apply to be registered as an exempted company. The requirements for an exempted company are essentially the same as for an ordinary company except for the exemptions and privileges listed below:
• an exempted company does not have to file an annual return of its shareholders with the Registrar of Companies of the Cayman Islands;
• an exempted company’s register of members is not open to inspection;
• an exempted company does not have to hold an annual general meeting;
• an exempted company may issue shares with no par value;
• an exempted company may obtain an undertaking against the imposition of any future taxation (such undertakings are usually given for 20 years in the first instance);
• an exempted company may register by way of continuation in another jurisdiction and be deregistered in the Cayman Islands;
• an exempted company may register as a limited duration company; and
• an exempted company may register as a segregated portfolio company.
“Limited liability” means that the liability of each shareholder is limited to the amount unpaid by the shareholder on the shares of the company (except in exceptional circumstances, such as involving fraud, the establishment of an agency relationship or an illegal or improper purpose or other circumstances in which a court may be prepared to pierce or lift the corporate veil).
Indemnification of Directors and Executive Officers and Limitation of Liability
Cayman Islands law does not limit the extent to which a company’s articles of association may provide for indemnification of officers and directors, except to the extent any such provision may be held by the Cayman Islands courts to be contrary to public policy, such as to provide indemnification against civil fraud or the consequences of committing a crime. The Company Organizational Documents permits indemnification of officers and directors for any liability, action, proceeding, claim, demand, costs, damages or expenses, including legal expenses, incurred in their capacities as such unless such liability (if any) arises from dishonesty, willful default or fraud which may attach to such directors or officers. In addition, the Company may enter into indemnification agreements with the Company’s directors and executive officers that will provide such persons with additional indemnification beyond that provided in the Company Organizational Documents.
Insofar as indemnification for liabilities arising under the Securities Act may be permitted to the Company’s directors, officers or persons controlling the Company under the foregoing provisions, the Company has been informed that, in the opinion of the SEC, such indemnification is against public policy as expressed in the Securities Act and is therefore unenforceable.
Directors’ Fiduciary Duties
Under Cayman Islands law, directors and officers owe the following fiduciary duties:
• duty to act in good faith in what the director or officer believes to be in the best interests of the company as a whole;
• duty to exercise powers for the purposes for which those powers were conferred and not for a collateral purpose;
• directors should not improperly fetter the exercise of future discretion;
• duty to exercise powers fairly as between different sections of shareholders;
125
• duty not to put themselves in a position in which there is a conflict between their duty to the company and their personal interests; and
• duty to exercise independent judgment.
In addition to the above, directors also owe a duty of care which is not fiduciary in nature. This duty has been defined as a requirement to act as a reasonably diligent person having both the general knowledge, skill and experience that may reasonably be expected of a person carrying out the same functions as are carried out by that director in relation to the company and the general knowledge skill and experience of that director.
As set out above, directors have a duty not to put themselves in a position of conflict and this includes a duty not to engage in self-dealing, or to otherwise benefit as a result of their position. However, in some instances what would otherwise be a breach of this duty can be forgiven and/or authorized in advance by the shareholders provided that there is full disclosure by the directors. This can be done by way of permission granted in the amended and restated memorandum and articles of association or alternatively by shareholder approval at general meetings.
General Meetings of Shareholders
As a Cayman Islands exempted company, the Company is not obliged by law to call shareholders’ annual general meetings. The Company may (unless required by applicable securities exchange rules, as applicable under the Securities Act and/or all other applicable laws, rules and regulations) in accordance with the Company Organizational Documents hold a general meeting each year as its annual general meeting. The Company board of directors may also convene a general meeting at such time and place as they may determine. At least five clear days’ notice shall be given for any general meeting. or applicable securities exchange rules.
Certain Anti-Takeover Provisions of the Company’s Second Amended and Restated Memorandum and Articles of Association
The Company’s authorized but unissued ordinary shares are available for future issuances without shareholder approval and could be utilized for a variety of corporate purposes, including future offerings to raise additional capital, acquisitions and employee benefit plans. The existence of authorized but unissued and unreserved ordinary shares could render more difficult or discourage an attempt to obtain control of the Company by means of a proxy contest, tender offer, merger or otherwise.
Anti-Money Laundering — Cayman Islands
In order to comply with legislation or regulations aimed at the prevention of money laundering, we may be required to adopt and maintain anti-money laundering procedures, and may require subscribers to provide evidence to verify their identity. Where permitted, and subject to certain conditions, we may also delegate the maintenance of our anti-money laundering procedures (including the acquisition of due diligence information) to a suitable person.
We reserve the right to request such information as is necessary to verify the identity of a subscriber. In the event of delay or failure on the part of the subscriber in producing any information required for verification purposes, we may refuse to accept the application, in which case any funds received will be returned without interest to the account from which they were originally debited.
We also reserve the right to refuse to make any redemption payment to a shareholder if directors or officers suspect or are advised that the payment of redemption proceeds to such shareholder might result in a breach of applicable anti-money laundering or other laws or regulations by any person in any relevant jurisdiction, or if such refusal is considered necessary or appropriate to ensure compliance with any such laws or regulations in any applicable jurisdiction.
If any person in the Cayman Islands knows or suspects or has reasonable grounds for knowing or suspecting that another person is engaged in criminal conduct or money laundering or is involved with terrorism or terrorist financing and property and the information for that knowledge or suspicion came to their attention in the course of business in the regulated sector, or other trade, profession, business or employment, the person will be required to report such knowledge or suspicion to (i) the Financial Reporting Authority of the Cayman Islands, pursuant to the Proceeds of Crime Act (As Revised) of the Cayman Islands if the disclosure relates to criminal conduct or money
126
laundering, or (ii) a police officer of the rank of constable or higher, or the Financial Reporting Authority, pursuant to the Terrorism Act (As Revised) of the Cayman Islands, if the disclosure relates to involvement with terrorism or terrorist financing and property. Such a report shall not be treated as a breach of confidence or of any restriction upon the disclosure of information imposed by any enactment or otherwise.
Data Protection — Cayman Islands
The Company has certain duties under the Data Protection Act (As Revised) of the Cayman Islands (the “DPL”) based on internationally accepted principles of data privacy.
Prospective investors should note that, by virtue of making investments in the Company’s securities and the associated interactions with the Company and its affiliates and/or the Company’s third party service providers, or by virtue of providing the Company with personal data on individuals connected with the investor (including but not limited to directors, trustees, employees, representatives, shareholders, investors, clients, beneficial owners or agents) such individuals will be providing the Company and its affiliates and/or third party service providers with certain personal data within the meaning of the DPL.
The Company shall act as a data controller in respect of this personal data and its affiliates and/or third party service providers, will normally act as data processors. Where those affiliates or third party service providers make their own decisions regarding the processing of personal data they hold, in certain circumstances they may also be data controllers in their own right under the DPL.
By investing in the Company’s securities, a holder of securities, or a holder, shall be deemed to have read in detail and understood the Privacy Notice set out below. This Notice provides an outline of the holder’s data protection rights and obligations as they relate to their investment.
Oversight and enforcement of the DPL is the responsibility of the Cayman Islands’ Ombudsman. Breach of the DPL by the Company could lead to enforcement action by the Ombudsman, including the imposition of remediation orders, financial penalties or referral for criminal prosecution. The Ombudsman’s address is set out at the end of the Notice.
Privacy Notice
Introduction
This privacy notice puts the Company’s shareholders on notice that through your investment in the Company you will provide the Company with certain personal information which constitutes personal data within the meaning of the DPL (“personal data”). In the following discussion, the “Company” refers to the Company and the Company’s affiliates and/or delegates, except where the context requires otherwise.
Investor Data
The Company will collect, use, disclose, retain and secure personal data to the extent reasonably required only and within the parameters that could be reasonably expected during the normal course of business. The Company will only process, disclose, transfer or retain personal data to the extent legitimately required to conduct the Company’s activities of on an ongoing basis or to comply with legal and regulatory obligations to which the Company is subject. the Company will only transfer personal data in accordance with the requirements of the DPL, and will apply appropriate technical and organizational information security measures designed to protect against unauthorized or unlawful processing of the personal data and against the accidental loss, destruction or damage to the personal data.
In the Company’s use of this personal data, the Company will be characterized as a “data controller” for the purposes of the DPL, while the Company’s affiliates and service providers who may receive this personal data from the Company in the conduct of the Company’s activities may either act as the Company’s “data processors” for the purposes of the DPL or may process personal information for their own lawful purposes in connection with services provided to the Company.
127
The Company may also obtain personal data from other public sources. Personal data includes, without limitation, the following information relating to a shareholder and/or any individuals connected with a shareholder as an investor: name, residential address, email address, contact details, corporate contact information, signature, nationality, place of birth, date of birth, tax identification, credit history, correspondence records, passport number, bank account details, source of funds details and details relating to the shareholder’s investment activity.
Who this Affects
If you are a natural person, this will affect you directly. If you are a corporate investor (including, for these purposes, legal arrangements such as trusts or exempted limited partnerships) that provides the Company with personal data on individuals connected to you for any reason in relation your investment in the Company, this will be relevant for those individuals and you should transmit the content of this Privacy Notice to such individuals or otherwise advise them of its content.
How The Company May Use a Shareholder’s Personal Data
The Company, as the data controller, may collect, store and use personal data for lawful purposes, including, in particular:
• where this is necessary for the performance of the Company’s rights and obligations under any purchase agreements;
• where this is necessary for compliance with a legal and regulatory obligation to which the Company is subject (such as compliance with anti-money laundering and FATCA/CRS requirements); and/or
• where this is necessary for the purposes of the Company’s legitimate interests and such interests are not overridden by your interests, fundamental rights or freedoms.
Should the Company wish to use personal data for other specific purposes (including, if applicable, any purpose that requires your consent), the Company will contact you.
Why The Company May Transfer Your Personal Data
In certain circumstances the Company may be legally obliged to share personal data and other information with respect to your shareholding with the relevant regulatory authorities such as the Cayman Islands Monetary Authority or the Tax Information Authority. They, in turn, may exchange this information with foreign authorities, including tax authorities.
The Company anticipates disclosing personal data to persons who provide services to the Company and their respective affiliates (which may include certain entities located outside the United States, the Cayman Islands or the European Economic Area), who will process your personal data on the Company’s behalf.
The Data Protection Measures The Company Takes
Any transfer of personal data by the Company or the Company’s duly authorized affiliates and/or delegates outside of the Cayman Islands shall be in accordance with the requirements of the DPL.
The Company and the Company’s duly authorized affiliates and/or delegates shall apply appropriate technical and organizational information security measures designed to protect against unauthorized or unlawful processing of personal data, and against accidental loss or destruction of, or damage to, personal data.
The Company shall notify you of any personal data breach that is reasonably likely to result in a risk to your interests, fundamental rights or freedoms or those data subjects to whom the relevant personal data relates.
128
SECURITY OWNERSHIP OF CERTAIN BENEFICIAL OWNERS AND MANAGEMENT
The following table sets forth information relating to the beneficial ownership of Ordinary Shares as of March 25, 2026 by:
• each person, or group of affiliated persons, known by us to beneficially own more than 5% of outstanding Ordinary Shares;
• each of our directors;
• each of our executive officers; and
• all of our directors and executive officers as a group.
Except as otherwise noted herein, the number and percentage of Ordinary Shares beneficially owned is determined in accordance with Rule 13d-3 of the Exchange Act, and the information is not necessarily indicative of beneficial ownership for any other purpose. Under such rule, beneficial ownership includes any Ordinary Shares as to which the holder has sole or shared voting power or investment power and also any Ordinary Shares which the holder has the right to acquire within 60 days of March 25, 2026 through the exercise of any option, warrant or any other right. These shares were not deemed outstanding, however, for the purpose of computing the percentage ownership of any other person or entity.
The percentage of Ordinary Shares beneficially owned is computed on the basis of 54,482,657 Ordinary Shares outstanding on March 25, 2026.
Unless otherwise indicated, we believe that all persons named in the table below have sole voting and investment power with respect to all Ordinary Shares beneficially owned by them.
Unless otherwise noted, the business address of each of our directors and officers is Namib Minerals, Suite 210, 2nd Floor, Windward III, Regatta Office Park, P.O. Box 500, Grand Cayman, Cayman Islands, KY1-1106.
|
Name and Address of Beneficial Owner |
Amount and |
Approximate |
|||
|
Tulani Sikwila(1) |
4,838,126 |
8.9 |
% |
||
|
Siphesihle Mchunu(2) |
977,399 |
1.8 |
% |
||
|
Ibrahima Tall(3) |
2,384,856 |
4.4 |
% |
||
|
Dennis A. Johnson(4) |
38,594 |
* |
|
||
|
Tito Botelho Martins Júnior(5) |
38,344 |
* |
|
||
|
All directors and executive officers as a group (5 individuals) |
8,277,319 |
15.2 |
% |
||
|
Five Percent Holders: |
|
||||
|
Tulani Sikwila(1) |
4,838,126 |
8.9 |
% |
||
|
Mzilikazi Godfrey Khumalo(6) |
4,886,996 |
9.0 |
% |
||
|
Hennessy Capital Partners VI LLC(7) |
5,054,217 |
9.3 |
% |
||
|
The Southern SelliBen Trust(8) |
34,208,973 |
62.8 |
% |
||
____________
Notes: —
* Less than 1%.
(1) Represents Ordinary Shares held by The NostroHeritage Foundation, and Tulani Sikwila exercises sole voting and dispositive power over such securities.
(2) Represents Ordinary Shares held by The Red Richmond Foundation, and Siphesihle Mchunu exercises sole voting and dispositive power over such securities.
(3) Represents (i) 1,954,798 Ordinary Shares held by The South Rivers Foundation, which Ibrahima Tall exercises sole voting and dispositive power over such securities, (ii) 174,336 Ordinary Shares that will be issued directly to Mr. Tall as a result of his RSUs that vested upon his resignation as CEO pursuant to the related Settlement Agreement (the “Settlement Agreement”) with the Company, and (iii) 255,722 Ordinary shares that will be issued to Ibrahima Tall pursuant to the Settlement Agreement.
(4) Represents 38,344 Ordinary Shares that will be issued pursuant to his RSUs that vested on April 1, 2026 and 250 Ordinary Shares that are held directly.
129
(5) Represents 38,344 Ordinary Shares that will be issued pursuant to his RSUs that vested on April 1, 2026.
(6) Based on information provided in a Schedule 13D filed with the SEC on June 11, 2025. The address of Mr. Khumalo is Francois-Bellot 6, 1206 Geneva, Switzerland.
(7) Based on information provided in a Schedule 13G/A filed with the SEC on November 14, 2025. The Schedule 13G/A reports an aggregate of (i) 2,595,000 Ordinary Shares held by Hennessy Capital Partners VI LLC, (ii) 2,359,217 Ordinary Shares that Hennessy Capital Partners VI LLC has the right to acquire upon exercise of Warrants and (iii) 100,000 Ordinary Shares Hennessy Capital Group LLC has the right to acquire upon the exercise of Warrants. According to the Schedule 13G/A, the holder’s business address is 195 US Hwy 50, Suite 207, Zephyr Cove, NV 89448.
(8) Based on information provided in a Schedule 13D/A filed with the SEC on July 29, 2025 and information provided to us. The address of the Southern SelliBen Trust (the “Trust”) is Cone Marshall Limited, Floor 3, 32 Mahuhu Crescent, Auckland Central, New Zealand. 1,676,240 of the Ordinary Shares held by the Trust are held for the benefit of a creditor, and the Trust is prohibited from disposing of the shares but is generally not limited from voting such securities. The voting and dispositive power with respect to the securities held by the Trust is exercised by its trustee, Three Rivers PTC Limited (“Three Rivers”). Decisions at Three Rivers are made by majority decisions of a board of four directors which includes Tulani Sikwila, our Chief Executive Officer, Chief Financial Officer and Director. None of the directors of Three Rivers has beneficial ownership (within the meaning of Rule 13d-3 promulgated under the Exchange Act) of any securities held by the Trust. Mr. Sikwila, in his role as a director of Three Rivers, disclaims any beneficial ownership of the securities held by the Trust. The assets held by the Trust are held for the benefit of Mr. Khumalo’s family. Mr. Khumalo is the settlor of the Trust but has no voting or dispositive power over the securities held by the Trust.
Each outstanding Ordinary Share is entitled to one vote for each share held of record on all matters to be voted on by shareholders. None of the holders of Ordinary Shares have different voting rights from the other holders. We are not aware of any arrangements, the operation of which may, at a subsequent date, result in a change of control.
As of March 25, 2026, we had 14 shareholders of record, seven of whom were located in the United States. One of the shareholders located in the United States was Cede & Co., a nominee of The Depository Trust Company, which held in aggregate approximately 9.5 million Ordinary Shares, representing approximately 17.4% of our outstanding Ordinary Shares. The other shareholders located in the United States held approximately 2.7 million Ordinary Shares in aggregate, representing approximately 5.0% of our outstanding Ordinary Shares.
The Trust owns approximately 62.8% of our outstanding Ordinary Shares representing approximately 62.8% of Namib Minerals’ total voting power, as indicated in the beneficial ownership table above.
130
SELLING SHAREHOLDER
This prospectus relates to the resale by the Selling Shareholder from time to time of up to 1,750,000 Ordinary Shares that may be issued under the Promissory Note. The Selling Shareholder is not obligated to resell its Ordinary Shares pursuant to the registration statement of which this prospectus forms a part. Pursuant to the terms of the Promissory Note, the Selling Shareholder is restricted from selling such Ordinary Shares on any Trading Day in an amount greater than 5% of the Trading Volume, without the prior written consent of the Company.
Subject to the foregoing volume restrictions, the Selling Shareholder may from time to time offer and sell any or all of the Ordinary Shares set forth below pursuant to this prospectus and any accompanying prospectus supplement. When we refer to the “Selling Shareholder” in this prospectus, we mean Cohen & Company Securities, LLC, and the permitted pledgees, donees, transferees, assignees, successors, distributees and others who later come to hold any of the Selling Shareholder’s interest in the Ordinary Shares other than through a public sale.
The following table sets forth, as of the date of this prospectus, the name of the Selling Shareholder, the aggregate number of Ordinary Shares beneficially held immediately prior to this offering, the number of Ordinary Shares that may be sold by the Selling Shareholder under this prospectus and the number of Ordinary Shares that the Selling Shareholder will beneficially own after this offering assuming that all applicable securities are sold in this offering.
In the table below, the percentage ownership prior to the offering is based on 53,677,429 Ordinary Shares outstanding at the time the offering commenced and the percentage ownership following the offering is based on 54,482,657 Ordinary Shares outstanding as of March 25, 2026. The table also assumes that all of the Resale Shares have been issued. In addition, for purposes of the table below, the Company has assumed (i) no Warrants were exercised, (ii) the Selling Shareholder will not acquire beneficial ownership of any additional securities during the offering, and (iii) no Earnout Shares have been issued. In addition, we assume that the Selling Shareholder has not sold, transferred or otherwise disposed of, our securities.
We cannot advise you as to whether the Selling Shareholder will in fact sell any or all of the Resale Shares. In addition, the Selling Shareholder may sell, transfer or otherwise dispose of, at any time and from time to time, Resale Shares in transactions exempt from the registration requirements of the Securities Act.
|
Ordinary Shares |
|||||||||||
|
Name |
Number |
% |
Maximum |
Number |
% |
||||||
|
Cohen & Company Securities, LLC(1) |
1,750,000 |
3.2 |
% |
1,750,000 |
— |
— |
|||||
____________
(1) The number of beneficially owned Ordinary Shares assumes that 1,750,000 Resale Shares have been issued to the Selling Shareholder pursuant to the Promissory Note. The business address of the Selling Shareholder is 2929 Arch Street, Suite 1703, Philadelphia, PA. 19104. The person with voting or investment control of the securities held by the Selling Shareholder is Jerry Serowik, a Senior Managing Director of the Selling Shareholder. Consequently, Mr. Serowik may be deemed to be the beneficial owner of the Ordinary Shares held by the Selling Shareholder. Mr. Serowik disclaims beneficial ownership over any securities held by the Selling Shareholder in which he does not have any pecuniary interest. The Selling Shareholder is a registered broker dealer and may be deemed to be an “underwriter” within the meaning of the Securities Act. The Selling Shareholder has informed the Company that it does not have any written or oral agreement or understanding, directly or indirectly, with any person to distribute any Ordinary Shares.
131
PLAN OF DISTRIBUTION
We are registering the possible resale by the Selling Shareholder of up to 1,750,000 Ordinary Shares that may be issued under the Promissory Note. The prospectus also covers any additional Ordinary Shares that may become issuable by reason of share splits, share dividends or similar transactions. We are registering the resale of the Ordinary Shares covered by this prospectus pursuant to the registration rights that we have granted to the Selling Shareholder in connection with the Promissory Note.
We will not receive any of the proceeds from the sale of the Ordinary Shares by the Selling Shareholder. The aggregate proceeds to the Selling Shareholder will be the purchase price of the Ordinary Shares less any discounts and commissions borne by the Selling Shareholder.
The Selling Shareholder will pay any underwriting discounts and commissions and expenses incurred by the Selling Shareholder for brokerage, accounting, tax or legal services or any other expenses incurred by the Selling Shareholder in disposing of the Ordinary Shares. We will bear all other costs, fees and expenses incurred in effecting the registration of the Ordinary Shares covered by this prospectus, including, without limitation, all registration and filing fees, Nasdaq listing fees, and fees and expenses of our counsel and our independent registered public accountants.
The Ordinary Shares beneficially owned by the Selling Shareholder covered by this prospectus may be offered and sold from time to time by the Selling Shareholder. The term “Selling Shareholder” includes donees, pledgees, transferees, assignees, distributees or other successors in interest selling Ordinary Shares received after the date of this prospectus from a Selling Shareholder as a gift, pledge, partnership distribution or other transfer, including in satisfaction of contractual obligations or other liabilities. The Selling Shareholder will act independently of us in making decisions with respect to the timing, manner and size of each sale. Such sales may be made on one or more exchanges or in the over-the-counter market or otherwise, at prices and under terms then prevailing or at prices related to the then current market price or in negotiated transactions. The Selling Shareholder reserves the right to accept and, together with its respective agents, to reject, any proposed purchase of Ordinary Shares to be made directly or through agents. The Selling Shareholder and any of its permitted transferees may sell their Ordinary Shares offered by this prospectus on any stock exchange, market or trading facility on which Ordinary Shares are traded or in private transactions. If underwriters are used in the sale, such underwriters will acquire the shares for their own account. These sales may be at a fixed price or varying prices, which may be changed, or at market prices prevailing at the time of sale, at prices relating to prevailing market prices or at negotiated prices. The Ordinary Shares may be offered to the public through underwriting syndicates represented by managing underwriters or by underwriters without a syndicate. The obligations of the underwriters to purchase the Ordinary Shares will be subject to certain conditions. The underwriters will be obligated to purchase all the Ordinary Shares offered if any of the Ordinary Shares are purchased.
Subject to the limitations set forth in the Promissory Note, the Selling Shareholder may use any one or more of the following methods when selling the Ordinary Shares offered by this prospectus:
• purchases by a broker-dealer as principal and resale by such broker-dealer for its own account pursuant to this prospectus;
• ordinary brokerage transactions and transactions in which the broker solicits purchasers;
• block trades in which the broker-dealer so engaged will attempt to sell the Ordinary Shares as agent but may position and resell a portion of the block as principal to facilitate the transaction;
• an over-the-counter distribution in accordance with the rules of Nasdaq;
• through trading plans entered into by a Selling Shareholder pursuant to Rule 10b5-1 under the Exchange Act that are in place at the time of an offering pursuant to this prospectus and any applicable prospectus supplement hereto that provide for periodic sales of their Ordinary Shares on the basis of parameters described in such trading plans;
• through one or more underwritten offerings on a firm commitment or best efforts basis;
• settlement of short sales entered into after the date of this prospectus;
132
• agreements with broker-dealers to sell a specified number of Ordinary Shares at a stipulated price per share;
• in “at the market” offerings, as defined in Rule 415 under the Securities Act, at negotiated prices, at prices prevailing at the time of sale or at prices related to such prevailing market prices, including sales made directly on a national securities exchange or sales made through a market maker other than on an exchange or other similar offerings through sales agents;
• directly to purchasers, including through a specific bidding, auction or other process, in privately negotiated transactions, or in satisfaction of contractual obligations or other liabilities;
• through the writing or settlement of options or other hedging transactions, whether through an options exchange or otherwise;
• through the distributions by the Selling Shareholder or its affiliates to its members, partners, stockholders or other equityholders;
• through a combination of any of the above methods of sale; or
• any other method permitted pursuant to applicable law.
In addition, the Selling Shareholder may elect to make an in-kind distribution of Ordinary Shares to its members, partners, stockholders or other equityholders pursuant to the registration statement of which this prospectus is a part by delivering a prospectus with a plan of distribution. To the extent that such members, partners, stockholders or other equityholders are not affiliates of ours, such members, partners, stockholders or other equityholders would thereby receive freely tradeable Ordinary Shares pursuant to the distribution through the registration statement of which this prospectus forms a part. To the extent a distributee is an affiliate of ours (or to the extent otherwise required by law), we may file a prospectus supplement in order to permit such distributee to use this prospectus to resell the Ordinary Shares acquired in the distribution.
There can be no assurance that the Selling Shareholder will sell all or any of the Ordinary Shares offered by this prospectus. In addition, the Selling Shareholder may also sell Ordinary Shares under Rule 144 under the Securities Act, if available, or in other transactions exempt from registration, rather than under this prospectus. The Selling Shareholder has the sole and absolute discretion not to accept any purchase offer or make any sale of Ordinary Shares if it deems the purchase price to be unsatisfactory at any particular time.
The Selling Shareholder also may transfer the Ordinary Shares in other circumstances, in which case the donees, pledgees, transferees, or other successors-in-interest will be the selling beneficial owners for purposes of this prospectus. Upon being notified by a Selling Shareholder that a donee, pledgee, transferee or other successor-in-interest intends to sell our Ordinary Shares, we will, to the extent required, promptly file a supplement to this prospectus to name specifically such person as a Selling Shareholder.
With respect to a particular offering of the Ordinary Shares held by the Selling Shareholder, to the extent required, an accompanying prospectus supplement or, if appropriate, a post-effective amendment to the registration statement of which this prospectus is part, will be prepared and will set forth the following information:
• the specific Ordinary Shares to be offered and sold;
• the names of any additional Selling Shareholder;
• the respective purchase prices and public offering prices, the proceeds to be received from the sale, if any, and other material terms of the offering;
• settlement of short sales entered into after the date of this prospectus;
• the names of any participating agents, broker-dealers or underwriters; and
• any applicable commissions, discounts, concessions and other items constituting compensation from the Selling Shareholder.
133
In connection with distributions of the Ordinary Shares or otherwise, the Selling Shareholder may enter into hedging transactions with broker-dealers or other financial institutions. In connection with such transactions, broker-dealers or other financial institutions may engage in short sales of the Ordinary Shares in the course of hedging the positions they assume with Selling Shareholder. The Selling Shareholder may also sell the Ordinary Shares short and redeliver the Ordinary Shares to close out such short positions. The Selling Shareholder may also enter into option or other transactions with broker-dealers or other financial institutions which require the delivery to such broker-dealer or other financial institution of Ordinary Shares offered by this prospectus, which Ordinary Shares such broker-dealer or other financial institution may resell pursuant to this prospectus (as supplemented or amended to reflect such transaction). The Selling Shareholder may also pledge Ordinary Shares to a broker-dealer or other financial institution, and, upon a default, such broker-dealer or other financial institution, may effect sales of the pledged Ordinary Shares pursuant to this prospectus (as supplemented or amended to reflect such transaction).
In order to facilitate the offering of the Ordinary Shares, any underwriters or agents, as the case may be, involved in the offering of such Ordinary Shares may engage in transactions that stabilize, maintain or otherwise affect the price of our Ordinary Shares. Specifically, the underwriters or agents, as the case may be, may overallot in connection with the offering, creating a short position in our Ordinary Shares for their own account. In addition, to cover overallotments or to stabilize the price of our Ordinary Shares, the underwriters or agents, as the case may be, may bid for, and purchase, such Ordinary Shares in the open market. Finally, in any offering of Ordinary Shares through a syndicate of underwriters, the underwriting syndicate may reclaim selling concessions allotted to an underwriter or a broker-dealer for distributing such Ordinary Shares in the offering if the syndicate repurchases previously distributed Ordinary Shares in transactions to cover syndicate short positions, in stabilization transactions or otherwise. Any of these activities may stabilize or maintain the market price of the Ordinary Shares above independent market levels. The underwriters or agents, as the case may be, are not required to engage in these activities, and may end any of these activities at any time.
The Selling Shareholder may solicit offers to purchase the Ordinary Shares directly from, and it may sell such Ordinary Shares directly to, institutional investors or others. In this case, no underwriters or agents would be involved. The terms of any of those sales, including the terms of any bidding or auction process, if utilized, will be described in the applicable prospectus supplement.
It is possible that one or more underwriters may make a market in our Ordinary Shares, but such underwriters will not be obligated to do so and may discontinue any market making at any time without notice. We cannot give any assurance as to the liquidity of the trading market for our Ordinary Shares. Our Ordinary Shares are currently listed on Nasdaq under the symbol “NAMM.”
The Selling Shareholder may authorize underwriters, broker-dealers or agents to solicit offers by certain purchasers to purchase the Ordinary Shares at the public offering price set forth in the prospectus supplement pursuant to delayed delivery contracts providing for payment and delivery on a specified date in the future. The contracts will be subject only to those conditions set forth in the prospectus supplement, and the prospectus supplement will set forth any commissions we or the Selling Shareholder pay for solicitation of these contracts.
The Selling Shareholder may enter into derivative transactions with third parties, or sell Ordinary Shares not covered by this prospectus to third parties in privately negotiated transactions. If the applicable prospectus supplement indicates, in connection with those derivatives, the third parties may sell Ordinary Shares covered by this prospectus and the applicable prospectus supplement, including in short sale transactions. If so, the third party may use Ordinary Shares pledged by the Selling Shareholder or borrowed from the Selling Shareholder or others to settle those sales or to close out any related open borrowings of shares, and may use Ordinary Shares received from the Selling Shareholder in settlement of those derivatives to close out any related open borrowings of shares. The third party in such sale transactions will be an underwriter and will be identified in the applicable prospectus supplement (or a post-effective amendment). In addition, the Selling Shareholder may otherwise loan or pledge Ordinary Shares to a financial institution or other third party that in turn may sell the Ordinary Shares short using this prospectus. Such financial institution or other third party may transfer its economic short position to investors in our Ordinary Shares or in connection with a concurrent offering of other Ordinary Shares.
In effecting sales, broker-dealers or agents engaged by the Selling Shareholder may arrange for other broker-dealers to participate. Broker-dealers or agents may receive commissions, discounts or concessions from the Selling Shareholder in amounts to be negotiated immediately prior to the sale.
134
In compliance with the guidelines of the Financial Industry Regulatory Authority (“FINRA”), the aggregate maximum discount, commission, fees or other items constituting underwriting compensation to be received by any FINRA member or independent broker-dealer will not exceed 8% of the gross proceeds of any offering pursuant to this prospectus and any applicable prospectus supplement.
If at the time of any offering made under this prospectus a member of FINRA participating in the offering has a “conflict of interest” as defined in FINRA Rule 5121, that offering will be conducted in accordance with the relevant provisions of FINRA Rule 5121.
To our knowledge, there are currently no plans, arrangements or understandings between the Selling Shareholder and any broker-dealer or agent regarding the sale of the Ordinary Shares by the Selling Shareholder. Upon our notification by the Selling Shareholder that any material arrangement has been entered into with an underwriter or broker-dealer for the sale of Ordinary Shares through a block trade, special offering, exchange distribution, secondary distribution or a purchase by an underwriter or broker-dealer, we will file, if required by applicable law or regulation, a supplement to this prospectus pursuant to Rule 424(b) under the Securities Act disclosing certain material information relating to such underwriter or broker-dealer and such offering.
Underwriters, broker-dealers or agents may facilitate the marketing of an offering online directly or through one of their affiliates. In those cases, prospective investors may view offering terms and a prospectus online and, depending upon the particular underwriter, broker-dealer or agent, place orders online or through their financial advisors.
In offering the Ordinary Shares covered by this prospectus, the Selling Shareholder and any underwriters, broker-dealers or agents who execute sales for the Selling Shareholder may be deemed to be “underwriters” within the meaning of the Securities Act in connection with such sales. Any discounts, commissions, concessions or profit they earn on any resale of those Ordinary Shares may be underwriting discounts and commissions under the Securities Act. Although the Selling Shareholder may be deemed to be an “underwriter” within the meaning of the Securities Act, the Selling Shareholder has informed the Company that it does not have any written or oral agreement or understanding, directly or indirectly, with any person to distribute any Ordinary Shares.
The underwriters, broker-dealers and agents may engage in transactions with us or the Selling Shareholder, or perform services for us or the Selling Shareholder, in the ordinary course of business.
In order to comply with the securities laws of certain states, if applicable, the Ordinary Shares must be sold in such jurisdictions only through registered or licensed brokers or dealers. In addition, in certain states the Ordinary Shares may not be sold unless they have been registered or qualified for sale in the applicable state or an exemption from the registration or qualification requirement is available and is complied with.
The Selling Shareholder and any other persons participating in the sale or distribution of the Ordinary Shares will be subject to applicable provisions of the Securities Act and the Exchange Act, and the rules and regulations thereunder, including, without limitation, Regulation M. These provisions may restrict certain activities of, and limit the timing of purchases and sales of any of the Ordinary Shares by, the Selling Shareholder or any other person, which limitations may affect the marketability of the Ordinary Shares.
We will make copies of this prospectus available to the Selling Shareholder for the purpose of satisfying the prospectus delivery requirements of the Securities Act. The Selling Shareholder may indemnify any agent, broker-dealer or underwriter that participates in transactions involving the sale of the Ordinary Shares against certain liabilities, including liabilities arising under the Securities Act.
Agents, broker-dealers and underwriters may be entitled to indemnification by us and the Selling Shareholder against certain civil liabilities, including liabilities under the Securities Act, or to contribution with respect to payments which the agents, broker-dealers or underwriters may be required to make in respect thereof.
135
SECURITIES ELIGIBLE FOR FUTURE SALE
As of March 25, 2026, we had 54,482,657 Ordinary Shares issued and outstanding and 18,576,677 Ordinary Shares issuable upon the exercise of the Warrants. Future sales or resales of substantial amounts of Ordinary Shares or Warrants in the public market could adversely affect market prices prevailing from time to time for such securities. Furthermore, because only a limited number of Ordinary Shares and Warrants are currently available for sale after the closing of our Business Combination due to contractual and legal restrictions on resale as described below, there may be sales of substantial amounts of Ordinary Shares and Warrants in the public market after the restrictions lapse. This may adversely affect the prevailing market prices of our securities and our ability to raise equity capital in the future.
Promissory Note
On September 30, 2025, the Company issued the Promissory Note with a face value of $3.5 million to the Selling Shareholder in connection with outstanding payment obligations to the Selling Shareholder for certain investment banking services provided to the Company in connection with the Business Combination, and on December 9, 2025, the Company amended and restated the Promissory Note to provide for a limitation on the number of shares that may be issued without shareholder approval. Pursuant to the terms of the Promissory Note, the Company is obligated to make monthly payments in either cash or Ordinary Shares, at the Company’s discretion, for 12 months. The first 11 monthly payments are to be in an amount equal to $300,000 and the last payment is to be $200,000. To the extent the Company elects to make payment in Ordinary Shares, the issue price of the Ordinary Shares will be calculated as the lesser of (i) 95% of the closing price on Nasdaq of the Ordinary Shares on the Trading Day immediately preceding the applicable payment date, and (ii) the arithmetic average of the Daily VWAP for the five (5) Trading Days ending on the Trading Day immediately preceding the applicable payment date. The Promissory Note also provides resale registration rights to the Selling Shareholder for any Ordinary Shares issued under the Promissory Note. The Selling Shareholder is restricted from selling such Ordinary Shares on any Trading Day in an amount greater than 5% of the Trading Volume, without the prior written consent of the Company. A copy of the Promissory Note has been filed as an exhibit to the Registration Statement of which this prospectus forms a part. As of April 1, 2026, the Company has issued 805,228 Ordinary Shares to the Selling Shareholder pursuant to the Promissory Note.
Company Earnout Shares
During the Company Earnout Period, the Company is obligated to issue up to 30.0 million Ordinary Shares to the Former Greenstone Shareholders upon and subject to achievement of the following milestones:
(i) 1.0 million Ordinary Shares, when the Company delivers a bankable feasibility study for the Mazowe Mine;
(ii) 4.0 million Ordinary Shares, if the Mazowe Mine reaches commercial production (i.e., the production of the first gold bar after processing and smelting);
(iii) 1.0 million Ordinary Shares, when the Company delivers a bankable feasibility study for the Redwing Mine;
(iv) 4.0 million Ordinary Shares, if the Redwing Mine reaches commercial production (i.e., the production of the first gold bar after processing and smelting); and
(v) 10.0 million Ordinary Shares, if the net present value of certain exploration projects in the DRC, as identified in a bankable feasibility study, is greater than or equal to $1.0 billion, with an additional 10.0 million shares if such net present value is greater than or equal to $2.0 billion.
Upon the occurrence of a change of control (as defined in the Business Combination Agreement) of the Company during the Company Earnout Period, then all milestones described above will be deemed to have been satisfied and all Earnout Shares that have not been previously issued will be issued to the Former Greenstone Shareholders effective as of immediately prior to the consummation of such change of control. A copy of the Business Combination Agreement has been filed as an exhibit to the Registration Statement of which this prospectus forms a part.
136
Registration Rights and Lock-up Agreement
On the Closing Date and in connection with the Business Combination, the Company, the Initial Shareholders and certain Former Greenstone Shareholders, consisting of the SelliBen Trust, Khumalo and entities controlled by our executive officers (collectively, the “Holders”) entered into the Registration Rights and Lock-up Agreement pursuant to which, among other things, the Company granted the Holders customary demand and piggyback registration rights. In addition, the Holders, other than Khumalo, agreed not to transfer for a period of 12 months after the Closing any registrable securities in the Company acquired by such person in connection with the Business Combination (such equity, “Lock-up Shares”), subject to exceptions, provided that (x) 50% of the Lock-up Shares will be released on such date on which the last reported sale price of the Ordinary Shares equals or exceeds $12.50 per Ordinary Share (as adjusted for share splits, share combinations, share dividends, reorganizations, recapitalizations and the like) for any 20 trading days within a 30-trading day period commencing at least 150 days after the Closing Date; and (y) the other 50% of the Lock-up Shares will be released on the date on which the last reported sale price of the Ordinary Shares equals or exceeds $15.00 per Ordinary Share (as adjusted for share splits, share combinations, share dividends, reorganizations, recapitalizations and the like) for any 20 trading days within a 30-trading day period commencing at least 150 days after the Closing Date.
Of the issued and outstanding Ordinary Shares, 44,999,296 are subject to the transfer restrictions contained the Registration Rights and Lock-up Agreement. The transfer restrictions of the Registration Rights and Lock-up Agreement do not apply to, among other exceptions, the securities held by Khumalo, the Polar Shares, transfers of the Sponsor Warrants (including any Ordinary Shares issuable upon the exercise of any such Warrant), and transfers of an aggregate of 800,000 Ordinary Shares initially held by the SPAC Sponsor at Closing. A copy of the Registration Rights and Lock-up Agreement has been filed as an exhibit to the Registration Statement of which this prospectus forms a part.
2025 Equity Incentive Plan
We expect to file a registration statement on Form S-8 under the Securities Act to register the Ordinary Shares reserved for issuance under our 2025 Equity Incentive Plan. We currently have 5,367,742 Ordinary Shares reserved for issuance under the plan. The Ordinary Shares to be covered by such registration statement are eligible for sale in the public markets, subject to vesting restrictions and any applicable holdings periods, any applicable lock-up agreements and Rule 144 limitations applicable to affiliates.
Rule 144
Pursuant to Rule 144 under the Securities Act (“Rule 144”) and subject to the restrictions set forth below under “Restrictions on the Use of Rule 144 by Shell Companies or Former Shell Companies”, a person who has beneficially owned restricted Ordinary Shares or Warrants for at least six months would be entitled to sell their securities; provided that (i) such person is not deemed to have been one of our affiliates at the time of, or at any time during the three months preceding, a sale and (ii) the Company is subject to the Exchange Act periodic reporting requirements for at least three months before the sale and have filed all required reports under Section 13 or 15(d) of the Exchange Act during the 12 months (or such shorter period as it was required to file reports) preceding the sale.
Persons who have beneficially owned restricted Ordinary Shares or Warrants for at least six months but who are our affiliates at the time of, or at any time during the three months preceding, a sale, would be subject to additional restrictions, by which such person would be entitled to sell within any three-month period only a number of securities that does not exceed the greater of:
• one percent (1%) of the total number of Ordinary Shares then issued and outstanding; and
• the average weekly reported trading volume of the Ordinary Shares during the four calendar weeks preceding the filing of a notice on Form 144 with respect to the sale.
Sales by our affiliates under Rule 144 are also limited by manner of sale provisions and notice requirements and to the availability of current public information about the Company.
137
Restrictions on the Use of Rule 144 by Shell Companies or Former Shell Companies
Rule 144 is not available for the resale of securities initially issued by shell companies (other than business combination related shell companies) or issuers that have been at any time previously a shell company. However, Rule 144 also includes an important exception to this prohibition if the following conditions are met:
• the issuer of the securities that was formerly a shell company has ceased to be a shell company;
• the issuer of the securities is subject to the reporting requirements of Section 13 or 15(d) of the Exchange Act;
• the issuer of the securities has filed all Exchange Act reports and material required to be filed, as applicable, during the preceding 12 months (or such shorter period that the issuer was required to file such reports and materials); and
• at least one year has elapsed from the time that the issuer filed Form 20-F type information with the SEC, reflecting its status as an entity that is not a shell company, which we filed with the SEC on June 11, 2025.
While we were formed as a shell company, upon the completion of the Business Combination we are no longer a shell company, and so, provided the conditions set forth in the exceptions listed above are satisfied, we expect that Rule 144 will become available for the resale of the above-noted restricted securities on or about June 11, 2026.
138
EXPENSES OF THIS OFFERING
We estimate that our expenses in connection with this offering, other than underwriting discounts and commissions, will be as follows:
|
SEC registration fee |
$ |
792.69 |
|
|
|
Legal fees and expenses |
|
* |
|
|
|
Accounting fees and expenses |
|
10,000 |
* |
|
|
Printing expenses |
|
15,000 |
* |
|
|
Miscellaneous costs |
|
* |
|
|
|
Total |
|
25,792.69 |
|
____________
* Amounts listed are estimates of fees that may be incurred and are subject to future contingencies. Actual expenses may vary. Some of these fees are calculated based on the securities offered and the number of issuances and accordingly cannot be defined at this time.
We will bear all costs, expenses and fees in connection with the registration of the securities offered by this prospectus, whereas the Selling Shareholder will bear all incremental selling expenses, including commissions, brokerage fees and other similar selling expenses.
The foregoing sets forth the general categories of expenses that we anticipate we will incur in connection with the offering of securities under this registration statement. To the extent required, any applicable prospectus supplement will set forth the estimated aggregate amount of expenses payable in respect of any offering of securities under this registration statement.
139
LEGAL MATTERS
The validity of the Ordinary Shares offered in this prospectus shall be passed on by Appleby (Cayman) Ltd.
EXPERTS
The consolidated financial statements of Namib Minerals as of December 31, 2025 and 2024 and for each year in the three-year period ended December 31, 2025 included in this Prospectus and in the Registration Statement have been so included in reliance on the report of BDO South Africa, an independent registered public accounting firm, given on the authority of said firm as experts in auditing and accounting. The address of BDO South Africa Incorporated is Wanderers Office Park, 52 Corlett Drive, Illovo South Africa 2196.
WSP Australia Pty Limited (“WSP”) has prepared the Technical Report Summaries with respect to the How Mine, the Redwing Mine and the Mazowe Mine which are incorporated by reference herein. WSP is a qualified person as defined in Subpart 1300 (17 CFR 229.1300) of Regulation S-K. WSP’s address is Level 3, 51-55 Bolton St. PO Box 1162 Newcastle NSW 2300.
ENFORCEABILITY OF CIVIL LIABILITIES
The Company is a corporation organized under the law of the Cayman Islands. Half of its directors and executive officers reside outside of the United States, and significantly all of its assets and the assets of such persons are located outside of the United States. As a result, it may not be possible for shareholders to effect service of process within the United States upon these persons or the Company, or to enforce against them or the Company judgments obtained in U.S. courts, whether or not predicated upon the civil liability provisions of the federal securities laws of the United States or of the securities laws of any state of the United States.
The courts of the Cayman Islands are unlikely (i) to recognize, or enforce against the Company, judgments of courts of the United States predicated upon the civil liability provisions of the securities laws of the United States or any State; and (ii) in original actions brought in the Cayman Islands, to impose liabilities against the Company predicated upon the civil liability provisions of the securities laws of the United States or any State, so far as the liabilities imposed by those provisions are penal in nature. In those circumstances, although there is no statutory enforcement in the Cayman Islands of judgments obtained in the United States, the courts of the Cayman Islands will recognize and enforce a foreign money judgment of a foreign court of competent jurisdiction without retrial on the merits based on the principle that a judgment of a competent foreign court imposes upon the judgment debtor an obligation to pay the sum for which judgment has been given provided certain conditions are met. For a foreign judgment to be enforced in the Cayman Islands, such judgment must be final and conclusive and for a liquidated sum, and must not be in respect of taxes or a fine or penalty, inconsistent with a Cayman Islands judgment in respect of the same matter, impeachable on the grounds of fraud or obtained in a manner, and or be of a kind the enforcement of which is, contrary to natural justice or the public policy of the Cayman Islands (awards of punitive or multiple damages may well be held to be contrary to public policy). A Cayman Islands Court may stay enforcement proceedings if concurrent proceedings are being brought elsewhere.
140
WHERE YOU CAN FIND MORE INFORMATION
We have filed a registration statement on Form F-1, of which this prospectus forms a part, including exhibits, under the Securities Act with respect to the Ordinary Shares offered by this prospectus. The registration statement on Form F-1, including the attached exhibits and schedules, contains additional relevant information about us and our shares. The rules and regulations of the SEC allow us to omit from this prospectus certain information included in the registration statement. For further information about us and the securities offered by this prospectus, you should refer to the registration statement and the exhibits and schedules filed with the registration statement. With respect to the statements contained in this prospectus regarding the contents of any agreement or any other document, in each instance, the statement is qualified in all respects by the complete text of the agreement or document, a copy of which has been filed as an exhibit to the registration statement.
We are subject to the informational requirements of the Exchange Act. Accordingly, we are required to file reports and other information with the SEC, including annual reports on Form 20-F and reports on Form 6-K. The SEC maintains an Internet site at www.sec.gov that contains reports, proxy and information statements and other information we have filed electronically with the SEC. As a foreign private issuer, we are exempt under the Exchange Act from, among other things, the rules prescribing the furnishing and content of proxy statements. In addition, we are not required under the Exchange Act to file periodic reports and financial statements with the SEC as frequently or as promptly as U.S. companies whose securities are registered under the Exchange Act.
Our website address is https://www.namibminerals.com/. The reference to our website is an inactive textual reference only, and information contained therein or connected thereto is not incorporated into this prospectus.
141
INDEX TO FINANCIAL STATEMENTS
Contents
Namib Minerals
F-1
Report of Independent Registered Public Accounting Firm
Shareholders and Board of Directors
Namib Minerals
Grand Cayman, Cayman Islands
Opinion on the Consolidated Financial Statements
We have audited the accompanying consolidated statement of financial position of Namib Minerals (the “Company”) as of December 31, 2025 and 2024, the related consolidated statements of profit or loss and other comprehensive income, shareholders’ deficit, and cash flows for each of the three years in the period ended December 31, 2025, and the related notes (collectively referred to as the “consolidated financial statements”). In our opinion, the consolidated financial statements present fairly, in all material respects, the financial position of the Company at December 31, 2025 and 2024, and the results of its operations and its cash flows for each of the three years in the period ended December 31, 2025, in conformity with IFRS Accounting Standards as issued by the International Accounting Standards Board.
Basis for Opinion
These consolidated financial statements are the responsibility of the Company’s management. Our responsibility is to express an opinion on the Company’s consolidated financial statements based on our audits. We are a public accounting firm registered with the Public Company Accounting Oversight Board (United States) (PCAOB) and are required to be independent with respect to the Company in accordance with the U.S. federal securities laws and the applicable rules and regulations of the Securities and Exchange Commission and the PCAOB.
We conducted our audits in accordance with the standards of the PCAOB. Those standards require that we plan and perform the audit to obtain reasonable assurance about whether the consolidated financial statements are free of material misstatement, whether due to error or fraud. The Company is not required to have, nor were we engaged to perform, an audit of its internal control over financial reporting. As part of our audits, we are required to obtain an understanding of internal control over financial reporting but not for the purpose of expressing an opinion on the effectiveness of the Company’s internal control over financial reporting. Accordingly, we express no such opinion.
Our audits included performing procedures to assess the risks of material misstatement of the consolidated financial statements, whether due to error or fraud, and performing procedures that respond to those risks. Such procedures included examining, on a test basis, evidence regarding the amounts and disclosures in the consolidated financial statements. Our audits also included evaluating the accounting principles used and significant estimates made by management, as well as evaluating the overall presentation of the consolidated financial statements. We believe that our audits provide a reasonable basis for our opinion.
We have served as the Company’s auditor since 2022.
/s/ BDO South Africa Incorporated
BDO South Africa Incorporated
Johannesburg, South Africa
Date: April 2, 2026
F-2
Namib Minerals
Consolidated Statements of Profit or Loss and Other Comprehensive Income
For the years ended
($ in thousands)
|
Note |
December 31, |
December 31, |
December 31, |
|||||||||||
|
Revenue |
5 |
$ |
|
|
$ |
|
|
$ |
|
|
||||
|
Production costs |
6 |
|
( |
) |
|
( |
) |
|
( |
) |
||||
|
Depreciation and amortization |
14 |
|
( |
) |
|
( |
) |
|
( |
) |
||||
|
Royalties |
|
( |
) |
|
( |
) |
|
( |
) |
|||||
|
Gross profit |
|
|
|
|
|
|
|
|
|
|||||
|
Other income |
10 |
|
|
|
|
|
|
|
|
|
||||
|
Administrative expenses |
7 |
|
( |
) |
|
( |
) |
|
( |
) |
||||
|
Change in fair value of earnout liability |
35 |
|
|
|
|
|
|
|
||||||
|
Change in fair value of derivative liability (warrants) |
25 |
|
|
|
|
|
|
|
||||||
|
Listing expense |
4(c) |
|
( |
) |
|
|
|
|
||||||
|
Allowance for credit losses, net of recoveries |
18 |
|
( |
) |
|
( |
) |
|
( |
) |
||||
|
Foreign exchange (loss)/gain |
8 |
|
( |
) |
|
|
|
|
|
|
||||
|
Impairment |
14 |
|
( |
) |
|
( |
) |
|
|
|||||
|
Operating profit |
|
|
|
|
|
|
|
|
|
|||||
|
Finance cost |
11 |
|
( |
) |
|
( |
) |
|
( |
) |
||||
|
Disposal of investment |
|
|
|
|
|
( |
) |
|||||||
|
Related party credit loss |
29 |
|
|
|
( |
) |
|
( |
) |
|||||
|
Interest income |
|
|
|
|
|
|
|
|
|
|||||
|
Financial guarantee remeasurement |
32 |
|
|
|
|
|
|
|
|
|||||
|
Profit before taxation |
|
|
|
|
|
|
|
|
|
|||||
|
Income tax expense |
12 |
|
( |
) |
|
( |
) |
|
( |
) |
||||
|
Profit for the year |
|
|
|
|
|
|
|
|
|
|||||
|
Other comprehensive income |
|
|
|
|
|
|
||||||||
|
Total comprehensive income |
$ |
|
|
$ |
|
|
|
|
|
|||||
|
|
|
|
|
|
|
|||||||||
|
Earnings per share |
|
|
|
|
|
|
||||||||
|
Basic earnings per share ($) |
13 |
|
|
|
|
|
|
|
|
|
||||
|
Diluted earnings per share ($) |
13 |
|
|
|
|
|
|
|
|
|
||||
The accompanying notes on pages F-7 to F-53 are an integral part of these consolidated financial statements.
F-3
Namib Minerals
Consolidated Statements of Financial Position
As of
($ in thousands)
|
Note |
December 31, |
December 31, |
||||||||
|
ASSETS |
|
|
|
|
||||||
|
Current assets: |
|
|
|
|
||||||
|
Inventories |
17 |
$ |
|
|
$ |
|
|
|||
|
Trade and other receivables |
18 |
|
|
|
|
|
|
|||
|
Amounts due from related parties |
29 |
|
|
|
|
|
||||
|
Cash and cash equivalents |
20 |
|
|
|
|
|
|
|||
|
Excise duty indemnification |
1(e) |
|
|
|
|
|
||||
|
Short-term prepayments |
16 |
|
|
|
|
|
|
|||
|
Total current assets |
$ |
|
|
$ |
|
|
||||
|
|
|
|
|
|||||||
|
Non-current assets: |
|
|
|
|
||||||
|
Property, plant and equipment |
14 |
|
|
|
|
|
|
|||
|
Exploration and evaluation assets |
15 |
|
|
|
|
|
|
|||
|
Long-term prepayments |
16 |
|
|
|
|
|
|
|||
|
Staff loan receivables |
|
|
|
|
|
|
||||
|
Total non-current assets |
|
|
|
|
|
|
||||
|
TOTAL ASSETS |
$ |
|
|
$ |
|
|
||||
|
|
|
|
|
|||||||
|
LIABILITIES |
|
|
|
|
||||||
|
Current liabilities: |
|
|
|
|
||||||
|
Trade and other payables |
19 |
$ |
|
|
$ |
|
|
|||
|
Cash-settled share-based payment |
34 |
|
|
|
|
|
||||
|
Current tax liabilities |
12 |
|
|
|
|
|
|
|||
|
Borrowings |
24 |
|
|
|
|
|
|
|||
|
Bank overdraft |
20 |
|
|
|
|
|
||||
|
Excise duty payable |
1(e) |
|
|
|
|
|
||||
|
Amounts due to related parties |
29 |
|
|
|
|
|
|
|||
|
Total current liabilities |
$ |
|
|
$ |
|
|
||||
|
|
|
|
|
|||||||
|
Non-current liabilities: |
|
|
|
|
||||||
|
Provision for rehabilitation cost |
21 |
|
|
|
|
|
|
|||
|
Borrowings |
24 |
|
|
|
|
|
|
|||
|
Deferred tax liability |
12 |
|
|
|
|
|
|
|||
|
Derivative liability (warrants) |
25 |
|
|
|
|
|
||||
|
Earnout liability |
35 |
|
|
|
|
|
||||
|
Cash-settled share-based payment |
34 |
|
|
|
|
|
||||
|
Total non-current liabilities |
$ |
|
|
$ |
|
|
||||
|
TOTAL LIABILITIES |
$ |
|
|
$ |
|
|
||||
|
|
|
|
|
|||||||
|
Shareholders’ deficit: |
|
|
|
|
||||||
|
Share capital |
26 |
|
|
|
|
|
|
|||
|
Share premium/other reserves |
26 |
|
( |
) |
|
|
||||
|
Shareholders’ surplus/(deficit) |
|
|
|
|
( |
) |
||||
|
Total shareholders’ deficit |
|
( |
) |
|
( |
) |
||||
|
TOTAL LIABILITIES AND SHAREHOLDERS’ DEFICIT |
$ |
|
|
$ |
|
|
||||
The accompanying notes on pages F-7 to F-53 are an integral part of these consolidated annual financial statements.
F-4
Namib Minerals
Consolidated Statements of Changes in Shareholders’ Deficit
For the years ended December 31, 2023, 2024 and 2025
($ in thousands)
|
Note |
Share |
Share |
Shareholders’ |
Total |
|||||||||
|
Balance at January 1, 2023 |
|
|
( |
) |
( |
) |
|||||||
|
Total comprehensive income for the period |
|
|
|
|
|
||||||||
|
Share based payments |
|
( |
) |
( |
) |
||||||||
|
Dividend |
|
( |
) |
( |
) |
||||||||
|
Balance at December 31, 2023 |
26 |
|
|
( |
) |
( |
) |
||||||
|
Total comprehensive income for the period |
|
|
|
|
|
||||||||
|
Share based payments |
34 |
|
|
|
|
|
|||||||
|
Dividend |
|
( |
) |
( |
) |
||||||||
|
Balance at December 31, 2024 |
26 |
|
|
( |
) |
( |
) |
||||||
|
Total comprehensive income for the period |
|
|
|
|
|
||||||||
|
Impact of reverse capitalization |
4(b), 26 |
|
( |
) |
|
|
|||||||
|
Issuance of shares to HCVI shares upon reverse capitalization |
1, 4(a) |
( |
) |
|
( |
) |
|||||||
|
Issue of shares for promissory note(1) |
26 |
|
|
|
|
|
|||||||
|
Earnout liability |
35 |
( |
) |
|
( |
) |
|||||||
|
Listing expense |
1, 4(c) |
|
|
|
|
|
|||||||
|
Share-based payment |
34 |
|
|
|
|
|
|||||||
|
Balance at December 31, 2025 |
25 |
|
( |
) |
|
|
( |
) |
|||||
____________
1
F-5
Namib Minerals
Consolidated Statements of Cash Flows
For the years ended
($ in thousands)
|
Note |
December 31, |
December 31, |
December 31, |
|||||||||||
|
Cash flows from operating activities |
|
|
|
|
|
|
||||||||
|
Profit before tax |
SOCI |
$ |
|
|
$ |
|
|
$ |
|
|
||||
|
Adjustments: |
|
|
|
|
|
|
||||||||
|
Unrealized exchange losses/(gains) |
8 |
|
|
|
|
( |
) |
|
( |
) |
||||
|
Other income (decrease in rehabilitation provision) |
21 |
|
( |
) |
|
|
|
|
||||||
|
Impairment |
14 |
|
|
|
|
|
|
|
|
|||||
|
Depreciation and amortization |
14 |
|
|
|
|
|
|
|
|
|
||||
|
Interest income |
|
( |
) |
|
( |
) |
|
( |
) |
|||||
|
Finance cost |
11 |
|
|
|
|
|
|
|
|
|
||||
|
Expected credit loss on trade and other receivables |
18 |
|
|
|
|
|
|
|
|
|
||||
|
Expected credit loss on related party receivables |
29 |
|
|
|
|
|
|
|
|
|||||
|
Loss on disposal of assets |
7, 14 |
|
|
|
|
|
|
|
|
|
||||
|
Prepayment write down |
7 |
|
|
|
|
|
|
|
||||||
|
Remeasurement gain on financial guarantee |
30 |
|
|
|
( |
) |
|
( |
) |
|||||
|
Share-based payments |
34 |
|
|
|
|
|
|
|
|
|||||
|
Provision for stock obsolescence |
16 |
|
|
|
|
|
|
|
|
|
||||
|
Bad debts written off |
7 |
|
|
|
|
|
|
|
||||||
|
Listing expense |
1 |
|
|
|
|
|
|
|
||||||
|
Fair value gain on derivative liability (warrants) |
25 |
|
( |
) |
|
|
|
|
||||||
|
Fair value gain on earnout liability |
35 |
|
( |
) |
|
|
|
|
||||||
|
Non-cash penalties levied on outstanding tax liabilities |
|
|
|
|
|
|
|
|
||||||
|
Other |
|
|
|
|
|
|
|
|||||||
|
Changes in: |
|
|
|
|
|
|
||||||||
|
Inventories |
|
( |
) |
|
( |
) |
|
( |
) |
|||||
|
Trade and other receivables, net |
|
( |
) |
|
( |
) |
|
( |
) |
|||||
|
Trade and other payables |
|
|
|
|
|
|
|
|
|
|||||
|
Prepayments |
|
|
|
|
|
|
|
( |
) |
|||||
|
Related party balance |
|
( |
) |
|
( |
) |
|
( |
) |
|||||
|
Cash generated from operations |
|
|
|
|
|
|
|
|
|
|||||
|
Interest expense paid |
11 |
|
( |
) |
|
( |
) |
|
( |
) |
||||
|
Taxes paid |
12.3 |
|
( |
) |
|
( |
) |
|
( |
) |
||||
|
Net cash provided by operating activities |
|
|
|
|
|
|
|
|
|
|||||
|
|
|
|
|
|
|
|||||||||
|
Cash flows from investing activities |
|
|
|
|
|
|
||||||||
|
Purchase of property, plant and equipment (PP&E) |
14 |
|
( |
) |
|
( |
) |
|
( |
) |
||||
|
Investments in exploration and evaluation assets |
15 |
|
( |
) |
|
( |
) |
|
( |
) |
||||
|
Prepayments made towards PP&E |
16 |
|
( |
) |
|
( |
) |
|
( |
) |
||||
|
Proceeds received on settlement of loan notes |
|
|
|
|
|
|
|
|||||||
|
Staff loans advanced |
|
( |
) |
|
( |
) |
|
( |
) |
|||||
|
Repayment of staff loans advanced |
|
|
|
|
|
|
|
|||||||
|
Net cash used in investing activities |
|
( |
) |
|
( |
) |
|
( |
) |
|||||
|
|
|
|
|
|
|
|||||||||
|
Cash flow from financing activities |
|
|
|
|
|
|
||||||||
|
Proceeds from borrowings |
24 |
|
|
|
|
|
|
|
|
|
||||
|
Proceeds from bank overdraft |
24 |
|
|
|
|
|
|
|
||||||
|
Repayment of borrowings |
24 |
|
( |
) |
|
( |
) |
|
( |
) |
||||
|
Dividends paid |
28 |
|
|
|
( |
) |
|
( |
) |
|||||
|
Net cash generated by/(used in) financing activities |
|
|
|
|
( |
) |
|
( |
) |
|||||
|
Total cash movement for the year |
|
|
|
|
( |
) |
|
|
|
|||||
|
Effect of exchange rate fluctuation |
|
|
|
|
( |
) |
|
( |
) |
|||||
|
Cash and cash equivalents at the beginning of year |
|
( |
) |
|
|
|
|
|
|
|||||
|
Cash and cash equivalents, net at the end of year |
20 |
$ |
|
|
$ |
( |
) |
|
|
|
||||
The accompanying notes on pages F-7 to F-53 are an integral part of these consolidated financial statements.
F-6
Namib Minerals
Notes to the Financial Statements
1. General information
Organization
Namib Minerals (“Namib”) was incorporated on May 27, 2024, and is domiciled in the Cayman Islands. Namib Minerals’s registered office address is Suite 210, 2nd Floor, Windward III, Regatta Office Park, Cayman Islands.
Namib Minerals, through its subsidiaries (collectively the “Group”), is principally engaged in mining for gold and other precious and critical metals.
Reorganization Transaction
In March 2024, Greenstone Corporation (“Greenstone”) was established as an exempted company limited by shares incorporated under the laws of the Cayman Islands with its principal engagement being in mining operations for gold and other precious and critical metals in Zimbabwe. On June 17, 2024, Greenstone, a subsidiary of Namib entered a share purchase agreement (the “BMC Purchase Agreement”) with Metallon Corporation Limited (“Metallon”), a company incorporated in England and Wales and undergoing insolvency proceedings in the U.K., for the purchase of Metallon’s
As a single shareholder exercised control over both Greenstone and Metallon (the “Controlling Shareholder”), the Reorganization Transaction was determined to be an internal reorganization of entities under common control and signified a continuation of BMC’s operations, rather than the initiation of new business activities. Accordingly, the Reorganization Transaction was not within the scope of IFRS 3 (as defined below). The Controlling Shareholder was determined to exercise control over Greenstone through its majority ownership interest in the entity, which provided equity voting rights sufficient to exercise power over all key decision making. The Controlling Shareholder also held a majority ownership interest in Metallon and was determined to exercise control over the Administrator given the Controlling Shareholder was the largest creditor in the insolvency proceedings.
Given the Reorganization Transaction was not within the scope of IFRS 3, the Group applied the predecessor value method, and the consolidated financial statements for periods prior to the Reorganization Transaction reflect the operations of the predecessor, BMC, at the carrying amounts of the financial statements of the predecessor. The purchase price of £
Fiscal Year 2025 — Business Combination
a) Business Combination Background
On June 5, 2025 (“Closing Date”), Namib Minerals consummated the previously announced business combination (the “Business Combination”) pursuant to the Business Combination Agreement, dated as of June 17, 2024 (as amended by amendment 1 on December 6, 2024 and amendment 2 on April 14, 2025, the “Business Combination Agreement”) with:
(i) Hennessy Capital Investment Corp.VI, a special purpose acquisition company (SPAC) incorporated in Delaware and now known as Red Rock Acquisition Corp. (“HCVI”),
(ii) Greenstone,
(iii) Midas SPAC Merger Sub Inc., a Delaware corporation and a direct wholly owned subsidiary of Namib Minerals (“SPAC Merger Sub”), and
F-7
Namib Minerals
Notes to the Financial Statements
1. General information (cont.)
(iv) Cayman Merger Sub Ltd., an exempted company limited by shares incorporated under the laws of the Cayman Islands and a direct wholly owned subsidiary of Namib Minerals (“Greenstone Merger Sub”).
As a result of the Business Combination, Greenstone Merger Sub merged with and into Greenstone, with Greenstone continuing as the surviving company and becoming a wholly owned subsidiary of Namib Minerals and SPAC Merger Sub merged with and into HCVI, with HCVI continuing as the surviving company, and becoming a wholly owned subsidiary of Namib Minerals. HCVI was then renamed to Red Rock Acquisition Corporation. The ordinary shares of Namib Minerals, par value $
b) Determination of Accounting Treatment and Listing Expense
Since HCVI did not meet the definition of a business under IFRS 3, Business Combination (“IFRS 3”), the Business Combination was accounted for as a share-based payment transaction in accordance with IFRS 2, Share-based Payment (“IFRS 2”), and the Business Combination was accounted for as a reverse capitalization. Under this method of accounting, HCVI was treated as the acquired company for financial reporting purposes and Greenstone was treated as the accounting acquirer. Accordingly, for accounting purposes, the Business Combination was treated as the equivalent of Greenstone issuing shares for the net assets of HCVI and any difference in the fair value of the shares deemed to have been issued by Greenstone and the fair value of the accounting of HCVI’s identifiable net assets represented a service received by Greenstone, and thus it was recognized as an IFRS 2 listing service non-cash expense of $
c) Earnout liability
In accordance with the terms of the Business Combination Agreement, during the period between the Closing Date and the 8th anniversary of the Closing Date (the “Company Earnout Period”), Namib is obligated to issue up to
The milestones are as follows:
• if the Mazowe Mine Bankable Feasibility Study (BFS) Milestone is achieved during the Company Earnout Period, an aggregate of
• if the Mazowe Mine Commercial Production Milestone is achieved during the Company Earnout Period, an aggregate of
• if the Redwing Mine BFS Milestone is achieved during the Company Earnout Period, an aggregate of
F-8
Namib Minerals
Notes to the Financial Statements
1. General information (cont.)
• if the Redwing Mine Commercial Production Milestone is achieved during the Company Earnout Period, an aggregate of
If the net present value of certain exploration projects in the Democratic Republic of the Congo, as identified in a bankable feasibility study, is greater than or equal to $
d) Warrants liability
In accordance with the terms of the Business Combination Agreement, the Warrants issued are a replacement of the warrants of HCVI (the “SPAC Warrants”) and represent liabilities assumed in the Business Combination. The Warrants are not part of the consideration issued by Greenstone to acquire HCVI. The Warrants are derivative liabilities under IAS 32/IFRS 9. See Note 25 — Derivative liability (warrants) for additional information on the Warrants liability.
e) Excise duty
As a result of the Business Combination, Namib assumed the responsibility for the excise tax liability of million incurred by HCVI and payable subsequent to the Closing Date. According to the Business Combination Agreement, Hennessy Capital Partners VI LLC, a Delaware limited liability company (the “SPAC Sponsor”), has agreed to fully indemnify Namib for this liability. Accordingly, an indemnification asset related to the excise tax of million has been recognized.
2. Basis of presentation
Statement of compliance
The consolidated financial statements of the Group have been prepared on a going concern basis, in accordance with IFRS® Accounting Standards (IFRS Accounting Standards), as issued by the International Accounting Standards Board (“IASB”).
Material accounting policies used in the preparation of these consolidated financial statements are presented in Note 3.
The consolidated financial statements of the Group were approved for issue by the Group’s Board of Directors on April 2, 2026. These consolidated financial statements follow the same significant accounting policies as those included in the Group’s most recent audited consolidated financial statements for the year ended December 31, 2024, except for the adoption of new or revised standards that became mandatory for periods beginning on or after January 1, 2025.
Basis of measurement
These consolidated financial statements have been prepared on the historical cost basis except for:
• the earnout liability and derivative liability (warrants) are measured at fair value with gains or losses recognised in profit or loss;
• cash-settled share-based payment arrangements measured at fair value on grant and re-measurement dates; and
• equity-settled share-based payment arrangements measured at fair value on the grant date.
These consolidated financial statements are presented in United States dollars (“$”, or “USD”), which is also the functional currency of the Group. All financial information has been presented in thousands, unless otherwise indicated.
F-9
Namib Minerals
Notes to the Financial Statements
3. Material accounting policies
3.1 Basis of consolidation
The consolidated financial statements comprise the financial statements of the Group and its subsidiaries which are controlled by the Group. Control over an entity is achieved when the Group is exposed, or has right, to variable returns from its involvement with the entity and has the ability to affect those returns through its power over the entity. Specifically, the Group controls an investee if, and only if, the Group has all of the following:
• Exposure, or rights, to variable returns from its involvement with the investee;
• The ability to use its power over the investee to affect its returns;
• When the Group has less than a majority of the voting, or similar, rights of an investee, it considers all relevant facts and circumstances in assessing whether it has power over an investee, including the contractual arrangement(s) with the other vote holders of the investee;
• Rights arising from other contractual arrangements; and
• The Group’s voting rights and potential voting rights.
Assets, liabilities, income, and expenses of a subsidiary acquired or disposed of are included in the consolidated financial statements of the Group from the date the Group gains control until the date the Group ceases to control the subsidiary. The Group reassesses whether or not it controls an investee if facts and circumstances indicate that there are changes to one or more of the elements of control.
Inter-company balances and transactions between consolidated subsidiaries are eliminated.
3.2 Cash and cash equivalents and overdraft
Cash and cash equivalents comprise cash balances and deposits accounts with original maturities of three months or less. The carrying amount of cash and cash equivalents either approximates fair value due to the short-term maturity of these instruments or is at fair value. Overdrafts, which are due on demand, were previously an integral part of the Group’s cash management and were included as a component of cash and cash equivalents for the purpose of the statement of cash flows. However, as explained in Note 20, they are now included in borrowings (see Note 24).
3.3 Property, plant and equipment
Initial Recognition
Items of property, plant and equipment are initially measured at cost. Cost includes expenditures that are directly attributable to the acquisition of the asset. The cost of self-constructed assets includes the cost of materials and direct labor, any other costs attributable to bringing the assets into a working condition for their intended use and the cost of dismantling and removing the items and restoring the site on which they are located.
Subsequent Measurement
Apart from capital work-in-progress, property, plant and equipment is subsequently measured at cost less accumulated depreciation and impairment losses. Capital work-in-progress is stated at cost and not depreciated. Depreciation on capital work-in-progress commences when the assets are ready for their intended use.
The cost of replacing part of an item of property, plant and equipment is recognized at the cost of the item if it is probable that the future economic benefits embodied within the part will flow to the Group and its cost can be measured reliably. The carrying amount of the replaced part is derecognized. The cost of the day-to-day servicing of vehicles, machinery, and equipment are recognized in profit or loss as incurred.
F-10
Namib Minerals
Notes to the Financial Statements
3. Material accounting policies (cont.)
Depreciation
The Group’s mining assets, which include related infrastructure and other assets used in production, as well as plant and equipment, and buildings, are depreciated on a straight-line basis over the estimated life of the mine (“LOM”). As the Group’s rates of production remain relatively constant, alternative depreciation methods, such as the units-of-production method, would be expected to result in a consistent pattern of depreciation as compared to the straight-line method of depreciation currently applied. Consistent with IAS 16 requirements, the Group evaluates its depreciation policy on an annual basis to ensure the method of depreciation appropriately reflects the pattern in which the asset’s future economic benefits are expected to be consumed.
The Group’s other capital assets are depreciated on a straight-line basis over their estimated useful lives of each part of an item of property, plant and equipment, since this most closely reflects the expected pattern of consumption of the future economic benefits embodied in the asset.
The estimated useful lives for the current and comparative periods are as follows:
| Mining assets | LOM | |
| Plant & equipment | LOM | |
| Buildings | LOM | |
| Motor vehicles | |
However, the Group estimates the LOM using mineral resources and reserves expected to be derived from the mine and its expected rate of production. Mineral resources and reserves are categorized and reported in compliance with the United States Securities and Exchange Commission’s Subpart 1300 of Regulation S-K (“SK 1300 Report”). The Group includes inferred resources in the resource and reserve base used to estimate the LOM when the Group holds a reasonable expectation that such resources will be upgraded to indicated and measured mineral resources and form part of eventual extraction. Due to the timing of when the SK-1300 Report is finalized as compared to the timing of management’s preparation of its annual financial statements, the LOM is estimated using resource and reserve data on a one-year lag basis. Accordingly, the LOM estimate as of December 31, 2025 used in depreciation calculations for the year ended December 31, 2025 is prepared using 2024 resource and reserve data.
As of December 31, 2025, and December 31, 2024, the Group estimates the LOM for the How Mine to be
With respect to the Group’s Mazowe and Redwing Mines, the Group has no assets subject to LOM depreciation due to each mine being put under care and maintenance and the related impairment. Refer to Note 14 for additional discussion. Depreciation methods, useful lives and residual values are assessed for appropriateness at each reporting date and adjusted if necessary.
Refer to policy Note 3.10 below for discussion on the Group’s impairment policies.
F-11
Namib Minerals
Notes to the Financial Statements
3. Material accounting policies (cont.)
Derecognition of plant, property and equipment
An item of property, plant and equipment is derecognized upon disposal or when no future economic benefits are expected from use or disposal. The gain or loss on disposal of property, plant and equipment is recognized in profit or loss based on the difference between the proceeds from disposal and the carrying amount of the asset.
3.4 Exploration and evaluation (“E&E”) assets
Qualifying exploration costs are capitalized as incurred. Costs incurred before the legal rights to explore are obtained are recognized in profit or loss. Qualifying direct expenditures include costs such as mineral rights, options to acquire mineral rights, materials used, surveying costs, drilling costs, payments made to contractors, and direct administrative costs incurred during the exploration phase.
Exploration and evaluation assets are not depreciated and remain capitalized, at their initial cost, until the mining properties to which they relate are ready for their intended use, sold, abandoned or management has determined there to be impairment. Once the technological feasibility and commercial viability of extracting the mineral resource has been determined, the exploration and evaluation assets are reclassified to mining assets within property, plant and equipment. Exploration and evaluation assets are tested for impairment when an indicator of impairment is identified.
Impairment expense is recognized in the consolidated statements of profit or loss and other comprehensive income (see Note 15).
3.5 Inventories
Inventories are initially recognized at cost. Cost of inventories comprises all costs of purchase, costs of conversion for mined minerals and other costs incurred in bringing the inventories to their present location and condition. Subsequently, gold inventories are measured at the lower of cost and net realizable value after making allowance for obsolete inventory. Cost for consumable inventories is determined on the weighted average basis. The cost of gold in progress includes an appropriate share of production overheads based on normal operating capacity. Net realizable value is the estimated selling price in the ordinary course of business, less the estimated costs of completion and selling expenses. Write downs to net realizable values and inventory losses is recognized in profit or loss in the period in which they occur. The Group evaluates consumable inventory on a quarterly basis for obsolescence based on turnover rates, consumption trends, and product life cycles, and flags items with prolonged inactivity for potential write-down.
3.6 Provisions
A provision is a liability of uncertain timing and amount. A liability is recognized if, as a result of a past event, the Group has a present legal or constructive obligation that can be estimated reliably, and it is probable that an outflow of economic benefits will be required to settle the obligation. Provisions are determined by discounting the expected future cash flows at a discount rate that reflects current market assessments of the time value of money and the risks specific to the liability if the time value of money is considered significant. Cash flows are discounted on a pre-tax basis.
3.6.1 Environmental rehabilitation provision
A provision for rehabilitation costs is recognized when the Group has a present obligation under current environmental laws and its social responsibility programme to remedy environmental disturbances that have occurred as a result of the development or ongoing production of the mine. The future rehabilitation costs are discounted to present value at a pre-tax rate that reflects the time-value of money and capitalized to property, plant, and equipment, along with a corresponding rehabilitation provision. The Group’s estimates of rehabilitation costs, which are reviewed annually, could change as a result of changes in regulatory requirements, discount rates, effects
F-12
Namib Minerals
Notes to the Financial Statements
3. Material accounting policies (cont.)
of inflation and assumptions regarding the amount and timing of the future expenditures. These changes are recorded directly to property, plant, and equipment, with a corresponding entry to the rehabilitation provision (see Note 3.3). The unwinding of the discount is recognized in profit or loss as a component of finance cost (note 11).
Amounts recorded for restoration and rehabilitation provision require management to estimate the future costs the Group will incur to complete the reclamation and remediation work required to comply with applicable laws and regulations as well as taking into consideration the timing of the reclamation activities and estimated discount rate. Future changes to environmental laws and regulations could increase the extent of reclamation and remediation work required to be performed by the Group. Increases in future costs could materially impact the amounts charged to operations for reclamation and remediation. The provision represents management’s best estimate of the present value of the future reclamation and remediation costs.
3.7 Revenue from contracts with customers
Revenues are primarily generated from the sale of precious metals and are recognized at the point in time when control is transferred. Control of the precious metals is transferred when the metals are delivered to and accepted by Fidelity Printers and Refiners Limited (“Fidelity”), a subsidiary of the Reserve Bank of Zimbabwe and the Group’s single customer with respect to sales of precious metals from its mining operations. The transaction price for the sales of precious metals is measured at the London Base Metal Association spot price at the date of the transaction and reflects the consideration which the entity is entitled to in exchange for goods transferred, net of deductions for value-added taxes (“VAT”). Receipt of proceeds from the sale of precious metals is substantially assured upon transfer of control to Fidelity and settlement typically occur within 30 days of delivery. For deliveries to Fidelity, from February 2025 the Group receives
This arrangement complies with the current Zimbabwean requirements set forth in Chapter VII of the Finance Act to pay a
3.8 Employee benefits
Employee benefits are all forms of consideration given by the Group in exchange for services rendered by employees.
Short term benefits
Short term benefits are employee benefits (other than termination benefits) which fall due wholly within twelve months after the end of the period in which the employees render related services. Short-term employee benefits are expensed when the related services are provided. The Group recognizes a liability for the amount of the short-term employee benefits expected to be paid in exchange for that service in profit or loss if the Group has a present legal or constructive obligation to pay this amount as a result of past service provided by the employees and the obligation can be reliably estimated.
Post-employment benefits
Post-employment benefits relate to a defined contribution plan under which the Group pays fixed contributions into a separate entity and has no legal or constructive obligation to pay further amounts. Obligations for contributions to defined contribution schemes are charged to profit or loss as an employee benefit expense in the year to which they relate.
F-13
Namib Minerals
Notes to the Financial Statements
3. Material accounting policies (cont.)
3.9 Financial instruments
The Group’s financial instruments consist of the following:
• Cash and cash equivalents (Note 20)
• Trade and other receivables (Note 18)
• Staff loan receivables (Note 18)
• Trade and other payables (Note 19)
• Borrowings (Note 24)
• Amounts due from/to related party (Note 29)
• Dividend payable (Note 28)
• Derivative liability (warrants) (Note 25)
• Earnout liability (Note 35)
• Excise duty indemnification/payable (Note 1(e))
i) Financial assets
Recognition and initial measurement
A financial asset (unless it is a trade receivable without a significant financing component) is initially measured at fair value plus, for an item not at fair value through profit or loss, transaction costs that are directly attributable to its acquisition or issue. A trade receivable without a significant financing component is initially measured at the transaction price.
Classification and subsequent measurement
The Group’s financial assets are subsequently measured at amortized cost using the effective interest method, reduced by any allowance for expected credit losses. Trade receivables are generally due for settlement within 30 days.
Refer to policy Note 3.10 for policies over recognition of expected credit losses on financial assets which include trade and other receivables, net.
The Group derecognizes a financial asset when the contractual rights to the cash flows from the asset expire, or it transfers the rights to receive the contractual cash flows from the financial asset in a transaction in which substantially all the risks and rewards of ownership of the financial asset are transferred or it neither transfers nor retains substantially all of the risks and rewards of ownership and does not retain control over the transferred asset.
ii) Financial liabilities
Recognition and initial measurement
Trade and other payables are recognized initially at fair value plus any directly attributable transaction costs as incurred. Borrowings are initially recognized at fair value net of any transaction costs directly attributable to the issue of the instrument.
Related party payables are recognized when the Group becomes contractually obligated to settle amounts owed to related parties. These payables are initially recorded at fair value and subsequently measured at amortized cost.
F-14
Namib Minerals
Notes to the Financial Statements
3. Material accounting policies (cont.)
Classification and subsequent measurement
Trade and other payables, amounts due to related parties, and borrowings are recognized initially at fair value plus any directly attributable transaction costs and excise duty liability. Subsequent to initial recognition, these financial liabilities are measured at amortized cost using the effective interest method.
3.10 Impairment
i) Expected credit losses on financial assets
The Group applies the IFRS 9 simplified model of recognizing lifetime expected credit losses for its trade receivables. For other receivables, the Group applies the general approach.
The Group measures expected credit losses on trade and other receivables on an individual basis as they possess different credit risk characteristics. The Group’s trade receivables primarily arise from sales of precious metals to Fidelity. As the Group has no historical credit losses arising from sales to Fidelity and no expectation of future losses, no expected credit losses are recognized upon initial recognition. On a limited basis, the Group also generates trade and other receivables related to revenue arrangements with other customers. Receivables from other customers are assessed individually based on days past due and if applicable, an expected loss allowance is recorded based on this assessment.
Trade and other receivables are written off (i.e. derecognized) when there is no reasonable expectation of recovery. The Group considers a receivable to be in default when the amount is 90 days past due from its lodgement date. Failure to make payments within 90 days from lodgement date and failure to engage with the Group on alternative payment arrangement, amongst others, are considered indicators of no reasonable expectation of recovery.
For related party receivables, the Group assesses expected credit losses (“ECL”) using both historical repayment data and forward-looking information. This includes the financial condition of the counterparty, expected changes in group support, commodity price trends (such as gold), and the economic environment in the jurisdictions where the related parties operate. These factors help determine whether a loss allowance is required. A significant increase in credit risk is identified when there is evidence of financial deterioration, payment delays, or reduced likelihood of group support. If a receivable is more than 90 days past due, it is presumed to be in default unless there is evidence to the contrary. Each receivable is assessed by management on a case by case basis. Write-offs occur when there is no reasonable expectation of repayment, typically after long periods of non-payment and no realistic means of recovery.
Excise indemnity receivables are written off in accordance with the IFRS 9 expected credit loss model using the general approach. A 12-month expected credit loss is recognized on initial recognition, with lifetime expected credit losses recognized where there has been a significant increase in credit risk.
ii) Non-financial assets
The Group’s non-financial assets, other than inventories and deferred tax assets, are reviewed at each reporting date to determine whether there is any indication of impairment. If any such indication exists, then the asset’s recoverable amount is estimated. The recoverable amount of an asset or cash generating unit is the greater of its value in use and its fair value less costs of disposal. In assessing value in use, the estimated future cash flows are discounted to their present value using a pre-tax discount rate that reflects current market assessments of the time value of money and the risks specific to the asset. For the purpose of impairment testing, assets that cannot be tested individually are grouped together into the smallest group of assets that generates cash inflows from continuing use that are largely independent of the cash inflows of other assets or groups of assets (the “cash-generating unit” or “CGU”).
F-15
Namib Minerals
Notes to the Financial Statements
3. Material accounting policies (cont.)
The Group’s corporate assets do not generate separate cash inflows. If there is an indication that a CGU to which a corporate asset is allocated may be impaired, then the recoverable amount is determined for the CGU to which the corporate asset belongs.
An impairment loss is recognized in profit or loss if the carrying amount of a CGU exceeds its estimated recoverable amount. Impairment losses recognized in respect of CGUs are allocated to reduce the carrying amount of assets in the unit (group of units) on a pro rata basis. Impairment losses recognized in prior periods are assessed at each reporting date for any indications that the loss has decreased or no longer exists. An impairment loss is reversed if there has been an indication of reversal and a change in the estimates used to determine the recoverable amount. An impairment loss is reversed only to the extent that the asset’s carrying amount does not exceed the carrying amount that would have been determined, net of depreciation or amortization, if no impairment loss had been recognized.
3.11 Foreign currency transactions
Transactions in foreign currencies are initially recorded in the functional currency at the exchange rate ruling at the date of transaction. Monetary assets and liabilities denominated in foreign currencies are translated at the functional currency rate of exchange ruling at the reporting date. Non-monetary items that are measured in terms of historical cost in foreign currencies are translated using the exchange rate as at the date of the initial transactions. Gains and losses on translation of these foreign currency transactions are included in profit or loss.
3.12 Income tax
(i) Current tax
Current tax assets and liabilities for the current and prior periods are measured at the amount expected to be recovered from or paid to the tax authorities. The tax rates and tax laws used to compute the amount are those that are enacted or substantively enacted by the reporting date.
(ii) Deferred tax
Deferred income tax is recognized in full, using the liability method, on temporary differences arising between the tax bases of assets and liabilities and their carrying amounts in the financial statements.
Deferred tax liabilities are recognized for all taxable temporary differences except where the deferred tax liability arises from the initial recognition of goodwill or of an asset or liability in a transaction that is not a business combination and at the time of the transaction affects either the accounting profit or taxable profit or loss, and in respect of taxable temporary differences associated with investments in subsidiaries, associates and interests in joint ventures where the timing of the reversal of the temporary differences can be controlled and it is probable that reversal of the temporary differences will not reverse in the foreseeable future.
Deferred income tax assets are recognized for all deductible temporary differences, carry forward of unused tax credits and unused tax losses to the extent that it is probable that taxable profit will be available against which the deductible temporary differences and the carry forward of unused tax credits and unused tax losses can be utilised except ‘where the deferred income tax asset relating to the deductible temporary differences arises from the initial recognition of an asset or liability in a transaction that is not a business combination and at the time of the transaction affects neither the accounting profit nor taxable profit or loss, and in respect of deductible temporary differences associated with investments in subsidiaries, associates and interest in joint ventures’. Deferred tax assets are recognized only to the extent that it is probable that the temporary differences will reverse in the foreseeable future and taxable profit will be available against which the temporary differences can be utilised. The carrying amount of deferred income tax assets at each reporting date are reduced to the extent that it is no longer probable that sufficient taxable profit will be available to allow all or part of the deferred income tax asset to be utilised. Unrecognized deferred income tax assets are reassessed at reporting date and recognized to the extent that it has become probable that future taxable profit will allow the deferred tax asset to be recovered.
F-16
Namib Minerals
Notes to the Financial Statements
3. Material accounting policies (cont.)
Deferred income tax assets and liabilities are measured at the tax rates that are expected to apply to the year when the asset is realized, or the liability is settled based on tax rates (and tax laws) that have been enacted or substantively enacted at the reporting date. Income tax relating to items recognized directly in equity is recognized in equity and not in the profit or loss.
Deferred tax assets and deferred tax liabilities are offset if a legally enforceable right exists to set off current tax assets against current tax liabilities and the deferred tax relate to the same taxable entity and the same taxation authority.
Current and deferred income tax is recognized in profit or loss, except to the extent that it relates to items recognized in comprehensive income or directly in equity. In this case the tax is also recognized in comprehensive income or directly in equity, respectively.
3.13 Borrowing costs
Borrowing costs directly attributable to the acquisition, construction or production of qualifying assets, which are assets that necessarily take a substantial period of time to get ready for their intended use or sale, are added to the costs of those assets, until such time as the assets are substantially ready for their intended use or sale. There were borrowing costs capitalized as of December 31, 2025, and December 31, 2024.
Other borrowing costs are recognized in profit or loss in the period in which they are incurred. Borrowing costs are reported within “Finance cost” on the consolidated statements of profit or loss and other comprehensive income.
3.14 Earnings per share
The Group presents basic earnings per share (“EPS”) data for its shares. Basic EPS is calculated by dividing the profit or loss attributable to shareholders of the Group (see Note 13) by the weighted average number of shares outstanding during the period.
3.15 Share-based payment transactions
Equity-settled share-based payments
The grant date fair value of equity-settled share-based payment awards granted to employees and directors is recognised as an expense, with a corresponding increase in equity, over the vesting period of the award. The amount recognised as an expense is adjusted to reflect the number of awards for which the related service and non-market vesting conditions are expected to be met, such that the amount ultimately recognised as an expense is based on the number of awards that meet the related service and non-market vesting conditions at the vesting date.
Where equity instruments are granted to non-employees, they are recorded at the fair value of the goods or services received in profit or loss.
Cash-settled share-based payments
The grant date fair value of cash-settled awards granted to employees and directors is recognised as an expense, with a corresponding increase in the liability, over the vesting period of the awards. At each reporting date the fair value of the awards is re-measured with a corresponding adjustment to profit or loss.
3.16 Financial guarantee
The Group was a guarantor on a debt held by Metallon. The Group’s guarantee was accounted for as financial guarantee contract under IFRS 9, under which the Group was required to initially measure the guarantee at fair value and will subsequently measure the guarantee as the higher of (i) the amount of the loss allowance determined in accordance with the impairment requirements of IFRS 9 and (ii) the amount initially recognized less, the cumulative amount of income recognized in accordance with the principles of IFRS 15. This is no longer applicable because the Group is no longer a guarantor.
F-17
Namib Minerals
Notes to the Financial Statements
3. Material accounting policies (cont.)
3.17 Warrants
Initial recognition
Warrants issued by the Group provide the holder with the right to acquire a fixed number of Ordinary Shares at a contractual exercise price. Pursuant to the Business Combination Agreement, the Company issued Warrants in exchange for pre-existing SPAC Warrants on substantially the same terms. The Warrants were evaluated in accordance with IAS 32 Financial Instruments: Presentation to determine whether they should be classified as equity or as a financial liability.
The Warrants are classified as derivative financial liabilities at initial recognition, as they did not meet the “fixed-for-fixed” criterion required (IAS 32) for equity classification, as the contractual terms introduce variability inconsistent with an equity instrument.
The Warrants were initially measured at fair value as they were issued as replacement instruments and were not part of the consideration transferred under IFRS 3 in the Business Combination.
Subsequent measurement
The Warrants are subsequently measured at fair value through profit or loss (“FVTPL”) in accordance with IFRS 9 Financial Instruments. Changes in fair value arising from re-measurement at each reporting date are recognized in profit or loss within “Fair value gain/(loss) on derivative liabilities.”
As the Warrants are listed and traded in an active market, their fair value is determined using the quoted market price of the Warrants at each reporting date in accordance with IFRS 13 Fair Value Measurement. The quoted market price represents a Level 1 input in the fair value hierarchy and reflects the price that would be received in an orderly transaction to transfer the liability.
Derecognition
The Warrants are derecognized when the contractual rights or obligations are extinguished, including settlement through exercise, expiry, redemption, or cancellation.
3.18 Earnout liability
In accordance with the terms of the Business Combination Agreement, Former Greenstone Shareholders are entitled to receive up to a specified number of Earnout Shares over the Company Earnout Period. The issuance of Earnout Shares is contingent upon meeting defined operational and valuation milestones. In the event of a change of control during the Company Earnout Period, all outstanding milestones are deemed satisfied and all unissued Earnout Shares must be issued immediately prior to completion of such transaction.
The Group assessed the arrangement under IAS 32 Financial Instruments: Presentation to determine whether the Earnout Shares qualify as equity or a financial liability. The earnout arrangement is classified as a derivative financial liability because the Earnout Shares represent a contractual obligation to deliver a variable number of equity instruments contingent on future events and do not meet the IAS 32 fixed for fixed equity criterion. This arrangement does not form part of consideration transferred for the business combination (IFRS 3), and is recognized separately at fair value at the date of the transaction.
Subsequent measurement
The earnout liability is subsequently measured at fair value through profit or loss (FVTPL) in accordance with IFRS 9 Financial Instruments. Changes in fair value arising from remeasurement at each reporting date are recognized in profit or loss within “Fair value gain/(loss) on derivative liabilities.” This reflects the requirement to revalue derivative liabilities at each reporting date until settlement.
F-18
Namib Minerals
Notes to the Financial Statements
3. Material accounting policies (cont.)
Fair value measurement
Fair value is determined as the price that would be paid to transfer the liability in an orderly transaction between market participants at the measurement date in accordance with IFRS 13 Fair Value Measurement. Fair value measurements are categorized within the IFRS 13 fair value hierarchy based on the lowest level significant input:
• Level 1: Quoted (unadjusted) prices for identical liabilities in active markets.
• Level 2: Inputs observable either directly or indirectly, such as quoted prices for similar liabilities or market correlated assumptions.
• Level 3: Unobservable inputs reflecting the Company’s own assumptions regarding inputs that market participants would use, including probability weighted achievement of milestones and expected timing.
If multiple inputs from different hierarchy levels are used, the classification of the entire fair value measurement is based on the lowest level input that is significant to the valuation.
Valuation Inputs
Key inputs used in determining the fair value of the Earnout Shares include:
• Probability weighted assessment of achieving operational and valuation milestones;
• Expected timing of milestone achievement;
• Market based discount rates;
• Forecast share price volatility and valuation metrics relevant to the underlying equity; and
• Scenario modelling for change of control features.
3.19 Related party transactions
Related party transactions consist of transactions with Metallon and its affiliates and subsidiaries (see Note 29). Amounts due to and from related parties are presented gross unless there are specific arrangements which provide for the right of offset, in which case the amounts receivable and payable with the related party entity would be presented as a net receivable or payable. Amounts due to related parties are considered current unless otherwise specified within the terms of the arrangement. See Note 29 for further details.
3.20 Other income
Other income primarily consists of milling recoveries and royalties, income associated with insurance proceeds and rental income. Milling recoveries represent amounts received from third parties in exchange for using the Group’s production facilities and are recognized as services are provided. Milling royalties are profit-sharing payments from third parties using the Group’s production facilities and are recognized when earned. Income from rentals is recognized in the period earned.
3.21 Prepayments
Prepayments consist of advance payments for services, inventory, and capital assets which have yet to be received and placed in service. Prepayments associated with the purchase of capital assets which will be reclassified to property, plant, and equipment when the assets are received, are presented as a non-current asset on the consolidated statements of financial position.
F-19
Namib Minerals
Notes to the Financial Statements
3. Material accounting policies (cont.)
3.22 Use of accounting assumptions, key estimates, and judgments
In preparing the financial statements, management is required to make accounting assumptions, estimates and judgements that affect the amounts presented in the financial statements and related disclosures. Use of available information and the application of judgment are inherent in the formation of estimates. Actual results in the future could differ from these estimates which may be material to the financial statements. Estimates and underlying assumptions are reviewed on an ongoing basis. Changes in estimates are recognized prospectively.
Significant accounting assumptions, estimates and judgments include:
(a) Impairment of property, plant and equipment
Property, plant and equipment assets are reviewed for impairment if there is any indication that the carrying amount may not be recoverable. Where a review for impairment is conducted, the recoverable amount is assessed by reference to the higher of ‘value in use’ (being the net present value of expected future cash flows of the relevant cash generating unit) and ‘fair value less costs to sell’. In determining value in use, future cash flows are based on estimates of the quantities of economically recoverable ore reserves and mineral resources for which there is a high degree of confidence of economic extraction, future production levels, future commodity prices and future cash costs of production. Variations to the expected future cash flows, and the timing thereof, could result in significant changes to any impairment losses recognized, if any, which could in turn impact future financial results.
(b) Depreciation (see Note 14)
The Group’s depreciation on mining assets, which include related infrastructure and other assets used in production, as well as plant and equipment, and buildings, are depreciated on a straight-line basis over the LOM. The Group estimates the LOM based on estimated quantities of mineral and ore reserves including measured, indicated, and inferred. There are numerous uncertainties inherent in estimating mineral resources and ore reserves and assumptions that are valid at the time of estimation may change significantly when new information becomes available. Key assumptions include planned future production from inferred resources, and the quantity and quality of the ore mined.
(c) Mineral reserves and resources (see Note 14)
The Group is required to determine and report mineral reserves (proven and probable) and mineral resources (measured, indicated, and inferred) in accordance with the SK 1300 Report. In order to calculate mineral reserves and resources, estimates and assumptions are required about a range of geological, technical, and economic factors, including but not limited to quantities, grades, production techniques, recovery rates, production costs, transport costs, commodity demand, commodity prices and exchange rates. Estimating the quantity and/or grade of mineral reserves and resources requires the size, shape, and depth of ore bodies to be determined by analyzing geological data such as the logging and assaying of ore samples. This process may require complex and difficult geological judgments and calculations to interpret the data. Because the assumptions used to estimate mineral reserves and resources change from period to period and because additional geological data is generated during the course of operations, estimates of mineral reserves and resources may change from period to period. Mineral reserves and resource estimates prepared by management are reviewed by an independent mineral resources expert.
Changes in reported mineral reserves and resources may affect the group’s LOM plan, financial results, and financial position in a number of ways, including the following:
• asset carrying values may be affected due to changes in estimated future cash flows;
• depreciation charged to profit or loss may change if the useful lives of assets change;
F-20
Namib Minerals
Notes to the Financial Statements
3. Material accounting policies (cont.)
• decommissioning, site restoration and environmental provisions may change where changes in estimated mineral reserves and resources affect expectations about the timing or cost of these activities (see Note 21); and
• the carrying value of deferred tax assets and liabilities may change due to changes in estimates of the likely recovery of the tax benefits and charges (see Note 12).
These factors could include:
• changes in mineral reserves and resources;
• the grade of mineral reserves and resources may vary from time to time;
• differences between actual commodity prices and commodity price assumptions;
• unforeseen operational issues at mine sites including planned extraction efficiencies; and
• changes in capital, operating, mining processing and reclamation costs, discount rates and foreign exchange rates.
(d) Provision for rehabilitation costs (see Note 21)
The Group is required to make estimates for the timing and amounts of future restoration costs which are then discounted to present value. The discount rate utilized in the Group’s present value calculation is estimated based on US treasury rates. Although the Group’s estimate is based on historical experience and re-evaluated annually, the estimated timing and amounts of the rehabilitation cash flows are inherently uncertain. As a result, these estimates and assumptions are subjective and can vary over time. Actual rehabilitation costs will ultimately depend on future market prices for the rehabilitation. The final cost of the currently recognized provision for rehabilitation costs may be higher or lower than as currently recorded in the consolidation financial statements (refer to Note 21).
(e) Exploration and evaluation assets (see Note 15)
The Group makes assumptions and estimates regarding the technical feasibility and commercial viability of its mining projects and the possible impairment of E&E assets by evaluating whether it is likely that future economic benefits will flow to the Group, which may be based on assumptions about future events or circumstances, such as the completion of a feasibility study indicating construction, funding and economic returns that are sufficient. Assumptions and estimates made may change if new information becomes available. If information becomes available suggesting that the recovery of expenditures is unlikely, the amount capitalized is written off in profit or loss in the period the new information becomes available. The recoverability of the carrying amount of exploration and evaluation assets depends on the availability of sufficient funding to bring the properties into commercial production, the price of the products to be recovered and the undertaking of profitable mining operations. As a result of these uncertainties, the actual amount recovered may vary significantly from the carrying amount.
(g) Foreign currency transactions
In applying IAS 21, management determined that USD remained the primary currency in which the Group’s Zimbabwean entities operate, as:
• the majority of revenues generated from sales of precious metals are settled in USD;
• the gold price receivable is calculated in USD;
• the majority of costs are calculated by reference to USD if denominated in ZIG or is paid in USD; and
• income tax liabilities calculated in ZIG and USD are settled predominantly in USD.
F-21
Namib Minerals
Notes to the Financial Statements
3. Material accounting policies (cont.)
(h) Common control
Refer to Note 1 for a description of the Group’s judgment applied toward the common control transaction during the year ended December 31, 2025 and December 31, 2024.
These judgments include the determination that the Controlling Shareholder exercised control over both Greenstone and the Administrator and the determination that therefore the Reorganization Transaction was an internal reorganization of entities under common control and signified a continuation of BMC’s operations, rather than the initiation of new business activities.
(i) Share-based payment transactions
Equity-settled share-based payment arrangements
The Group measures the cost of equity-settled share-based payment transactions by reference to the fair value of the equity instruments on the date at which they are granted. Estimating fair value for share-based payment transactions requires determining the appropriate valuation model and considering the terms and conditions of the grant.
This estimate also requires determining the most appropriate inputs to the valuation model, including the expected life of the share option, volatility and dividend yield.
Where the Company granted the counterparty to a share-based payment award the choice of settlement in cash or shares, the equity component is measured as the difference between the fair value of the goods and services and the fair value of the cash-settled share-based payment liability at the date when the goods and services are received at the measurement date. For transactions with employees, the equity component is zero.
Option pricing models require the input of assumptions, including the expected price volatility. Changes in the subjective input assumptions can materially affect the fair value estimate. Therefore, the existing models may not necessarily provide a reliable single measure of the fair value of the Group’s share options.
Cash-settled share-based payment arrangements
The fair value of the amount payable to employees regarding share-based awards that will be settled in cash is recognized as an expense with a corresponding increase in liabilities over the period over which the employee becomes unconditionally entitled to payment. The liability is re-measured at each reporting date.
Any change in the fair value of the liability is recognized in profit or loss.
3.23 Accounting pronouncements
Standards recently adopted
Amendments to IAS 21
In 2023, the IASB issued amendments to IAS 21 The Effects of Changes in Foreign Exchange Rates, which creates a consistent approach in assessing whether a currency can be exchanged into another currency and, when it cannot, in determining the exchange rate to use and the disclosures required. The amendments clarify the treatment of exchange differences arising from the translation of foreign currency transactions. It specifies that exchange differences should be recognized in profit or loss unless they relate to a foreign operation, in which case they should be recognized in other comprehensive income.
F-22
Namib Minerals
Notes to the Financial Statements
3. Material accounting policies (cont.)
The Group adopted this standard on January 1, 2025. The amendments did not have a material impact on the Group’s consolidated annual consolidated financial statements. The Group determined that no other IAS standards, amendments to IAS standards, and interpretations to IAS standard adopted in the periods presented have a material impact on the Group’s consolidated annual financial statements
Disclosures about Uncertainties in the Financial Statements
In July 2024, the IASB published the Exposure Draft Climate related and Other Uncertainties in the Financial Statements, proposing illustrative examples on how entities apply existing IFRS requirements when reporting the effects of climate related and other uncertainties. After considering feedback, the IASB broadened the scope to cover uncertainties in general and, in November 2025, issued illustrative examples 1 – 4 and 6 – 8, with example 5 removed.
The Group reviewed the issued examples and determined that they provide clarification rather than introduce new accounting requirements. The application of these examples did not have a material impact on the Group’s consolidated annual financial statements.
Standard issued but not yet effective
Amendment to IFRS 9 and IFRS 7
In May 2024, the International Accounting Standards Board issued an amendment to IFRS 9 and IFRS 7, Classification and Measurement of Financial Instruments. This amendment intends to clarify the requirements for the timing of recognition and derecognition of some financial assets and liabilities, with a new exception for some financial liabilities settled through an electronic cash transfer system, clarify and add further guidance for assessing whether a financial asset meets the principal-and-interest-only payment (SPPI) criterion, add new disclosures for certain instruments with contractual terms that may change cash flows (such as some instruments with features linked to the achievement of environmental, social and governance (ESG) goals); and make updates to disclosures for equity instruments designated at fair value through other comprehensive income. The amendment is effective for reporting periods beginning on or after January 1, 2026, with earlier application permitted. The Group is currently assessing the impact of the new requirements under IFRS 7 and IFRS 9 on its consolidated financial statements. These amendments are not expected to have a material impact on the Group’s consolidated financial statements.
Annual improvements to IFRS Accounting Standards — Volume 11
On July 18, 2024 the International Accounting Standards Board (IASB) issued the Annual Improvements to IFRS Accounting Standards-Volume 11. The IASB’s annual improvements are limited to amendments that either clarify the wording of an IFRS standard or correct relatively minor unintended consequences, oversights or conflicts between requirements in the standards.
The amendments contained in the Annual Improvements relate to:
• IFRS 1 First-time Adoption of International Financial Reporting Standards — Hedge Accounting by a First-time Adopter
IFRS 7 Financial Instruments: Disclosures:
• Gain or loss on derecognition
• Disclosure of differences between the fair value and the transaction price
• Disclosures on credit risk
F-23
Namib Minerals
Notes to the Financial Statements
3. Material accounting policies (cont.)
IFRS 9 Financial Instruments:
• Derecognition of lease liabilities
• Transaction price
• IFRS 10 Consolidated Financial Statements — Determination of a ‘de facto agent’
• IAS 7 Statement of Cash Flows — Cost Method.
The amendment is effective for reporting periods beginning on or after January 1, 2026, with earlier application permitted. The Group is currently assessing the impact of the new requirements on its consolidated financial statements.
IFRS 18 Presentation and disclosure in Financial Statements
In April 2024, the International Accounting Standards Board issued IFRS 18, Presentation and disclosure in Financial Statements, which replaces IAS 1, Presentation of Financial Statements. The new standard is a result of the IASB’s Primary Financial Statements project, which is aimed at improving comparability and transparency of communication in financial statements. IFRS 18 introduces new requirements on presentation within the statement of profit or loss, including the specified totals and subtotals, requires disclosure of management-defined performance measures, and includes new requirements for aggregation and disaggregation of financial information. IFRS 18 is effective for reporting periods beginning on or after January 1, 2027, but earlier application is permitted and must be disclosed. The Group is currently assessing the impact of the new IFRS 18 requirements on its consolidated financial statements.
Amendment to IAS 21 — Translation to a Hyperinflationary Presentation Currency
The amendments are effective for annual reporting periods beginning on or after January 1, 2027, with earlier application permitted. The amendment specifies the translation procedures to be applied when an entity’s presentation currency is that of a hyperinflationary economy. The entity applies the amendments if its functional currency is that of a non-hyperinflationary economy and it is translating its results and financial position into the currency of a hyperinflationary economy. The amendment aims to improve the usefulness of the resulting information in a cost-effective manner. The amendment is not expected to have a material impact on the Group’s financial statements.
4. Reverse capitalization
On June 17, 2024, the Company entered into the Business Combination Agreement with Greenstone, HCVI, SPAC Merger Sub, and Greenstone Merger Sub, for a proposed Business Combination. Under the Business Combination Agreement, at the closing of the transactions contemplated by the Business Combination Agreement (the “Closing”), among other matters,
(a) SPAC Merger Sub merged with and into HCVI, with HCVI continuing as the surviving company bringing net assets of $
(b) Greenstone Merger Sub merged with and into Greenstone, with Greenstone continuing as the surviving company, and, in connection therewith, the ordinary shares of Greenstone (“Greenstone Shares”) issued and outstanding immediately prior to the Business Combination were cancelled in exchange for the right of the holders thereof to receive Ordinary Shares and the difference in value of $
F-24
Namib Minerals
Notes to the Financial Statements
4. Reverse capitalization (cont.)
(c) as a result of the mergers, HCVI and Greenstone each became wholly-owned subsidiaries of Namib, and Ordinary Shares were listed on the Nasdaq stock market, all upon the terms and subject to the conditions set forth in the Business Combination Agreement.
The Business Combination was approved by HCVI’s shareholders at the Extraordinary General Meeting on May 6, 2025. HCVI’s shareholders also voted to approve all other proposals presented at the Extraordinary General Meeting. On June 6, 2025, the Ordinary Shares commenced trading on the Nasdaq stock market under the symbol “NAMM”.
(d) As a result of the Business Combination:
(i) All outstanding HCVI Class A and Class B shares were cancelled in exchange for
(ii) Namib issued
(iii) The result of (i) and (ii) above was that
(iv) All outstanding Greenstone Shares were cancelled in exchange for
(v) The total increase in Namib Ordinary Shares was
The Business Combination was consummated on June 5, 2025. Following the Business Combination, the ownership structure of Namib was as follows:
|
Number of |
% of |
||||
|
Sponsor, Polar, and Permitted Transferees |
|
|
% |
||
|
Other Initial Shareholders |
|
|
% |
||
|
SPAC Public Stockholders |
|
|
% |
||
|
Greenstone Rollover Shares |
|
|
% |
||
|
Total |
|
|
% |
||
Reverse capitalization
As discussed in Note 1, the Business Combination was accounted for as a reverse acquisition. The consolidated assets, liabilities and results of operations are those of Greenstone for all prior periods presented. As such, the basic and diluted earnings per share related to Greenstone prior to the Business Combination have been retroactively restated based on shares reflecting the exchange ratio established in the Business Combination.
Share listing expenses under IFRS 2
As further discussed in Note 1, since the Business Combination was accounted for in accordance with IFRS 2, the difference in the fair value of the shares deemed to have been issued by the accounting acquirer and the fair value of the accounting acquiree’s identifiable net assets represented a service received by the accounting acquirer, and thus was recognized as a non-cash expense upon consummation of the Business Combination.
F-25
Namib Minerals
Notes to the Financial Statements
4. Reverse capitalization (cont.)
Upon Closing, the excess fair value of the equity interests deemed to have been issued to HCVI as consideration over the fair value of HCVI’s identifiable net liabilities was recognized as a listing expense in the amount of $
| Fair value of Ordinary Shares issued to HCVI Public Stockholders ( |
|
|
| Fair value of Ordinary Shares issued to HCVI Sponsor and Anchor Investors ( |
|
|
|
Fair value of all the consideration issued by target to acquire the HCVI |
|
|
|
Adjusted for net liabilities of HCVI |
|
|
|
Total share listing expense |
|
Other transaction-related costs in connection with the Business Combination
For the year ended December 31, 2025, and December 31, 2024, the Company incurred transaction-related costs in connection with the Business Combination of $
5. Revenue
|
How Mine |
Redwing Mine |
Total |
|||||||||||||||||
|
2025 |
2024 |
2023 |
2025 |
2024 |
2023 |
2025 |
2024 |
2023 |
|||||||||||
|
Gold sales |
$ |
|
|
|
|
|
|
|
|
||||||||||
|
Silver sales |
|
|
|
|
|
|
|
||||||||||||
|
Royalty revenue |
|
|
|
||||||||||||||||
|
Revenue recognized at a point in time |
$ |
|
|
|
|
|
|
|
|
||||||||||
|
|
|||||||||||||||||||
|
Total ounces of gold sold(1) |
|
|
|
|
|
|
|
|
|
||||||||||
|
Net work in progress (oz) |
|
|
|
|
|
|
|
||||||||||||
|
Gold produced (oz) |
|
|
|
|
|
|
|
|
|
||||||||||
|
Tonnes milled (kt) |
|
|
|
|
|
|
|
|
|
||||||||||
|
Grade (g/t) |
|
|
|
|
|
|
|
||||||||||||
|
Recovery (%) |
|
|
|
|
|
|
|
||||||||||||
|
Average net realized gold price ($/oz)(2) |
$ |
|
|
|
|
|
|
|
|
||||||||||
____________
(1)
(2)
*
F-26
Namib Minerals
Notes to the Financial Statements
6. Production costs
Production costs include salaries and wages on mine administration, consumable materials and electricity and other related costs incurred in the production of gold. Production costs for 2025, 2024, and 2023 are summarized below.
|
2025 |
2024 |
2023 |
|||||||
|
Staff costs (see Note 9) |
$ |
|
$ |
|
$ |
|
|||
|
Stores |
|
|
|
|
|
|
|||
|
Power production |
|
|
|
|
|
|
|||
|
Site administrative costs |
|
|
|
|
|
|
|||
|
Repairs and renewals |
|
|
|
|
|
|
|||
|
Fuel issues |
|
|
|
|
|
|
|||
|
Transport |
|
|
|
|
|
|
|||
|
Contract mining |
|
|
|
|
|
||||
|
Other |
|
|
|
|
|
||||
|
Production costs |
$ |
|
$ |
|
$ |
|
|||
7. Administrative expenses
|
2025 |
2024 |
2023 |
|||||||
|
Staff costs (see Note 9) |
$ |
|
$ |
|
$ |
|
|||
|
General and administrative costs |
|
|
|
|
|
|
|||
|
Fines and penalties |
|
|
|
|
|
|
|||
|
Bank charges |
|
|
|
|
|
|
|||
|
Fuel issues |
|
|
|
|
|
|
|||
|
Bad debts written off |
|
|
|
|
|||||
|
Directors’ fees |
|
|
|
|
|
|
|||
|
Welfare costs |
|
|
|
|
|
|
|||
|
Stores |
|
|
|
|
|
|
|||
|
Travel and accommodation(1) |
|
|
|
|
|
|
|||
|
Audit fees(2) |
|
|
|
|
|
|
|||
|
Non-audit fees |
|
|
|
|
|||||
|
Share based payments (see Note 9) |
|
|
|
|
|||||
|
Investor relations |
|
|
|
|
|||||
|
Loss on disposal of assets (see note 14) |
|
|
|
|
|
|
|||
|
Prepayment write down |
|
|
|
|
|||||
|
Legal fees(1) |
|
|
|
|
|
|
|||
|
Insurance |
|
|
|
|
|||||
|
Recruitment |
|
|
|
|
|||||
|
Filing fees |
|
|
|
|
|||||
|
Consultancy fees(1) |
|
|
|
|
|
|
|||
|
Inspection fees |
|
|
|
|
|||||
|
Environmental costs |
|
|
|
|
|||||
|
Administrative expenses |
$ |
|
$ |
|
$ |
|
|||
____________
(1) Included in consultancy, legal, audit and travel expenses of $
(2) Audit fees for 2025 comprise $
F-27
Namib Minerals
Notes to the Financial Statements
8. Foreign exchange (loss)/gain
|
2025 |
2024 |
2023 |
||||||||
|
Foreign exchange (loss)/gain |
$ |
( |
) |
$ |
|
$ |
|
|||
The unrealized portion of the foreign exchange (loss)/gain is $
On April 4, 2024, the Reserve Bank of Zimbabwe announced a new Monetary Policy Statement, introducing the ZiG currency as part of a multi-currency system and mandating its use for all pricing, debt recording, accounting, and domestic transactions. Concurrently, an inter-bank foreign exchange market was established, with the ZiG opening at an exchange rate of
9. Staff costs
The aggregate payroll costs of the employees charged in the consolidated statements of profit or loss and other comprehensive income were as follows:
|
2025 |
2024 |
2023 |
|||||||
|
Wages and salaries |
$ |
|
$ |
|
$ |
|
|||
|
Key management bonuses |
|
|
|
|
|||||
|
Share-based payments (Note 34) |
|
|
|
|
|
||||
|
Post-employment benefits |
|
|
|
|
|
|
|||
|
Social security contributions and similar taxes |
|
|
|
|
|
|
|||
|
Total (Note 6 & 7) |
$ |
|
$ |
|
$ |
|
|||
10. Other income
|
2025 |
2024 |
2023 |
||||||
|
Milling recoveries and royalties |
$ |
|
|
$ |
|
|||
|
Contract mining |
|
|
|
|||||
|
Insurance proceeds |
|
|
|
|
||||
|
Rental income |
|
|
|
|
|
|||
|
Scrap sales |
|
|
|
|
|
|||
|
Rehabilitation provision adjustment (see note 21) |
|
|
|
|||||
|
First aid competitions |
|
|
|
|||||
|
Mine rescue funding |
|
|
|
|||||
|
Other income |
$ |
|
|
$ |
|
|||
11. Finance cost
Of the total finance costs, $
|
2025 |
2024 |
2023 |
||||||
|
Interest expense, (see Note 24) |
$ |
|
|
$ |
|
|||
|
Interest expense, other creditors |
|
|
|
|
|
|||
|
Interest expense, unpaid tax |
|
|
|
|
||||
|
Unwinding of discount (see Note 21) |
|
|
|
|
|
|||
|
Finance cost |
$ |
|
|
$ |
|
|||
F-28
Namib Minerals
Notes to the Financial Statements
12. Taxation
12.1 Taxation expense
|
2025 |
2024 |
2023 |
|||||||
|
Current tax charge(1) |
$ |
|
$ |
|
$ |
|
|||
|
Deferred tax charge |
|
|
|
|
|
|
|||
|
Taxation expense |
$ |
|
$ |
|
$ |
|
|||
____________
(1)
12.2 Reconciliation of tax rate
|
2025 |
2024 |
2023 |
||||||||||
|
Profit before taxation |
$ |
|
|
$ |
|
|
$ |
|
|
|||
|
Taxation expense at statutory rate(1) |
|
|
|
|
|
|
|
|
|
|||
|
Nondeductible expenses: |
|
|
|
|
|
|
||||||
|
Intermediary money transfer tax |
|
|
|
|
|
|
|
|
|
|||
|
Disallowed entertainment and staff welfare cost |
|
|
|
|
|
|
|
|
|
|||
|
Credit loss allowances on intergroup receivables |
|
|
|
|
|
|
|
|
||||
|
Loss on asset disposal |
|
|
|
|
|
|
|
|||||
|
Remeasurement of financial guarantee |
|
|
|
( |
) |
|
( |
) |
||||
|
Penalties and interest |
|
|
|
|
|
|
|
|
|
|||
|
Death benefit |
|
|
|
|
|
|
|
|
||||
|
Stock obsolescence |
|
|
|
|
|
|
|
|||||
|
Disallowed costs |
|
|
|
|
|
|
|
|||||
|
Other |
|
|
|
|
|
|
|
|||||
|
Withholding taxes on dividend |
|
( |
) |
|
|
|
|
|
||||
|
Deferred tax assets not recognized |
|
|
|
|
|
|
|
|
|
|||
|
Change in tax rate |
|
|
|
|
|
|
|
|||||
|
Taxation expense |
$ |
|
|
$ |
|
|
$ |
|
|
|||
____________
(1)
12.3
|
2025 |
2024 |
|||||||
|
Reconciliation of current tax liabilities |
|
|
|
|
||||
|
Beginning balance, January 1 |
$ |
|
|
$ |
|
|
||
|
Current tax charge |
|
|
|
|
|
|
||
|
Unrealized exchange loss(gain) |
|
|
|
|
( |
) |
||
|
Penalties and Interest accrued |
|
|
|
|
|
|
||
|
VAT refunds offset against current tax liabilities |
|
( |
) |
|
( |
) |
||
|
Closing balance, December 31 |
|
( |
) |
|
( |
) |
||
|
Current tax paid |
$ |
|
|
$ |
|
|
||
|
Withholding tax paid |
|
|
|
|
|
|
||
|
Total tax paid |
$ |
|
|
$ |
|
|
||
F-29
Namib Minerals
Notes to the Financial Statements
12. Taxation (cont.)
12.4 Deferred tax liability
|
2025 |
2024 |
|||||||
|
Property plant and equipment |
$ |
|
|
$ |
|
|
||
|
Credit loss allowances |
|
( |
) |
|
( |
) |
||
|
Provision for rehabilitation cost |
|
( |
) |
|
( |
) |
||
|
Unrealized exchange gains |
|
( |
) |
|
|
|
||
|
Leave pay provision |
|
( |
) |
|
( |
) |
||
|
Death Benefit |
|
( |
) |
|
|
|||
|
Provision for stock obsolescence |
|
( |
) |
|
|
|||
|
Estimated tax losses |
|
( |
) |
|
( |
) |
||
|
Deferred tax assets not recognized |
|
|
|
|
|
|
||
|
Deferred tax liability |
$ |
|
|
$ |
|
|
||
|
2025 |
2024 |
|||||||
|
Reconciliation of deferred tax liability |
|
|
|
|
||||
|
Beginning balance, January 1 |
$ |
|
|
$ |
|
|
||
|
Property plant and equipment |
|
|
|
|
|
|
||
|
Credit loss allowances |
|
( |
) |
|
( |
) |
||
|
Provision for rehabilitation cost |
|
( |
) |
|
( |
) |
||
|
Unrealized exchange gains |
|
( |
) |
|
( |
) |
||
|
Leave pay provision |
|
|
|
|
( |
) |
||
|
Death Benefit |
|
( |
) |
|
|
|||
|
Provision for stock allowance |
|
( |
) |
|
|
|||
|
Estimated tax losses |
|
( |
) |
|
( |
) |
||
|
Deferred tax assets not recognized |
|
|
|
|
|
|
||
|
Ending balance, December 31 |
$ |
|
|
$ |
|
|
||
12.5 Unrecognized deferred tax assets
|
2025 |
2024 |
|||||
|
Unrecognized deferred tax assets |
$ |
|
$ |
|
||
12.6 Value of estimated tax losses available for set off against future taxable income
|
2025 |
2024 |
|||||
|
Value of estimated tax losses |
$ |
|
$ |
|
||
F-30
Namib Minerals
Notes to the Financial Statements
13. Earnings per share
Refer to Note 1 for more information on the Reorganization Transaction that occurred on June 6, 2025.
Basic and diluted earnings per share for the years ended December 31, 2025, 2024 and 2023 were calculated as follows:
|
2025 |
2024 |
2023 |
||||||||
|
Profit for the year attributable to owners of the Group (basic and diluted) |
$ |
|
$ |
|
|
$ |
|
|||
|
Basic weighted average shares number of shares (thousands) |
|
|
|
|
* |
|
|
|||
|
Diluted weighted average number of shares (thousands) |
|
|
|
|
|
|
|
|||
|
Basic earnings per share |
$ |
|
$ |
|
|
$ |
|
|||
|
Diluted earnings per share |
|
|
|
|
|
|
|
|||
____________
*
Basic earnings per share (EPS) is calculated by dividing profit or loss attributable to owners of the Group by the weighted average shares outstanding during the period. Diluted EPS reflects the potential dilution that might occur if various instruments were converted into shares.
This table reconciles the weighted average number of shares for basic EPS to those used for dilutive EPS purposes. There were no dilutive instruments for the years ended December 31, 2024 and 2023.
|
2025 |
2024 |
2023 |
|||||
|
Weighted average number of shares |
|
|
|
|
|||
|
Adjustments: |
|
||||||
|
Promissory note |
|
|
|||||
|
Warrants |
|
||||||
|
Earnout liability |
|
||||||
|
PSUs |
|
||||||
|
Equity-settled RSUs |
|
|
|||||
|
Compound RSUs |
|
|
|||||
|
Total weighted average number of shares |
|
|
|
|
|||
|
Diluted earnings per share |
$ |
|
|
|
|||
Impact of promissory note (see Note 26)
• Promissory note: For basic EPS, the future Ordinary Shares that could be issued to settle the promissory note are excluded until the ordinary shares are issued (if ever). For diluted EPS, because the Company can choose to settle the debt in cash or ordinary shares at any time, it is presumed that the liability will be settled in ordinary shares. The total number of ordinary shares that could be issued is included in diluted earnings per share. No adjustments were made to the numerator because the liability is interest-free. The balance at year end is included in trade payables.
Impact of Warrants and Earnout liability on EPS calculation
• Warrants: For basic EPS, the Warrants are not included in the calculation until they are exercised into shares. For diluted EPS, Warrants are included in the calculation to the extent they are in the money as of the reporting date and have a dilutive effect. In that instance, the numerator is adjusted for the fair value changes that would have occurred if warrants had been classified entirely as an equity instrument, net of tax effect while a denominator impact is determined using the treasury stock method. The exercise price exceeds the average share price, therefore the Warrants are out of the money. As they are anti-dilutive,
F-31
Namib Minerals
Notes to the Financial Statements
13. Earnings per share (cont.)
• Earnout liability: Earnout Shares are contingently issuable shares. They are not included in the denominator of basic EPS until the performance conditions for their issuance have been met at the end of the reporting period. When those conditions are satisfied, the shares will be included in basic EPS. For diluted EPS, contingently issuable shares are included in diluted EPS if the conditions would be satisfied if the reporting date were the end of the contingency period. As none of the conditions had been met, the contingently issuable shares would not have been issued. Therefore, no adjustment has been made to either the numerator or the denominator. A maximum of
See Note 25 — Warrants and Note 35 — Earnout liability for further information.
Impact of PSUs and RSUs on EPS calculation (see note 34)
• PSUs: the Performance Stock Units (“PSUs”) are contingently issuable shares. They are not included in the denominator of basic EPS until the performance conditions for their issuance have been met at the end of the reporting period. When those conditions are satisfied, the shares will be included in basic EPS. For diluted EPS, contingently diluted issuable shares are included in diluted EPS if the conditions would be satisfied if the reporting date were the end of the contingency period. As none of the conditions had been met, the contingently issuable PSUs would not have been issued. Therefore, no adjustment has been made to either the numerator or the denominator. A maximum of
• Equity-settled RSUs: For basic EPS, the equity-settled Restricted Stock Unit (“RSUs”) are excluded until the Ordinary Shares are issued. The number of shares expected to vest are included in diluted EPS. No adjustments were made to numerator.
• Compound RSUs: For basic EPS, the compound RSUs are excluded until the Ordinary Shares are issued (if ever). For diluted EPS, it is presumed that the contract will be settled in Ordinary Shares, and the resulting potential Ordinary Shares are included in diluted earnings per share if the effect is dilutive. No adjustments were made to the numerator.
14. Property, plant and equipment
|
Cost |
Mining |
Buildings |
Plant & |
Motor |
Capital |
Total |
|||||||||||
|
Balance at January 1, 2024 |
|
|
|
|
|
|
|
|
|
|
|
||||||
|
Additions(1) |
|
|
|
|
|
|
|
|
|
|
|||||||
|
Change in rehabilitation asset estimate (see note 21) |
|
|
|
|
|
|
|
||||||||||
|
Transfer into/within of property, plant and equipment (see note 15) |
|
|
|
|
|
|
( |
) |
|
|
|||||||
|
Scrapping of Assets/Decommissioning |
( |
) |
( |
) |
( |
) |
|
( |
) |
||||||||
|
Balance at December 31, 2024(2) |
|
|
|
|
|
|
|
|
|
|
|
||||||
|
|
|
|
|
|
|||||||||||||
|
Balance at January 1, 2025 |
|
|
|
|
|
|
|
|
|
|
|
||||||
|
Additions(1) |
|
|
|
|
|
|
|
|
|
|
|
||||||
|
Change in rehabilitation asset estimate (see note 21) |
|
|
|
|
|
|
|
||||||||||
|
Transfer into/within of property, plant and equipment (see note 15) |
|
|
|
|
|
( |
) |
|
|
||||||||
|
Scrapping of Assets/Decommissioning |
|
( |
) |
|
|
( |
) |
||||||||||
|
Balance at December 31, 2025(2) |
|
|
|
|
|
|
|
|
|
|
|
||||||
F-32
Namib Minerals
Notes to the Financial Statements
14. Property, plant and equipment (cont.)
|
Accumulated depreciation and |
Mining |
Buildings |
Plant & |
Motor |
Capital |
Total |
||||||||||
|
At January 1, 2024 |
|
|
|
|
|
|
|
|
|
|
||||||
|
Depreciation |
|
|
|
|
|
|
|
|
|
|||||||
|
Impairment |
|
|
|
|
|
|
||||||||||
|
Scrapping of Assets/Decommissioning |
( |
) |
( |
) |
( |
) |
( |
) |
||||||||
|
At December 31, 2024(2) |
|
|
|
|
|
|
|
|
|
|
||||||
|
|
|
|
|
|||||||||||||
|
At January 1, 2025 |
|
|
|
|
|
|
|
|
|
|
||||||
|
Depreciation |
|
|
|
|
|
|
|
|
|
|||||||
|
Impairment |
|
|
|
|
|
|
||||||||||
|
Scrapping of Assets/Decommissioning |
|
( |
) |
|
( |
) |
||||||||||
|
At December 31, 2025(2) |
|
|
|
|
|
|
|
|
|
|
||||||
|
Carrying value |
Mining |
Buildings |
Plant & |
Fittings & |
Capital |
Total |
||||||||||||
|
At December 31, 2024 |
$ |
|
$ |
|
$ |
|
$ |
|
$ |
|
$ |
|
||||||
|
At December 31, 2025 |
$ |
|
$ |
|
$ |
|
$ |
|
$ |
|
$ |
|
||||||
____________
(1)
(2)
In 2015 and 2018, the Redwing and Mazowe Mines experienced severe flooding and structural damage, leading to the suspension of operations in March 2019. These events caused significant physical damage to infrastructure and equipment, rendering them non-operational and resulting in a sharp decline in expected cash flows.
Due to the lack of reliable fair value estimates, the Group recognized full impairment losses on substantially all property, plant and equipment at Redwing and Mazowe in 2019 and 2018, respectively. In 2025, updated LOM and rehabilitation cost estimates led to change in estimate to property, plant and equipment assets, of $
15. Exploration and evaluation assets
|
2025 |
2024 |
|||||||
|
Opening Balance – Cost(1) |
$ |
|
|
$ |
|
|
||
|
Additions |
|
|
|
|
|
|
||
|
Transfers to property, plant and equipment (see Note 14) |
|
( |
) |
|
( |
) |
||
|
Closing Balance – Cost |
|
|
|
|
|
|
||
|
Accumulated Impairment |
|
( |
) |
|
( |
) |
||
|
Carrying value |
$ |
|
|
$ |
|
|
||
____________
(1) — Historical impairment was due to severe flooding and structural damage, which led to the suspension of operations of the Redwing and Mazowe Mines in 2019 (see Note 14).
F-33
Namib Minerals
Notes to the Financial Statements
16. Prepayments
16.1 Short-term prepayments
|
2025 |
2024 |
|||||
|
Inventory |
$ |
|
$ |
|
||
|
Prepaid expenses |
|
|
|
|
||
|
Short-term prepayments |
$ |
|
$ |
|
||
16.2 Long-term prepayments
|
2025 |
2024 |
|||||
|
Property, plant, and equipment |
$ |
|
$ |
|
||
|
Long-term prepayments |
$ |
|
$ |
|
||
17. Inventories
|
2025 |
2024 |
|||||||
|
Consumables(1) |
$ |
|
|
$ |
|
|
||
|
Allowance for inventory write-down(2) |
|
( |
) |
|
( |
) |
||
|
Gold stockpile |
|
|
|
|
|
|
||
|
Gold in progress(3) |
|
|
|
|
|
|
||
|
Inventories |
$ |
|
|
$ |
|
|
||
____________
(1)
(2)
(3)
18. Trade and other receivables
|
2025 |
2024 |
|||||||
|
Royalty receivables |
$ |
|
|
$ |
|
|
||
|
Trade receivables |
|
|
|
|
|
|
||
|
Staff loan receivables |
|
|
|
|
|
|
||
|
Other receivables |
|
|
|
|
|
|
||
|
VAT receivables(1) |
|
|
|
|
|
|
||
|
Allowance for credit losses |
|
( |
) |
|
( |
) |
||
|
Trade and other receivables, net |
$ |
|
|
$ |
|
|
||
____________
(1)
The Group’s trade receivables balance primarily relates to gold sales with Fidelity who is the Group’s sole customer. Fidelity settles all amounts within 30 days, and therefore there is no expected credit loss to be recognized in either 2025 or 2024.
The Group’s royalty receivables balance relates to a subcontracting arrangement through which the Group earned a royalty on precious metals extracted by a third-party miner from the Redwing Mine. The Group’s cumulative expected credit losses for 2025 and 2024 mainly related to royalty receivables and arose because of the inability to collect payments from a subcontractor. Of the $
F-34
Namib Minerals
Notes to the Financial Statements
18. Trade and other receivables (cont.)
Allowance for credit losses
|
2025 |
2024 |
|||||||
|
Opening Balance |
$ |
|
|
$ |
|
|
||
|
Additions |
|
|
|
|
|
|
||
|
Recovery of prior ECL |
|
( |
) |
|
( |
) |
||
|
Closing Balance |
$ |
|
|
$ |
|
|
||
19. Trade and other payables
|
2025 |
2024 |
|||||
|
Trade payables(2) |
$ |
|
$ |
|
||
|
Employee payables |
|
|
|
|
||
|
Other taxes and social security payments(1) |
|
|
|
|
||
|
VAT payable |
|
|
|
|
||
|
Accruals |
|
|
|
|
||
|
Trade and other payables |
$ |
|
$ |
|
||
____________
(1)
(2)
20. Cash and cash equivalents
|
2025 |
2024 |
||||||
|
Petty cash |
$ |
|
$ |
|
|
||
|
Bank balances |
|
|
|
|
|
||
|
Cash and cash equivalents |
|
|
|
|
|
||
|
Bank overdraft |
|
|
( |
) |
|||
|
Cash and cash equivalents, net |
$ |
|
$ |
( |
) |
||
In the current year, bank overdraft ($
Banc ABC Zimbabwe
Overdraft Facility Agreement
In July 2024, the Group entered into an overdraft facility agreement with Banc ABC Zimbabwe (“Overdraft Facility Agreement”) for an overdraft limit of $
As of December 2025, Banc ABC Zimbabwe is rated BBB with Outlook by ICRA Rating Agency DMCC, reflecting moderate credit risk within the local banking environment.
F-35
Namib Minerals
Notes to the Financial Statements
21. Provision for rehabilitation costs
Site restoration relates to the estimated cost of closing down the mines and projects and represents the site and environmental restoration costs estimated to be paid as a result of mining activities or previous mining activities. For the How Mine, site restoration costs are capitalized to property, plant and equipment with an increase in the provision at the net present value of the estimated future and inflated cost of site rehabilitation. Subsequently the capitalized costs are amortized over the life of the mine and the provision is unwound over the period to estimated restoration. Redwing and Mazowe site restoration costs are capitalized to property, plant and equipment with an increase in the provision at the net present value of the estimated future and inflated cost of site rehabilitation.
|
2025 |
2024 |
|||||
|
Beginning balance, January 1 |
$ |
|
$ |
|
||
|
Unwinding of discount (see Note 11) |
|
|
|
|
||
|
Change in estimate |
|
|
|
|
||
|
Ending balance, December 31 |
$ |
|
$ |
|
||
The discount rate used in calculating the present value of the How Mine’s provision for rehabilitation costs is based on U.S. treasury bond rates, and the cash flows are estimated at an average
The change in estimate arose following a reassessment of the estimated mine rehabilitation costs upon closure of the mines as at December 31, 2025. The reassessment was undertaken due to changes in contractor rates as well as an increase in disturbed areas resulting from ongoing mining activities. This change in estimate of $
22. Contingent liabilities
The Group is subject to various claims that arise in the normal course of business. The Group has determined the risk of loss related to the current claims is remote. Accordingly, no contingent liabilities have been recognized or disclosed for the years ended December 31, 2025, or 2024.
F-36
Namib Minerals
Notes to the Financial Statements
23. Commitments
The Group funds its contractual commitments through cash from operating activities and from debt.
As at the reporting date, the Group had contractual capital commitments relating primarily to the implementation of its enterprise resource planning system, being Microsoft Dynamics 365, feasibility studies at Redwing and Mazowe Mines, which are required to support the planned resumption of operations, equipment at How Mine to support operations and short term leases which are immaterial.
|
2025 |
2024 |
|||||
|
Commitments |
$ |
|
$ |
|
||
24. Borrowings
|
2025 |
2024 |
|||||
|
Banc ABC Zimbabwe loan(1) |
$ |
|
$ |
|
||
|
Short-term notes(2) |
|
|
|
|||
|
Directors and Officers insurance(3) |
|
|
|
|||
|
Bank overdraft(4) |
|
|
|
|||
|
|
|
|
|
|||
|
|
|
|||||
|
Non-current |
$ |
|
$ |
|
||
|
Current |
|
|
|
|
||
|
|
|
|
|
|||
____________
(1) On October 15, 2025, Bulawayo Mining Company (Private) Limited entered into a facility agreement (“Facility Agreement”) with African Banking Corporation of Zimbabwe Limited (Banc ABC) for a global facility limit of $
To secure the Facility Agreement, the Group has provided the following collateral: a $
The Facility Agreement imposes covenants on the Group, including the obligation to channel monthly deposits of at least $
(2)
(3)
(4)
F-37
Namib Minerals
Notes to the Financial Statements
24. Borrowings (cont.)
|
Net debt movement |
Borrowings |
Overdraft |
Total |
|||||||||
|
Net debt – January 1, 2024 |
$ |
|
|
$ |
|
$ |
|
|
||||
|
Cash flows |
|
|
|
|
|
|
||||||
|
New loans (proceeds)(1) |
|
|
|
|
|
|
|
|
||||
|
Interest paid – presented in operating activities |
|
( |
) |
|
|
|
( |
) |
||||
|
Repayment of borrowings (principal) – presented in financing activities |
|
( |
) |
|
|
|
( |
) |
||||
|
Non-cash flows |
|
|
|
|
|
|
||||||
|
Direct payments to suppliers(1) |
|
|
|
|
|
|
|
|
||||
|
Interest accrual |
|
|
|
|
|
|
|
|
||||
|
Repayment of borrowings by supplier directly (principal) |
|
( |
) |
|
|
|
( |
) |
||||
|
Fees charged against borrowings |
|
|
|
|
|
|
|
|
||||
|
Net debt – December 31, 2024 |
$ |
|
|
$ |
|
$ |
|
|
||||
|
Cash flows |
|
|
|
|
|
|
||||||
|
New loans (proceeds)(1) |
|
|
|
|
|
|
|
|
|
|||
|
Interest paid – presented in operating activities |
|
( |
) |
|
( |
) |
|
( |
) |
|||
|
Repayment of borrowings (principal) – presented in financing activities |
|
( |
) |
|
|
|
( |
) |
||||
|
Non-cash flows |
|
|
|
|
|
|
||||||
|
Direct payments to suppliers(1) |
|
|
|
|
|
|
|
|
||||
|
Fees charged against borrowings |
|
|
|
|
|
|
|
|
||||
|
Interest accrual |
|
|
|
|
|
|
|
|
|
|||
|
Net debt – December 31, 2025 |
$ |
|
|
$ |
|
|
$ |
|
|
|||
____________
(1)
25. Derivative liability (warrants)
Pursuant to Business Combination Agreement, the Company issued Warrants as a replacement for SPAC Warrants. Each SPAC Warrant issued by HCVI ceased to represent a right to acquire the number of shares of common stock of HCVI and was converted into a right to acquire the same number of the Ordinary Shares on substantially the same terms as were in effect immediately prior to the close of the Business Combination. The Warrants were not considered part of the consideration and were classified as derivative liabilities as they did not meet the equity classification requirements under IAS 32. All changes in fair value are reflected in profit and loss. (see note 1). Each Warrant became exercisable; provided that the Company has an effective registration statement.
As of June 5, 2025, the Warrants were recognized at a fair value of million. As of December 31, 2025, the fair value of these warrants was million, resulting in a remeasurement gain of $
The impact of warrants on earnings per share is explained in Note 13 — Earnings per share. The IFRS 13 fair value disclosures are included in Note 35 — Earnout liability.
F-38
Namib Minerals
Notes to the Financial Statements
26. Share capital
Based on the second amended and restated memorandum of association the Group’s authorized share capital consists of
|
($ represent unrounded amounts) |
Number of |
Amount |
|||
|
January 1, 2024 |
|
$ |
|
||
|
Shares issued |
|
||||
|
December 31, 2024 |
|
$ |
|
||
|
|
|||||
|
January 1, 2025 |
|
|
|
||
|
Issuance of shares to HCVI shareholders upon reverse capitalization(1) |
|
|
|
||
|
Impact of reverse capitalization(1) |
|
|
|
||
|
Issue of shares for promissory note(2) |
|
|
|
||
|
December 31, 2025 |
|
$ |
|
||
This describes the nature and purpose of each reserve.
| Reserve | Description and purpose | |
| Share capital | The nominal value of shares issued. | |
| Share premium/other reserves(3) | This combines shares premium relating to shares issued and the impact of transactions recognized in equity (see notes 1 and 4). | |
| Retained earnings/deficit | Cumulative net gains and losses recognized in the consolidated statements of profit or loss and other comprehensive income plus the corresponding entry for the equity-settled share-based payment expenses recognized |
____________
(1)
(2)
(3)
The share premium and other reserves reconcile as follows:
|
2025 |
2024 |
||||||
|
Share premium |
$ |
|
|
$ |
|||
|
Other reserves |
$ |
( |
) |
$ |
|||
|
|
( |
) |
|
||||
F-39
Namib Minerals
Notes to the Financial Statements
27. Financial instruments and risk management
The Group has exposure to the following risks that arise from its use of financial instruments:
• Currency risk;
• Liquidity risk;
• Credit risk;
• Capital risk; and
• Interest rate risk.
Refer to Note 3 for discussion on how the Group measures financial assets and financial liabilities initially and subsequently.
|
2025 |
2024 |
|||||
|
Financial assets at amortized cost |
|
|
||||
|
Amounts due from related parties (see note 29) |
$ |
$ |
|
|||
|
Trade and other receivables (excluding VAT receivables) (see note 18) |
|
|
|
|
||
|
Excise duty indemnification (see note 1) |
|
|
|
|||
|
Cash and cash equivalents (see note 20) |
|
|
|
|
||
|
Staff loan receivables |
|
|
|
|
||
|
|
|
|
|
|||
|
|
|
|||||
|
Trade and other payables (excluding VAT payable and employee payables) (see note 19) |
|
|
|
|
||
|
Amounts due to related parties (see note 29) |
|
|
|
|
||
|
Bank overdraft (see note 20) |
|
|
|
|||
|
Excise duty payable (see note 1) |
|
|
|
|||
|
Borrowings (see note 24) |
|
|
|
|
||
|
Total |
|
|
|
|
||
|
Financial liabilities at fair value through profit or loss |
|
|
||||
|
|
|
|||||
|
Derivative liability (warrants) (see note 25) |
|
|
|
|||
|
Earnout liability (see note 35) |
|
|
|
|||
|
Total |
$ |
|
$ |
|||
Currency risk
The Group is exposed to currency risk on transactions settled or paid in currencies other than its functional currency. The exposure to currency risk is primarily related to transactions paid or settled in ZiG. The Group conducts a limited number of transactions which are paid or settled in ZAR, but these transactions do not pose a material currency risk due to the limited volume. To reduce exposure to currency fluctuation, the Group seeks to settle obligations due in local currency (ZiG) from recent sales settled in local currency. Movement in currency rates could expose the Group to additional foreign exchange gain or loss.
F-40
Namib Minerals
Notes to the Financial Statements
27. Financial instruments and risk management (cont.)
The table below indicates consolidated monetary assets/(liabilities) in the Group denominated in ZIG
|
2025 |
2024 |
|||||||
|
Trade and other receivables |
$ |
|
|
$ |
|
|
||
|
Cash and cash equivalents |
|
|
|
|
|
|
||
|
Amount due from related parties |
|
|
|
|
|
|||
|
Current tax liability |
|
( |
) |
|
( |
) |
||
|
Trade and other payables |
|
( |
) |
|
( |
) |
||
|
Total |
$ |
|
|
$ |
( |
) |
||
Sensitivity analysis —
|
Strengthening |
Weakening |
||||||
|
December 31, 2025 |
$ |
|
$ |
( |
) |
||
|
December 31, 2024 |
$ |
|
$ |
( |
) |
||
The table below indicates consolidated monetary liabilities in the Group denominated in ZAR:
|
2025 |
2024 |
|||||||
|
Trade and other payables |
$ |
( |
) |
$ |
( |
) |
||
|
Total |
$ |
( |
) |
$ |
( |
) |
||
Sensitivity analysis —
|
Strengthening |
Weakening |
||||||
|
December 31, 2025 |
$ |
|
$ |
( |
) |
||
|
December 31, 2024 |
$ |
|
$ |
( |
) |
||
Liquidity risk
Liquidity risk is the risk that the Group may fail to meet its obligations when they fall due, the consequences of which may be the failure to meet obligations to creditors. Prudent liquidity risk management implies maintaining sufficient cash and cash equivalents, the availability of funding through an adequate amount of committed credit facilities and the ability to close out market positions. The Group manages liquidity risk by maintaining adequate cash reserves and available borrowing facilities by continuously monitoring actual and forecast cash flows and matching the maturity profiles of financial assets and liabilities. Adequate banking facilities are maintained. Borrowing facilities are negotiated with approved financial institutions at acceptable interest rates.
|
December 31, 2025 |
Less than |
12-24 Months |
Greater than |
Total |
|||||
|
Trade and other payables |
$ |
|
|
||||||
|
Borrowings |
|
|
|
|
|
||||
|
Amounts due to related parties |
|
|
|
||||||
|
Excise tax payable |
|
|
|
||||||
|
Total |
$ |
|
|
|
|
||||
F-41
Namib Minerals
Notes to the Financial Statements
27. Financial instruments and risk management (cont.)
|
December 31, 2024 |
Less than |
12-24 Months |
Greater than |
Total |
||||||||
|
Trade and other payables |
$ |
|
$ |
$ |
$ |
|
||||||
|
Borrowings |
|
|
|
|
|
|
|
|
||||
|
Amounts due to related parties |
|
|
|
|
|
|
||||||
|
Bank overdraft |
|
|
|
|
|
|
||||||
|
Total |
$ |
|
$ |
|
$ |
|
$ |
|
||||
Credit risk
Credit risk refers to the risk that a counterparty will default on its contractual obligations resulting in financial loss to the consolidated entity. Credit risk arises from the Group’s trade and other receivables, net as well as amounts due from related parties. The carrying amount of financial assets as disclosed in the statements of financial position and related notes represents the maximum credit exposure.
|
December 31, 2025 |
Gross |
ECL |
Total |
|||||
|
Financial assets |
|
|
||||||
|
Trade and other receivables |
|
|
( |
) |
|
|||
|
Cash and cash equivalents |
|
|
|
|
||||
|
Staff loan receivables |
|
|
|
|
||||
|
Amount due from related parties |
|
|
( |
) |
||||
|
Excise duty indemnification |
|
|
|
|
||||
|
Total |
$ |
|
( |
) |
|
|||
|
December 31, 2024 |
Gross |
ECL |
Total |
|||||||
|
Financial assets |
|
|
|
|
||||||
|
Amounts due from related parties |
$ |
|
$ |
( |
) |
$ |
|
|||
|
Trade and other receivables |
|
|
|
( |
) |
|
|
|||
|
Cash and cash equivalents |
|
|
|
|
|
|
||||
|
Staff loan receivables |
|
|
|
|
|
|
||||
|
Total |
$ |
|
$ |
( |
) |
$ |
|
|||
The Group’s financial assets primarily relate to amounts due from related parties and trade receivables. The Group’s risk over the collectability of trade receivables is generally low, as substantially all of the Group’s sales of precious metals are to a single customer, Fidelity, which is a Zimbabwean governmental entity which has never paid outside of their contractually agreed credit terms of 30 days.
Credit risk exposure on trade receivables with customers other than Fidelity is generally higher, as such receivables are subject to collection risks in the normal course of business. As disclosed in Note 18, substantially all of the Group’s receivables recognized in relation to a contract with third-party miners, was provided for over the course of 2023 and 2022. The Group also holds credit risk on amounts receivable from related parties which may experience insolvency or liquidity issues; however, such risks are partially mitigated through the Group’s ability to negotiate with affected parties to settle balances with payables due to the same party. Refer to Note 29 for discussion regarding recognition of credit losses on related party receivables from Metallon.
F-42
Namib Minerals
Notes to the Financial Statements
27. Financial instruments and risk management (cont.)
Capital risk
The Group considers its capital to comprise its ordinary share capital and retained deficit. In managing its capital, the Group’s primary objective is to maintain a sufficient funding base to enable the Group to meet its working capital and strategic investment needs. The Group is not subject to any externally imposed capital requirements as at December 31, 2025 and 2024. The Group’s objective when managing capital is to safeguard the Group’s ability to continue as a going concern, so that it can provide returns for shareholders and benefits to other stakeholders. In order to maintain or adjust the capital structure, the Group may adjust the amount of dividends paid to shareholders, return capital to shareholders, issue new shares, or sell assets to reduce debt.
Interest rate risk
The risk of interest rate changes associated with the Group’s long-term debt and short-term borrowings would not have a material impact on the Group’s consolidated financial statements.
28. Dividends
The following dividends were declared by the Group and issuable to Metallon, the Group’s former parent company prior to the Reorganization Transaction described in Note 1, during the year ended December 31, 2025 and 2024 ($ in thousands, except per share amounts):
|
2025 |
2024 |
|||||
| $ |
$ |
$ |
|
|||
____________
(1)
For the year ended December 31, 2024, the Group declared $
The following dividends were paid by the Group during the ended December 31, 2025 and 2024 and were issued to Metallon:
|
2025 |
2024 |
|||||
| $ |
$ |
$ |
|
|||
29. Related party information
The Southern SelliBen Trust (“Trust”), Mzi Khumalo, Nostro Heritage Foundation, South Rivers Foundation, and Red Richmond Foundation are former shareholders of Greenstone and are now shareholders of Namib.
Refer to note 28 for information on dividends to related parties and to note 36 for subsequent events that affect a related party.
Related party receivables and payables
The Group’s related party payables relate to expenses incurred by the Group which were paid by Metallon, Metallon Management Services, and Metallon Gold Zimbabwe, an affiliate of Metallon. Mzi Khumalo is a significant shareholder of all entities. As of December 31, 2025, an offset agreement is in place between the
F-43
Namib Minerals
Notes to the Financial Statements
29. Related party information (cont.)
Group and Metallon, allowing the Group to net its receivable and payable balances held with Metallon. All amounts are non-cash flows.
|
Related party receivables |
2025 |
2024 |
||||||
|
Metallon Corporation Limited |
$ |
|
|
$ |
|
|
||
|
Metallon Corporation Limited (US) |
|
|
|
|
|
|||
|
Metallon Management Services |
|
|
|
|
|
|
||
|
Allowance for related party credit losses |
|
( |
) |
|
( |
) |
||
|
Total |
$ |
|
$ |
|
|
|||
|
Related party payables |
2025 |
2024 |
||||
|
Metallon Corporation Limited |
$ |
$ |
|
|||
|
Metallon Gold Zimbabwe |
|
|
|
|
||
|
Metallon Management Services |
|
|
|
|||
|
Total |
$ |
|
$ |
|
||
The Group incurred related party credit losses of $
|
Allowance for related party credit losses |
||||
|
Balance as of December 31, 2023 |
$ |
|
|
|
|
Additions |
|
|
|
|
|
Reversal |
|
( |
) |
|
|
Balance as of December 31, 2024 |
|
|
|
|
|
Additions |
|
|
||
|
Reversal |
|
|
||
|
Balance as of December 31, 2025 |
$ |
|
|
|
Purchase of residential properties
Bulawayo Mining Company (Private) Limited has historically occupied residential properties owned by Metallon Gold Zimbabwe (Private) Limited (“MGZ”), a related party. During the year, MGZ offered these properties for sale to Bulawayo Mining Company (Private) Limited for $
With effect from January 1, 2025, MGZ commenced charging rental for the use of the properties. Accordingly, rental expense of $48k for the period from January 1, 2025 to September 30, 2025 has been recognised in profit or loss. On September 30, 2025, Bulawayo Mining Company (Private) Limited completed the acquisition of the properties and recognised the assets in property, plant and equipment (see Note 14), together with the corresponding transfer entries. The transactions were conducted on an arm’s length basis and in accordance with agreed terms between the parties.
F-44
Namib Minerals
Notes to the Financial Statements
29. Related party information (cont.)
Key management personnel compensation
The amounts disclosed in the table below represent the compensation to key management personnel for the years ended December 31, 2025, and 2024.
|
2025 |
2024 |
|||||
|
Short-term employee benefits |
$ |
|
$ |
|
||
|
Key management bonuses |
|
|
|
|||
|
Non-executive director fees (Namib Minerals) |
|
|
|
|||
|
Non-executive director fees (BMC Zim) |
|
|
|
|
||
|
Share based payments (see Note 34) |
|
|
|
|
||
|
Post-employment benefits |
|
|
|
|
||
|
Key management compensation |
$ |
|
$ |
|
||
Effective July 1, 2024, the key management remuneration was expanded to include the costs of an additional three members of management, which have been reflected above for the year ended December 31, 2024. At December 31, 2025, amounts totaling $
30. Employment benefits
Defined contribution plan
All permanent employees are members of defined contributions plans administered by either the National Industrial Council for the Mining Industry of Zimbabwe or the Old Mutual staff pension fund. Contributions are at the rate of
|
2025 |
2024 |
|||||
|
Contributions for the year |
$ |
|
$ |
|
||
National Social Security Scheme
A subsidiary of the Group, Bulawayo Gold Zimbabwe (Private) Limited, makes contributions to the National Social Security Scheme, a defined benefit pension scheme promulgated under the National Social Security Act of 1989.
|
2025 |
2024 |
|||||
|
Contributions for the year |
$ |
|
$ |
|
||
In the fourth quarter of 2025, the Group hired new employees in the United States who participate in a defined contribution 401(k) retirement plan, under which the Company contributes
31. Segment reporting
The Group currently identifies four reportable segments which consist of each of its
F-45
Namib Minerals
Notes to the Financial Statements
31. Segment reporting (cont.)
Performance is measured based on operating profit/loss, as included in the internal management reports that are reviewed by the Group’s CEO. Segment operating profit or loss is used to measure performance as management believes that such information is the most relevant in evaluating the operating performance of each segment relative to other entities that operate within these industries. The accounting policies of the reportable segments are the same as the Group’s accounting policies.
An IFRIC Agenda Decision which deals with the Disclosure of Revenues and Expenses for Reportable Segments resulted in amounts being more disaggregated in the segment report.
|
How Mine |
Redwing Mine |
Mazowe Mine |
Other |
Total |
|||||||||||||||||||||||||||
|
2025 |
2024 |
2025 |
2024 |
2025 |
2024 |
2025 |
2024 |
2025 |
2024 |
||||||||||||||||||||||
|
Revenue |
$ |
|
|
|
|
|
|
|
|
|
|
|
|
|
|
|
|||||||||||||||
|
Production costs |
|
( |
) |
( |
) |
|
( |
) |
|
|
|
|
( |
) |
( |
) |
|||||||||||||||
|
Depreciation |
|
( |
) |
( |
) |
( |
) |
( |
) |
( |
) |
( |
) |
|
|
( |
) |
( |
) |
||||||||||||
|
Royalties |
|
( |
) |
( |
) |
|
( |
) |
|
|
|
|
( |
) |
( |
) |
|||||||||||||||
|
Gross profit (loss) |
|
|
|
|
|
( |
) |
|
|
( |
) |
( |
) |
|
|
|
|
|
|
||||||||||||
|
Other income |
|
|
|
|
|
|
|
|
|
|
|
|
|
|
|
|
|
|
|
||||||||||||
|
Impairment |
|
|
|
|
( |
) |
( |
) |
( |
) |
|
|
( |
) |
( |
) |
|||||||||||||||
|
Administrative expenses |
|
( |
) |
( |
) |
( |
) |
( |
) |
( |
) |
( |
) |
( |
) |
( |
) |
( |
) |
( |
) |
||||||||||
|
Staff costs |
|
|
|
( |
) |
( |
) |
( |
) |
( |
) |
( |
) |
( |
) |
( |
) |
( |
) |
||||||||||||
|
General and administrative costs |
|
|
|
( |
) |
( |
) |
( |
) |
( |
) |
( |
) |
|
( |
) |
( |
) |
|||||||||||||
|
Fines and penalties |
|
|
( |
) |
|
( |
) |
|
|
( |
) |
|
( |
) |
( |
) |
|||||||||||||||
|
Bank charges |
|
( |
) |
( |
) |
( |
) |
( |
) |
( |
) |
( |
) |
|
|
( |
) |
( |
) |
||||||||||||
|
Fuel issues |
|
|
|
( |
) |
( |
) |
|
( |
) |
|
|
( |
) |
( |
) |
|||||||||||||||
|
Directors’ fees |
|
( |
) |
( |
) |
|
|
|
|
( |
) |
|
( |
) |
( |
) |
|||||||||||||||
|
Welfare costs |
|
|
|
( |
) |
( |
) |
( |
) |
( |
) |
|
|
( |
) |
( |
) |
||||||||||||||
|
Stores |
|
|
|
( |
) |
( |
) |
|
|
|
|
( |
) |
( |
) |
||||||||||||||||
|
Travel |
|
( |
) |
|
( |
) |
( |
) |
|
|
( |
) |
( |
) |
( |
) |
( |
) |
|||||||||||||
|
Audit fees |
|
( |
) |
|
( |
) |
|
( |
) |
|
( |
) |
( |
) |
( |
) |
( |
) |
|||||||||||||
|
Non-Audit fees |
|
( |
) |
|
|
|
|
|
|
|
( |
) |
|
||||||||||||||||||
|
Legal fees |
|
|
|
|
|
|
|
( |
) |
( |
) |
( |
) |
( |
) |
||||||||||||||||
|
Share based payment |
|
|
|
|
|
|
|
( |
) |
|
( |
) |
|
||||||||||||||||||
|
Investor relations |
|
|
|
|
|
|
|
( |
) |
|
( |
) |
|
||||||||||||||||||
|
Loss on disposal of assets |
|
( |
) |
( |
) |
|
|
|
|
|
|
( |
) |
( |
) |
||||||||||||||||
|
Prepayment write down |
|
( |
) |
|
|
|
|
|
|
|
( |
) |
|
||||||||||||||||||
|
Consultancy fees |
|
( |
) |
( |
) |
|
|
|
|
( |
) |
( |
) |
( |
) |
( |
) |
||||||||||||||
|
Filing fees |
|
|
|
|
|
|
|
( |
) |
|
( |
) |
|
||||||||||||||||||
|
Insurance |
|
|
|
|
|
|
|
( |
) |
|
( |
) |
|
||||||||||||||||||
|
Recruitment |
|
|
|
|
|
|
|
( |
) |
|
( |
) |
|
||||||||||||||||||
|
Bad debts written off |
|
|
|
|
( |
) |
|
( |
) |
|
|
|
( |
) |
|||||||||||||||||
|
Allowance for credit losses |
|
|
|
( |
) |
( |
) |
|
|
|
|
( |
) |
( |
) |
||||||||||||||||
|
Listing expenses |
|
|
|
|
|
|
|
( |
) |
|
( |
) |
|
||||||||||||||||||
|
Foreign exchange gains/(losses) |
|
|
|
|
|
|
|
|
|
( |
) |
|
|
( |
) |
|
( |
) |
|
|
|||||||||||
|
Change in fair value of earnout liability |
|
|
|
|
|
|
|
|
|
|
|
|
|
||||||||||||||||||
|
Change in fair value of warrants |
|
|
|
|
|
|
|
|
|
|
|
|
|
||||||||||||||||||
|
Operating profit/(loss) |
|
|
|
|
|
( |
) |
( |
) |
( |
) |
( |
) |
|
|
( |
) |
|
|
|
|
||||||||||
|
Finance cost |
|
( |
) |
( |
) |
( |
) |
( |
) |
( |
) |
( |
) |
( |
) |
( |
) |
( |
) |
( |
) |
||||||||||
|
Related party credit loss |
|
|
( |
) |
|
|
|
|
|
|
|
|
|
( |
) |
||||||||||||||||
|
Interest income |
|
|
|
|
|
|
|
|
|
|
|
|
|
|
|
||||||||||||||||
|
Financial guarantee remeasurement |
|
|
|
|
|
|
|
|
|
|
|
|
|
||||||||||||||||||
|
Profit/(loss) before taxation |
|
|
|
|
|
( |
) |
( |
) |
( |
) |
( |
) |
|
|
( |
) |
|
|
|
|
||||||||||
|
Income tax (expense)/income |
|
( |
) |
( |
) |
|
|
|
|
|
|
( |
) |
( |
) |
( |
) |
||||||||||||||
|
Profit/(loss) for the year |
$ |
|
|
|
|
( |
) |
( |
) |
( |
) |
( |
) |
|
|
( |
) |
|
|
|
|
||||||||||
F-46
Namib Minerals
Notes to the Financial Statements
31. Segment reporting (cont.)
|
How Mine |
Redwing Mine |
Mazowe Mine |
Other |
Total |
|||||||||||||||||
|
2025 |
2024 |
2025 |
2024 |
2025 |
2024 |
2025 |
2024 |
2025 |
2024 |
||||||||||||
|
Segment assets |
$ |
|
|
|
|
|
|
|
|
|
|||||||||||
|
Current assets |
|
|
|
|
|
|
|
|
|
|
|||||||||||
|
Non-current assets |
|
|
|
|
|
|
|
|
|
|
|||||||||||
|
Segment liabilities |
|
|
|
|
|
|
|
|
|
|
|
||||||||||
|
Current liabilities |
|
|
|
|
|
|
|
|
|
|
|
||||||||||
|
Non-current liabilities |
|
|
|
|
|
|
|
|
|
|
|||||||||||
32. Financial guarantee
On September 27, 2023, the Group executed an agreement (the “Africorp Guarantee”) with Africorp Solutions And Advisory (Pty) Ltd (“Africorp”) to guarantee Metallon Corporation Limited outstanding loans withdrawn during 2021 (the “Metallon Term Loans”), which consisted of an aggregate principal amount of $
The Africorp Guarantee has been accounted for by the Group as a financial guarantee contract under IFRS 9, under which the Group is required to initially measure the guarantee at fair value and will subsequently measure the guarantee to the higher of (i) the amount of the loss allowance determined in accordance with the impairment requirements of IFRS 9 and (ii) the amount initially recognized less, the cumulative amount of income recognized in accordance with the principles of IFRS 15. Based on the Group’s analysis upon the execution of the Africorp Guarantee, the Group determined an ECL should be recognized for the full $
The Group revised its analysis of the ECL as of December 31, 2023, and determined the ECL should reflect the remaining outstanding balance of the Metallon Term Loans of $
On June 17, 2024, concurrent with the execution of the Reorganization Transaction (Note 1), Africorp issued a “Deed of Release”, which released the Group of all obligations under the Africorp Guarantee. As a result, the Group recorded a reversal of the remaining $
33. Going concern
As of the reporting date, the Group’s current liabilities exceed its current assets by $
F-47
Namib Minerals
Notes to the Financial Statements
33. Going concern (cont.)
Management has assessed the Group’s ability to continue as a going concern, considering its financial position, operating environment, and cash flow projections until December 2026.
How Mine (operational since 1941) continues to generate profits and positive cash flows. Production is expected to continue to increase in 2026, further improving the Group’s cash flow. Namib Minerals (Bulawayo Mining Company Private Ltd’s parent company as described in Note 1) and the Group’s cash flow largely stems from How Mine. Management’s forecast for the next twelve months indicates positive cash flows, including funds to settle Redwing and Mazowe current liabilities as described in Note 31. Management has conducted sensitivity analyses on potential gold price fluctuations and confirmed that the Group will maintain positive cash flows.
The ongoing conflict in the Middle East has increased global economic uncertainty, particularly through higher energy prices, supply chain pressures, and inflation, which may increase the Group’s operating costs. In Zimbabwe, this may impact the cost of key inputs such as consumables, equipment, and labour. The Group has not experienced any direct disruption to operations to date. Management continues to monitor developments; however, based on current assessments, the directors are satisfied that the Group has adequate resources to continue as a going concern.
Based on the results of the above-mentioned cash flow assessments, management is satisfied that the Group can continue as a going concern in the foreseeable future, realizing its assets and discharging its liabilities in the normal course of business. Management will continue to monitor risks and adjust strategies as necessary.
During 2025, the Group has drawn $
34. Share based payment
The total share-based payment expense is as follows:
|
2025 |
2024 |
|||
|
2021 unvested awards |
|
|||
|
2025: |
||||
|
PSUs |
|
|||
|
Equity-settled RSUs |
|
|||
|
Compound RSUs |
|
|||
|
Total |
|
|
||
|
Recognized as an expense (see note 9) |
|
|
||
|
Classified within equity |
|
|
||
|
Classified as a liability |
|
|||
|
Total |
|
|
34.1 FY 2024 Unvested Awards
On October 14, 2021 (the “Effective Date”), the Controlling Shareholder of Metallon entered into share award agreements (the “Share Award Agreements”) with senior executives of Metallon (the “Senior Executives”), which provided the Senior Executives with the right to obtain ordinary shares in Metallon and full beneficial ownership of a certain amount of ordinary shares of Metallon (the “Shares”). The Share Award Agreements contained provisions which provided for automatic transfer of the Shares, and beneficial ownership rights granted thereunder, to any successor entity in the event of a corporate reorganization, merger, acquisition or other change in ownership. Among the Share Award Agreements issued, only one award contained vesting conditions (the “Unvested Award”), and all other awards were deemed fully vested (the “Vested Awards”) on the Effective Date. The Share Award Agreements were determined to be share-based payments in accordance with IFRS 2 and the associated compensation cost for
F-48
Namib Minerals
Notes to the Financial Statements
34. Share based payment (cont.)
the Vested Awards was recognized on the Effective Date. Due to certain terms and conditions within the Unvested Award which introduced uncertainty regarding the vesting period, a grant date, in accordance with IFRS 2, was not established on the Effective Date and no compensation cost was recognized.
On June 15, 2024, substantially concurrent with the Reorganization Transaction (refer to Note 1) completed on June 17, 2024, a share exchange was completed whereby the Senior Executives exchanged their rights to the Shares in Metallon for a fixed number of Greenstone Shares. The Greenstone Shares were transferred to the Senior Executives by the Controlling Shareholder which, prior to such transfer, held
Restrictive Share Units and Performance Units
Certain executive and non-executive directors within the Group were granted RSUs and PSUs pursuant to provisions of the Namib Minerals Equity Plan.
34.2 Performance Stock Units
All PSUs were granted and approved at the discretion of the Compensation Committee of the Board of Directors. PSUs include a market-based performance condition determined on the grant date. The PSUs granted during the year include a market-based performance condition based on the Company’s Relative Total Shareholder Return (TSR) measured against a designated benchmark index over the measurement period of
The number of PSUs that vest may range from
PSUs have rights to dividends only after they have vested.
F-49
Namib Minerals
Notes to the Financial Statements
34. Share based payment (cont.)
The PSUs issued during the current period are settled solely through the issuance of Ordinary Shares at fair market value upon vesting.
| 2025 | ||
| Share units granted: | PSUs | |
| Grant Date | December 13, 2025 | |
| Vesting Date | December 6, 2027 | |
| Number of units granted | |
34.3 Restrictive Stock Units
34.3.1 Equity-settled RSUs
Equity-settled RSUs vest in accordance with the terms of the RSU grant agreements, provided that the relevant service conditions have been met. Upon vesting, each RSU is settled through the issuance of
RSU holders are entitled to receive dividends only after they have vested. In the current year, the fair value of RSUs granted was determined based on the grant-date share price of $
| 2025 | ||
| Share units granted: | RSUs | |
| Grant Date | October 6, 2025 | |
| Vesting Date | April 1, 2026 | |
| Number of units granted | |
34.3.2 Compound RSUs
Compound Restrictive Share Units (“CRSUs”) provide employees with a choice of settlement method upon vesting. In terms of the 2025 CRSU agreements, vested units may be settled (i) through the issuance of Ordinary Shares , or (ii) on a cashless basis, with the value of the vested units transferred to a retirement fund, pension fund, or another approved investment fund, subject to the receipt of necessary third-party approvals.
Under IFRS 2, CRSUs are accounted for as compound instruments, comprising both an equity component (representing the option to receive shares) and a liability component (representing the option to elect cashless settlement). The equity component is measured at grant date and recognized over the vesting period, while the liability component is remeasured at each reporting date and at settlement, with changes recognized in profit or loss. Consistent with equity-settled RSUs, the fair value of CRSUs granted in the current year was based on the Company’s grant-date share price.
| 2025 | ||
| Share units granted: | RSUs | |
| Grant Date | December 6, 2025 | |
| Vesting Date | 50%: December 6, 2026 | |
| Number of units granted | |
F-50
Namib Minerals
Notes to the Financial Statements
34. Share based payment (cont.)
This table summarizes additional information for the PSUs, equity-settled RSUs and the compound RSUs:
| December 31, 2025 | PSUs | Equity-settled | Compound RSUs | |||
| Vesting Period | 2 Years | 6 months | 2 Years | |||
| Maximum term of options | 2 years | 6 Months | 2 Years | |||
| Method of settlement | Equity | Equity | Choice of equity or cashless basis (investment in an approved investment fund) | |||
| Classification | Equity-settled | Equity-settled | Compound: equity-settled and cash-settled | |||
| Reconciliation: | ||||||
| Outstanding at beginning of the period | ||||||
| Granted during the period | | | | |||
| Forfeited during the period | ||||||
| Expired during the period | ||||||
| Outstanding at end of the period | | | | |||
| Weighted average exercise price | ||||||
| Weighted average remaining contractual life | | | |
35. Earnout liability
Refer to Notes 1(c) and 4 which explain the earnout liability and the Business Combination.
In accordance with the terms of the Business Combination Agreement, the Former Greenstone Shareholders are entitled to receive up to 30.0 million Earnout Shares during the Company Earnout Period. The Earnout Shares are contingent upon the achievement of specific operational and valuation milestones, as disclosed in Note 1(c). In the event of a change of control of the Company during the Company Earnout Period, all such milestones shall be deemed to have been satisfied and any Earnout Shares not previously issued shall be issued immediately prior to the consummation of such change of control. The arrangement is accounted for as a derivative financial liability and is not considered part of consideration for the business combination. It is revalued at each reporting date to reflect fair market value, with any changes recorded in profit or loss.
The earnout liability was calculated based on the expected timing of achievement of the operational and valuation milestones. As of June 5, 2025, the Group recognized the earnout liability at a fair value of $
|
Earnout |
||||
|
Fair value as of June 5, 2025 |
$ |
|
|
|
|
Fair value as of December 31, 2025 |
|
|
|
|
|
Change in fair value of earnout liability (gain) |
$ |
( |
) |
|
The decrease in the earnout liability since June 5, 2025 was a result of:
• the decrease in value of shares ($
• the probabilities relating to milestone 5 were decreased to
F-51
Namib Minerals
Notes to the Financial Statements
35. Earnout liability (cont.)
The fair value of the earnout liability was determined using a probability-weighted undiscounted cash flow approach with no discount rate adjustment, considering the probability of achieving milestones (Level 3 input), and using the assumed stock price (Level 1 input: $
• A stock price range of $
• A decrease in the probability of achieving milestones (excluding milestone 5) by
• If the probability of achieving milestones (excluding milestone 5) was increased to
All amounts are non-cash flows.
The impact of the earnout liability on earnings per share is included in Note 13 — Earnings per share.
IFRS 13 disclosures — financial instruments measured at fair value on a recurring basis
The Group’s financial instruments that are measured at fair value are:
• Derivative liability (warrants) — see Note 25: and
• Earnout liability — as per this note.
There were no such instruments in the year ended December 31, 2024.
Quantitative disclosures about the fair value measurements for each class of assets and liabilities
December 31, 2025
|
December 31, 2025 |
Fair value measurements at the end of the |
||||||
|
Level 1 |
Level 2 |
Level 3 |
|||||
|
Recurring fair value measurements |
|
||||||
|
Derivative liability (warrants) |
$ |
|
|||||
|
Earnout liability |
$ |
|
|||||
|
$ |
|
|
|||||
Reconciliation of fair value measurements categorized within level 3 of the fair value hierarchy
|
2025 |
||||
|
Opening balance |
$ |
|
||
|
Issued |
|
|
|
|
|
Gains and losses recognized in profit or loss |
|
( |
) |
|
|
Closing balance |
|
|
|
|
The Group’s policy is to recognise transfers into and out of fair value hierarchy levels at the end of the reporting period. There were no transfers between levels 1 and 2 during the year. Other than as indicated above, there were no transfers into and out of level 3.
F-52
Namib Minerals
Notes to the Financial Statements
36. Subsequent events
Management has evaluated subsequent events through March 31, 2026, which is the date these financial statements were issued.
1. As of 2026, the Group drew down an additional $
2. On January 1, 2026, the Government announced a revision to the gold royalty framework, whereby the royalty rate applicable to gold producers will increase from
3. On March 13, 2026, Ibrahima Tall resigned as Chief Executive Officer of the Company and entered into a settlement agreement with the Group. Under the terms of the agreement, Mr. Tall will receive cash consideration of approximately $
4. Namib Minerals commenced dewatering at the Redwing Mine in January 2026 to enable access to underground workings for assessment and restart planning. The programme is progressing in line with expectations and represents a key step toward the potential resumption of operations.
5. The ongoing conflict in the Middle East has increased global economic uncertainty, particularly through higher energy prices, supply chain pressures, and inflation, which may increase the Group’s operating costs. In Zimbabwe, this may impact the cost of key inputs such as consumables, equipment, and labour. The Group has not experienced any direct disruption to operations to date. Management continues to monitor developments; however, based on current assessments, the directors are satisfied that the Group has adequate resources to continue as a going concern.
6.
7. Molly P. Zhang (aka Peifang Zhang) resigned as a director of the Company, effective April 1, 2026.
F-53
PART II
INFORMATION NOT REQUIRED IN PROSPECTUS
Item 6. Indemnification of Directors and Officers
Cayman Islands law does not limit the extent to which a company’s articles of association may provide for indemnification of officers and directors, except to the extent any such provision may be held by the Cayman Islands courts to be contrary to public policy, such as to provide indemnification against civil fraud or the consequences of committing a crime. Namib Minerals’ Organizational Documents permit indemnification of officers and directors for any liability, action, proceeding, claim, demand, costs, damages or expenses, including legal expenses, incurred in their capacities as such unless such liability (if any) arises from dishonesty, willful default or fraud which may attach to such directors or officers. This standard of conduct is generally the same as permitted under the Delaware General Corporation Law for a Delaware corporation.
In addition, Namib Minerals maintains standard policies of insurance under which coverage is provided to its directors and officers against the cost of defense, settlement or payment of a judgment in some circumstances and insures us against our obligations to indemnify our officers and directors.
Insofar as indemnification for liabilities arising under the Securities Act may be permitted to directors, officers or persons controlling us pursuant to the foregoing provisions, Namib Minerals has been informed that in the opinion of the SEC such indemnification is against public policy as expressed in the Securities Act and is theretofore unenforceable.
Item 7. Recent Sales of Unregistered Securities
On September 30, 2025, in reliance upon the exemption provided by Section 4(a)(2) of the Securities Act, the Company entered issued a Promissory Note to Cohen & Company Securities, LLC (“Cohen”) pursuant to which the Company may satisfy its obligations thereunder in cash or Ordinary Shares, with such Ordinary Shares priced at the time of issuance in accordance with the formula set forth in such Promissory Note. As of April 1, 2026, the Company has issued 805,228 Ordinary Shares to Cohen pursuant to the Promissory Note.
In 2023 and 2024, Red Rock entered into the Polar Subscription Agreements pursuant to which Polar agreed to, among other things, make cash contributions in an aggregate amount of $2.65 million to Red Rock to cover Red Rock’s working capital expenses in exchange for the issuance of 880,000 shares of common stock of Red Rock (or the surviving entity in a business combination) and, at the election of Polar, either cash or additional shares of Red Rock. On June 5, 2025, in connection with the Closing of the Business Combination, the Company issued to Polar 880,000 Ordinary Shares pursuant to the Polar Subscription Agreements.
The Company issued 1,000 Ordinary Shares to the SelliBen Trust at par value of $1.00 per share in connection with the Company’s formation in reliance upon the exemption provided by Section 4(a)(2) of the Securities Act.
Item 8. Exhibits and Financial Statement Schedules
|
Exhibit |
Description |
|
|
2.1# |
||
|
2.2 |
II-1
|
Exhibit |
Description |
|
|
2.3 |
||
|
3.1 |
||
|
4.1 |
||
|
4.2 |
||
|
4.3 |
||
|
4.4 |
||
|
4.5 |
||
|
4.6 |
||
|
5.1* |
||
|
10.1 |
||
|
10.2 |
||
|
10.3 |
||
|
10.4 |
||
|
10.5+ |
||
|
10.6+ |
||
|
10.7 |
II-2
|
Exhibit |
Description |
|
|
10.8 |
||
|
10.9 |
||
|
10.10 |
||
|
10.11 |
||
|
21.1 |
||
|
23.1** |
Consent of BDO South Africa Incorporated, independent public accountant to Namib Minerals. |
|
|
23.2* |
||
|
23.3** |
||
|
96.1** |
How Mine S-K 1300 Technical Summary Report, effective as of December 31, 2025. |
|
|
96.2** |
Mazowe Mine S-K 1300 Technical Summary Report, effective as of December 31, 2023. |
|
|
96.3** |
Redwing Mine S-K 1300 Technical Summary Report, effective as of December 31, 2023. |
|
|
101. INS** |
Inline XBRL Instance Document |
|
|
101. SCH** |
Inline XBRL Taxonomy Extension Schema Document |
|
|
101. CAL** |
Inline XBRL Taxonomy Extension Calculation Linkbase Document |
|
|
101. DEF** |
Inline XBRL Taxonomy Extension Definition Linkbase Document |
|
|
101. LAB** |
Inline XBRL Taxonomy Extension Label Linkbase Document |
|
|
101. PRE** |
Inline XBRL Taxonomy Extension Presentation Linkbase Document |
|
|
104** |
Cover Page Interactive Data Filed (embedded within the Inline XBRL document) |
|
|
107* |
____________
* Previously filed.
** Filed herewith
# Certain schedules, annexes and exhibits have been omitted pursuant to Item 601(b)(2) of Regulation S-K but will be furnished supplementally to the SEC upon request.
+ Indicates management contract or compensatory plan or arrangement.
Item 9. Undertakings
The undersigned registrant hereby undertakes:
(1) To file, during any period in which offers or sales are being made, a post-effective amendment to this registration statement:
(i) To include any prospectus required by Section 10(a)(3) of the Securities Act;
(ii) To reflect in the prospectus any facts or events arising after the effective date of the registration statement (or the most recent post-effective amendment thereof) which, individually or in the aggregate, represent a fundamental change in the information set forth in the registration statement. Notwithstanding the foregoing, any increase or decrease in volume of securities offered (if the total dollar value of securities offered would not exceed that which was registered) and any deviation from the low or high end of the estimated maximum offering range may be reflected in the form of prospectus filed with the Commission pursuant to Rule 424(b) if, in the aggregate,
II-3
the changes in volume and price represent no more than 20% change in the maximum aggregate offering price set forth in the “Calculation of Registration Fee” table in the effective registration statement; and
(iii) To include any material information with respect to the plan of distribution not previously disclosed in the registration statement or any material change to such information in the registration statement.
(2) That, for the purpose of determining any liability under the Securities Act, each such post-effective amendment shall be deemed to be a new registration statement relating to the securities offered therein, and the offering of such securities at that time shall be deemed to be the initial bona fide offering thereof.
(3) To remove from registration by means of a post-effective amendment any of the securities being registered which remain unsold at the termination of the offering.
(4) To file a post-effective amendment to the registration statement to include any financial statements required by Item 8.A. of Form 20-F at the start of any delayed offering or throughout a continuous offering. Financial statements and information otherwise required by Section 10(a)(3) of the Securities Act need not be furnished; provided, that the registrant includes in the prospectus, by means of a post-effective amendment, financial statements required pursuant to this paragraph and other information necessary to ensure that all other information in the prospectus is at least as current as the date of those financial statements;
(5) That, for the purpose of determining liability under the Securities Act to any purchaser,
(i) if the registrant is relying on Rule 430B;
(A) each prospectus filed by the registrant pursuant to Rule 424(b)(3) shall be deemed to be part of the registration statement as of the date the filed prospectus was deemed part of and included in the registration statement; and
(B) each prospectus required to be filed pursuant to Rule 424(b)(2), (b)(5), or (b)(7) as part of a registration statement in reliance on Rule 430B relating to an offering made pursuant to Rule 415(a)(1)(i), (vii), or (x) for the purpose of providing the information required by section 10(a) of the Securities Act shall be deemed to be part of and included in the registration statement as of the earlier of the date such form of prospectus is first used after effectiveness or the date of the first contract of sale of securities in the offering described in the prospectus. As provided in Rule 430B, for liability purposes of the issuer and any person that is at that date an underwriter, such date shall be deemed to be a new effective date of the registration statement relating to the securities in the registration statement to which that prospectus relates, and the offering of such securities at that time shall be deemed to be the initial bona fide offering thereof; provided, however, that no statement made in a registration statement or prospectus that is part of the registration statement or made in a document incorporated or deemed incorporated by reference into the registration statement or prospectus that is part of the registration statement will, as to a purchaser with a time of contract of sale prior to such effective date, supersede or modify any statement that was made in the registration statement or prospectus that was part of the registration statement or made in any such document immediately prior to such effective date;
(ii) if the registrant is subject to Rule 430C, each prospectus filed pursuant to Rule 424(b) as part of a registration statement relating to an offering, other than registration statements relying on Rule 430B or other than prospectuses filed in reliance on Rule 430A, shall be deemed to be part of and included in the registration statement as of the date it is first used after effectiveness. Provided, however, that no statement made in a registration statement or prospectus that is part of the registration statement or made in a document incorporated or deemed incorporated by reference into the registration statement or prospectus that is part of the registration statement will, as to a
II-4
purchaser with a time of contract of sale prior to such first use, supersede or modify any statement that was made in the registration statement or prospectus that was part of the registration statement or made in any such document immediately prior to such date of first use.
(6) That, for the purpose of determining liability of the registrant under the Securities Act to any purchaser in the initial distribution of the securities, the undersigned registrant undertakes that in a primary offering of securities of the undersigned registrant pursuant to this registration statement, regardless of the underwriting method used to sell the securities to the purchaser, if the securities are offered or sold to such purchaser by means of any of the following communications, the undersigned registrant will be a seller to the purchaser and will be considered to offer or sell such securities to such purchaser:
(i) Any preliminary prospectus or prospectus of the undersigned registrant relating to the offering required to be filed pursuant to Rule 424;
(ii) Any free writing prospectus relating to the offering prepared by or on behalf of the undersigned registrant or used or referred to by the undersigned registrant;
(iii) The portion of any other free writing prospectus relating to the offering containing material information about the undersigned registrant or its securities provided by or on behalf of the undersigned registrant; and
(iv) Any other communication that is an offer in the offering made by the undersigned registrant to the purchaser.
Insofar as indemnification for liabilities arising under the Securities Act may be permitted to directors, officers and controlling persons of the registrant pursuant to the foregoing provisions, or otherwise, the registrant has been advised that in the opinion of the SEC such indemnification is against public policy as expressed in the Securities Act and is, therefore, unenforceable. In the event that a claim for indemnification against such liabilities (other than the payment by the Registrant of expenses incurred or paid by a director, officer or controlling person of the Registrant in the successful defense of any action, suit or proceeding) is asserted by such director, officer or controlling person in connection with the securities being registered, the Registrant will, unless in the opinion of its counsel the matter has been settled by controlling precedent, submit to a court of appropriate jurisdiction the question whether such indemnification by it is against public policy as expressed in the Securities Act and will be governed by the final adjudication of such issue.
The undersigned Registrant hereby undertakes that:
(1) For purposes of determining any liability under the Securities Act, the information omitted from the form of prospectus filed as part of this registration statement in reliance upon Rule 430A and contained in a form of prospectus filed by the registrant pursuant to Rule 424(b)(1) or (4) or 497(h) under the Securities Act shall be deemed to be part of this registration statement as of the time it was declared effective.
(2) For the purpose of determining any liability under the Securities Act of 1933, each post-effective amendment that contains a form of prospectus shall be deemed to be a new registration statement relating to the securities offered therein, and the offering of such securities at that time shall be deemed to be the initial bona fide offering thereof.
II-5
SIGNATURES
Pursuant to the requirements of the Securities Act of 1933, the registrant certifies that it has reasonable grounds to believe that it meets all of the requirements for filing on Form F-1 and has duly caused this registration statement to be signed on its behalf by the undersigned, thereunto duly authorized, in the City of New York, State of New York, on April 2, 2026.
|
NAMIB MINERALS |
||||
|
By: |
/s/ Tulani Sikwila |
|||
|
Name: |
Tulani Sikwila |
|||
|
Title: |
Chief Executive Officer and Chief Financial Officer |
|||
Pursuant to the requirements of the Securities Act of 1933, as amended, this registration statement has been signed below by the following persons in the capacities and on the dates indicated.
|
Signature |
Title |
Date |
||
|
/s/ Tulani Sikwila |
Chief Executive Officer, Chief Financial Officer and Director |
April 2, 2026 |
||
|
Tulani Sikwila |
(Principal Executive Officer, Principal Financial Officer and Principal Accounting Officer) |
|||
|
/s/ Ibrahima Tall |
Director |
April 2, 2026 |
||
|
Ibrahima Tall |
||||
|
* |
Chief Legal Officer and Director |
April 2, 2026 |
||
|
Siphesihle Mchunu |
||||
|
* |
Director |
April 2, 2026 |
||
|
Dennis A. Johnson |
||||
|
* |
Director |
April 2, 2026 |
||
|
Tito Botelho Martins Júnior |
|
*By: |
/s/ Ibrahima Tall |
|||||
|
Name: |
Ibrahima Tall |
|||||
|
Title: |
Attorney-in-Fact |
|||||
II-6
AUTHORIZED REPRESENTATIVE
Pursuant to the requirements of Section 6(a) of the Securities Act of 1933, as amended, this registration statement on Form F-1 has been signed on behalf of the registrant by the undersigned, solely in his capacity as the duly authorized representative of the registrant in the United States, on April 2, 2026.
|
Cogency Global Inc. |
||||
|
Authorized U.S. Representative |
||||
|
By: |
/s/ Colleen A. DeVries |
|||
|
Name: |
Colleen A. DeVries |
|||
|
Title: |
Senior Vice President on behalf of Cogency Global Inc. |
|||
II-7
Exhibit 23.1
Consent of Independent Registered Public Accounting Firm
We hereby consent to the use in the Prospectus constituting a part of this Registration Statement of our report dated April 2, 2026, relating to the consolidated financial statements of Namib Minerals (the Company), which is contained in that Prospectus.
We also consent to the reference to us under the caption “Experts” in the Prospectus.
| /s/ BDO South Africa Incorporated | |
| BDO South Africa Incorporated | |
| Johannesburg, South Africa | |
| Date: April 2, 2026 |
Exhibit 23.3

WSP Australia Pty Limited (“WSP”)
Level 27, 680 George Street, Sydney, NSW, 2000, Australia
CONSENT OF QUALIFIED PERSON
Regarding (i) the technical report summary titled How Mine S-K 1300 Technical Report Summary with an effective date of 31 December 2025; (ii) the technical report summary titled Redwing Mine S-K 1300 Technical Report Summary with an effective date of 31 December 2023, and (iii) the technical report summary titled Mazowe Mine S-K 1300 Technical Report Summary with an effective date of 31 December 2023, in each case as signed and certified by WSP Australia Pty Limited (collectively, the “Technical Report Summaries”), WSP hereby states that it is the QP Firm responsible for the preparation of those Technical Report Summaries.
Furthermore, WSP confirms that:
| (a) | It consents to the public filing by Namib Minerals of the Technical Report Summaries with the United States Securities and Exchange Commission; |
| (b) | the document that the Technical Report Summaries support is the Registration Statement on Form F-1 of Namib Minerals (as may be amended or supplemented, the “Document”); |
| (c) | it consents to the use of its name in the Document, to any quotation from or summarization in the Document of the Technical Report Summaries, and to the filing of each Technical Report Summary as an exhibit to the Document; and |
| (d) | it has read the Document, and that the Document fairly and accurately reflects, in the form and context in which it appears, the information in the parts of the Technical Report Summaries. |
Dated at Melbourne, Australia this 1st of April 2026.
Signature of Qualified Firm:
WSP Australia Pty Limited
| /s/ Colin McVie | |
| Colin McVie | |
| Technical Director Mine Advisory |
Exhibit 96.1
Namib Minerals
How Mine
S-K 1300 Technical Report Summary
March 2026
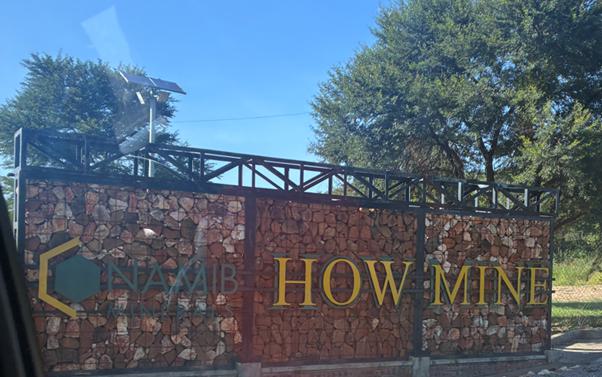


How Mine
S-K 1300 Technical Report Summary
Namib Minerals
WSP Australia Pty Limited
Level 3, 51-55 Bolton St
Newcastle NSW 2300
PO Box 1162
Newcastle NSW 2300
Tel: +61 2 4929 8300
Fax: +61 2 4929 8382
wsp.com
| Effective Date: | 31 December 2025 |
| Signature Date | 31 March 2026 |
This document may contain confidential and legally privileged information, neither of which are intended to be waived, and must be used only for its intended purpose. Any unauthorised copying, dissemination or use in any form or by any means other than by the addressee, is strictly prohibited. If you have received this document in error or by any means other than as authorised addressee, please notify us immediately and we will arrange for its return to us.
PS229049-WSP-PER-MNG-TRS-001-How Mine TRS-
|
March 2026 |
Table of contents
| 1 | Executive summary | 1 |
| 1.1 | Property description and ownership | 1 |
| 1.2 | Geology and mineralisation | 1 |
| 1.3 | Exploration | 1 |
| 1.4 | Mineral Resources estimates | 2 |
| 1.5 | Mineral Reserves estimates | 3 |
| 1.6 | Capital and operating costs | 4 |
| 1.7 | Economic evaluation | 5 |
| 1.8 | Permitting requirements | 5 |
| 1.9 | QP’s conclusions and recommendations | 5 |
| 1.9.1 | Mineral Resources | 5 |
| 1.9.2 | Mineral Reserves | 6 |
| 2 | Introduction | 8 |
| 2.1 | Registrant information | 8 |
| 2.2 | Terms of reference and purpose | 9 |
| 2.3 | Sources of information | 13 |
| 2.4 | Personal inspection | 13 |
| 2.5 | Previously filed Technical Report Summaries | 13 |
| 2.6 | WSP declaration | 13 |
| 2.7 | Statement of Independence | 14 |
| 3 | Property description | 15 |
| 3.1 | Property location | 15 |
| 3.2 | Title and mineral rights | 15 |
| 3.3 | Encumbrances | 16 |
| 3.4 | Risks to access, title or right to perform work | 16 |
| 3.5 | Agreements and royalties | 17 |
| 4 | Accessibility, climate, local resources, infrastructure, and physiography | 17 |
| 4.1 | Topography, elevation, and vegetation | 17 |
| 4.2 | Access and proximity to population centres | 18 |
| 4.3 | Climate | 18 |
i
| 4.4 | Local resources and existing infrastructure | 19 |
| 4.4.1 | Power supply | 19 |
| 4.4.2 | Water supply | 19 |
| 4.4.3 | Personnel | 19 |
| 4.4.4 | Suppliers | 19 |
| 5 | History | 20 |
| 5.1 | Exploration and ownership history | 20 |
| 5.2 | Production history | 20 |
| 5.3 | Production reconciliation | 22 |
| 5.4 | Aggregate fiscal year production | 23 |
| 5.5 | Exploration and development by previous owners or operators | 23 |
| 6 | Geological setting, mineralisation, and deposit | 24 |
| 6.1 | Regional geology | 24 |
| 6.2 | Structural setting | 25 |
| 6.3 | Local and Property geology | 25 |
| 6.4 | Deposit type and geology | 27 |
| 6.5 | Mineralisation | 27 |
| 7 | Exploration | 29 |
| 7.1 | Diamond drilling | 29 |
| 7.1.1 | Exploration drilling 2025 | 30 |
| 7.1.2 | Exploration drilling 2012-2023 | 36 |
| 7.2 | Sludge drilling | 38 |
| 7.3 | QP’s opinion | 38 |
| 8 | Sample preparation, analyses, and security | 39 |
| 8.1 | Sampling techniques | 39 |
| 8.1.1 | Core sampling | 39 |
| 8.1.2 | Channel sampling | 39 |
| 8.1.3 | Sample security | 39 |
| 8.2 | Dry bulk density determination | 39 |
| 8.3 | Sample preparation, analysis, and procedures | 39 |
ii
| 8.4 | Quality Assurance Quality Control | 40 |
| 8.4.1 | Channel sampling | 40 |
| 8.4.2 | Core sampling | 40 |
| 8.4.3 | 2025 QAQC results | 40 |
| 8.5 | Bulk density | 42 |
| 8.6 | QP’s opinion on adequacy | 42 |
| 9 | Data verification | 43 |
| 9.1 | Mineral Resources data verification | 43 |
| 9.1.1 | Data verification conducted by BMC Zimbabwe | 43 |
| 9.1.2 | Data verification conducted by WSP | 43 |
| 9.1.3 | Limitations on Mineral Resources data verification | 43 |
| 9.2 | Mining and Mineral Reserves data verification | 43 |
| 9.3 | Geotechnical data verification | 44 |
| 9.4 | Hydrology and hydrogeology data verification | 44 |
| 9.4.1 | Hydrology | 46 |
| 9.4.2 | Hydrogeology | 46 |
| 9.5 | Processing and recovery methods data verification | 47 |
| 10 | Mineral processing and metallurgical | 48 |
| 10.1 | Nature and extent of mineral processing and metallurgical testing | 48 |
| 10.1.1 | Nature of Mineral Processing Operations | 48 |
| 10.1.2 | Extent of Metallurgical Testing | 48 |
| 10.2 | Spatial representativity of metallurgical sampling | 49 |
| 10.3 | Details of analytical or testing laboratories | 49 |
| 10.4 | Predictions and assumptions in mineral processing | 49 |
| 11 | Mineral Resource estimate | 50 |
| 11.1 | Resource database | 50 |
| 11.2 | Geological interpretation | 50 |
| 11.2.1 | Mineralisation Modelling | 51 |
| 11.3 | Data preparation | 56 |
| 11.3.1 | Hole Types | 56 |
| 11.3.2 | Collar Review | 58 |
| 11.3.3 | Downhole Survey Review | 59 |
| 11.3.4 | Assay Review | 60 |
| 11.3.5 | Compositing | 60 |
| 11.3.6 | Comparison Statistics | 61 |
iii
| 11.4 | Exploratory data analysis | 62 |
| 11.4.1 | High-grade treatment | 62 |
| 11.5 | Variography | 63 |
| 11.6 | Dry bulk density | 64 |
| 11.7 | Block models | 64 |
| 11.8 | Grade estimation | 65 |
| 11.9 | Model validation | 65 |
| 11.9.1 | Visual Validation | 66 |
| 11.9.2 | Global Comparisons | 66 |
| 11.9.3 | Swath Plots | 67 |
| 11.9.4 | Tailings Dam Block Model Review | 69 |
| 11.9.5 | Tailings Dam Block Model Validation | 70 |
| 11.10 | Mineral Resources classification | 75 |
| 11.11 | Cut-off grade, price, and justification | 77 |
| 11.12 | Reasonable prospects for eventual economic extraction | 78 |
| 11.13 | Mineral Resources statement | 80 |
| 11.14 | Uncertainty in the estimates of Inferred, Indicated, and Measured Mineral Resources | 81 |
| 11.15 | QP’s opinion on factors likely to influence the prospect of economic extraction | 82 |
| 12 | Mineral Reserve Estimate | 83 |
| 12.1 | Key inputs, assumptions, parameters, and methods | 83 |
| 12.2 | Cut-off grade estimate | 84 |
| 12.3 | Metallurgical and processing recoveries | 85 |
| 12.4 | Modifying factors | 85 |
| 12.5 | Mineral Reserve classification | 86 |
| 12.5.1 | Proved Mineral Reserves | 86 |
| 12.5.2 | Probable Mineral Reserves | 87 |
| 12.6 | Mineral Reserve estimate | 87 |
| 12.6.1 | Mineral Reserve statement | 87 |
| 12.6.2 | Life of mine strategic plan | 88 |
| 12.7 | QP’s opinion on risk factors that may materially affect the Mineral Reserve estimates | 89 |
iv
| 13 | Mining methods | 90 |
| 13.1 | Introduction | 90 |
| 13.2 | Parameters relevant to the design and schedule | 92 |
| 13.2.1 | Geotechnical | 92 |
| 13.2.2 | Hydrogeological | 93 |
| 13.3 | Production parameters | 93 |
| 13.3.1 | Production rates | 93 |
| 13.3.2 | Expected mine life | 93 |
| 13.3.3 | Mining model | 94 |
| 13.4 | Mining fleet, machinery, and personnel requirements | 98 |
| 13.4.1 | Mining fleet and machinery | 98 |
| 13.4.2 | Personnel | 99 |
| 13.5 | Scheduling process | 99 |
| 13.6 | Mining schedule | 99 |
| 14 | Processing and recovery methods | 103 |
| 14.1 | Processing methodologies and flowsheets | 103 |
| 14.2 | Processing plant throughput and characteristics | 103 |
| 14.2.1 | Run of Mine crushing plant | 103 |
| 14.2.2 | Grinding and gravity concentration plant | 104 |
| 14.2.3 | Run of Mine CIP plant | 104 |
| 14.2.4 | Elution plant | 104 |
| 14.2.5 | Clean-up and smelting | 104 |
| 14.3 | Product sampling | 104 |
| 14.3.1 | Mill feed | 104 |
| 14.3.2 | Feed tonnage | 105 |
| 14.3.3 | Residues | 105 |
| 14.4 | Metallurgical recovery | 106 |
| 14.5 | Product stockyard | 106 |
| 14.6 | Energy and water process materials requirements | 107 |
| 14.6.1 | Mine power plant | 107 |
| 14.6.2 | Mine water management system | 107 |
| 14.7 | QP’s opinion | 107 |
| 15 | Infrastructure | 108 |
| 15.1 | Rail access | 108 |
| 15.2 | Port access | 109 |
| 15.3 | Roads | 109 |
| 15.4 | Camp | 109 |
v
| 15.5 | Tailings | 109 |
| 15.6 | Potable water and wastewater | 109 |
| 15.7 | Accommodation and offices | 110 |
| 15.8 | Non-process infrastructure | 110 |
| 15.9 | Information and communications technology systems | 110 |
| 15.10 | Other support facilities and utilities | 110 |
| 16 | Market studies | 110 |
| 16.1 | Nature and material terms of agency relationships | 110 |
| 16.2 | Results of relevant market studies | 111 |
| 16.3 | Commodity price projections | 111 |
| 16.4 | Mining and processing | 113 |
| 16.5 | Product transport and handling | 113 |
| 16.6 | Hedging arrangements | 113 |
| 16.7 | Forward sales contracts | 113 |
| 16.8 | Contracts with affiliated parties | 113 |
| 17 | Environmental studies, permitting and plans, negotiations, or agreements with local individuals or groups | 114 |
| 17.1 | Introduction | 114 |
| 17.2 | Environmental management and corporate responsibility | 114 |
| 17.3 | Property context | 115 |
| 17.4 | Property permitting | 116 |
| 17.5 | Environmental and Social Impact Assessment | 117 |
| 17.5.1 | Biodiversity and natural resources | 117 |
| 17.5.2 | Managing impacts on water | 117 |
| 17.5.3 | Acid and metalliferous drainage | 117 |
| 17.5.4 | Erosion and protection of soils | 117 |
| 17.5.5 | Noise and vibration | 117 |
| 17.5.6 | Air quality | 118 |
| 17.5.7 | Local climate impacts | 118 |
| 17.5.8 | Greenhouse gas emissions | 118 |
| 17.5.9 | Resources use and non-mineral waste | 118 |
| 17.5.10 | Regulatory accreditation | 118 |
vi
| 17.6 | Property standards | 119 |
| 17.7 | Waste and tailings disposal plans | 119 |
| 17.7.1 | Waste disposal | 119 |
| 17.7.2 | Tailings disposal | 119 |
| 17.8 | Site monitoring | 121 |
| 17.9 | Water management | 122 |
| 17.10 | Stakeholder engagement | 122 |
| 17.10.1 | Stakeholder engagement plan | 122 |
| 17.10.2 | Consultation | 122 |
| 17.11 | Cultural, economic, and social conditions | 122 |
| 17.11.1 | Cultural heritage | 122 |
| 17.11.2 | Contributing to the national and local economy | 123 |
| 17.11.3 | Establishing a social management framework | 123 |
| 17.11.4 | Stakeholder engagement | 123 |
| 17.11.5 | Impacts on land use and access | 123 |
| 17.11.6 | Protecting community health and safety | 123 |
| 17.11.7 | Protecting the workforce | 123 |
| 17.11.8 | Commitment to local procurement and hiring | 123 |
| 17.12 | Mine closure | 125 |
| 17.13 | Translating the ESIA into environmental and social management | 126 |
| 17.14 | QP’s opinion | 126 |
| 17.14.1 | Legal | 126 |
| 17.14.2 | Social and environment | 126 |
| 18 | Capital and operating costs | 126 |
| 18.1 | Capital costs | 127 |
| 18.1.1 | Growth and sustaining capital | 127 |
| 18.1.2 | Mine closure costs | 128 |
| 18.2 | Operating costs | 128 |
| 18.3 | Contingency | 129 |
| 19 | Economic analysis | 130 |
| 19.1 | Summary | 130 |
| 19.2 | Methodology | 130 |
| 19.2.1 | Modelling approach | 130 |
| 19.2.2 | Sources of assumptions | 131 |
| 19.2.3 | Financial | 131 |
| 19.2.4 | Pricing and revenue | 131 |
| 19.2.5 | Taxes and royalties | 132 |
vii
| 19.0 | Capital costs | 132 |
| 19.1 | Operating costs | 132 |
| 19.2 | Cash flow | 132 |
| 19.3 | Economic evaluation and sensitivity analysis | 134 |
| 20 | Adjacent properties | 135 |
| 21 | Other relevant data and information | 135 |
| 22 | Interpretation and conclusions | 135 |
| 22.1 | Mineral Resources interpretations and conclusions | 135 |
| 22.2 | Mineral Reserves interpretations and conclusions | 136 |
| 23 | Recommendations | 138 |
| 23.1 | Mineral Resources recommendations | 138 |
| 23.2 | Mineral Reserves recommendations | 138 |
| 24 | References | 139 |
| 25 | Reliance on information provided by the Registrant | 141 |
| 26 | Date and Signature Page | 141 |
List of tables
| Table 1-1 | HGM underground Measured and Indicated Mineral Resources estimate as at 31 December 2025, exclusive of Mineral Reserves. | 2 |
| Table 1-2 | HGM underground Inferred Mineral Resource estimate as at 31 December 2025 | 3 |
| Table 1-3 | HGM sands (tailings) Inferred Mineral Resource estimate as at 31 December 2025 | 3 |
| Table 1.4 | presents the HGM Mineral Reserves estimate as at 31 December 2025.Table 1-4 Mineral Reserves estimate as at 31 December 2025 | 4 |
| Table 2-1 | List of acronyms and abbreviations used in this TRS | 9 |
| Table 4-1 | Mean temperatures in Bulawayo (World Meteorological Organization) | 18 |
| Table 5-1 | MRMR summary comparison end December 2024 to end December 2025 | 22 |
| Table 5-2 | Aggregate calendar year production ending December 2021–2025 | 23 |
viii
| Table 8-1 | Summary of density samples taken between 2007 and 2016. | 42 |
| Table 11-1 | Summary of drill types included in the How database and used in the Mineral resource estimate | 56 |
| Table 11-2 | Survey intervals ignored due to spurious azimuth readings | 59 |
| Table 11-3 | Comparison of raw and composited sample statistics (Au g/t) | 61 |
| Table 11-4 | Top cut statistics per domain for Au | 62 |
| Table 11-5 | Summary of variogram parameters by domain | 63 |
| Table 11-6 | How Block Model Parameters | 64 |
| Table 11-7 | Model Variables | 64 |
| Table 11-8 | How Estimation Parameters - Au | 65 |
| Table 11-9 | Global grade validation for all domains | 66 |
| Table 11-10 | Comparison between the input samples and the model estimated blocks within each dam wireframe | 74 |
| Table 11-11 | BECOG Calculation | 77 |
| Table 11-12 | MCOG Calculation | 77 |
| Table 11-13 | December 2025 Mineral Resource conversion parameters | 78 |
| Table 11-14 | Stope optimisation parameters for How Mineral Resource | 79 |
| Table 11-15 | How Gold Project, Mineral Resource Estimate, exclusive of Mineral Reserves – 31 December 2025 | 80 |
| Table 11-16 | HGM underground Measured and Indicated Mineral Resources estimate as at 31 December 2025 | 80 |
| Table 11-17 | HGM underground Inferred Mineral Resources estimate as at 31 December 2023 | 81 |
| Table 11-18 | HGM sands (tailings) Inferred Mineral Resources estimate as at 31 December 2025 | 81 |
| Table 12-1 | Estimation parameters | 83 |
| Table 12-2 | BECOG Calculation | 84 |
| Table 12-3 | MCOG Calculation | 84 |
| Table 12-4 | Additional key parameters | 85 |
| Table 12-5 | Mineral Reserves estimate as at 31 December 2025 | 88 |
| Table 12-6 | Inferred Mineral Resources included in the life of mine plan as at 31 December 2025 | 88 |
| Table 13-1 | HGM shaft collars and depths | 92 |
| Table 13-2 | MSO parameters | 94 |
| Table 13-3 | CY2025 MRE (Proven and Probable only) | 100 |
| Table 13-4 | HGM mine strategic life of mine plan (Proven, Probable and Inferred) | 102 |
| Table 14-1 | Mill feed sampling specifications | 105 |
| Table 14-2 | Feed tonnage sampling specifications | 105 |
| Table 14-3 | Residues sampling specifications | 105 |
| Table 14-4 | Historical metallurgical recovery data | 106 |
ix
| Table 16-1 | Zimbabwean inflation rate and economic indicators (Trading Economics, 13 February 2026) | 112 |
| Table 18-1 | Mineral Reserves summary capital expenditure for FY 2026-2029 | 128 |
| Table 18-2 | HGM present closure obligation (Enmin 2025) | 128 |
| Table 18-3 | HGM Mineral Reserves LOM OPEX | 129 |
| Table 19-1 | HGM Mineral Reserve cashflow modelling assumptions | 131 |
| Table 19-2 | HGM cashflow analysis prior to depreciation, financing, and tax – Mineral Reserves (Proved and Probable only) | 133 |
List of figures
| Figure 2.1 | Namib Minerals corporate | 8 |
| Figure 3.1 | Property location map | 15 |
| Figure 3.2 | HGM ML 28 boundary | 16 |
| Figure 4.1 | Climate statistics for Bulawayo, Zimbabwe (Meteoblue 2026) | 19 |
| Figure 5.1 | HGM total gold production 1941–2025 | 21 |
| Figure 6.1 | Regional geology of Zimbabwe showing location of Greenstone Belts (Prendergast 2004) | 24 |
| Figure 6.2 | Regional geology of the HGM area (BMC Limited) | 25 |
| Figure 6.3 | Local geology of the HGM area (BMC 2023b) | 26 |
| Figure 6.4 | Simplified stratigraphic columns for the Umzingwane, Avalon, and Kensington formations (BMC Limited) | 26 |
| Figure 6.5 | Typical cross-section of ore zones within tuff (Edelrod 2024) | 28 |
| Figure 7.1 | Long Section view, looking East of all HGM diamond drill hole collars, traces and existing mine development | 30 |
| Figure 7.2 | Plan view of 2025 drill hole collars (left) and traces (right), with existing mine development shown in grey | 30 |
| Figure 7.3 | 13L (2025) drilling plan | 31 |
| Figure 7.4 | 17L (2025) drilling plan - 17L20m (left) and 17Lev (right) | 32 |
| Figure 7.5 | 18L (2025) drilling plan | 33 |
| Figure 7.6 | 30L (2025) drilling plan. Plan view (left) and section view (right) | 34 |
| Figure 7.7 | 32L (2025) drilling plan - 32L20m (top left), 32L10m (top right), and 32Lev (bottom) | 35 |
| Figure 7.8 | 30L (2021–2023) drilling plan | 36 |
| Figure 7.9 | 24L (2015–2016) drilling plan | 37 |
| Figure 7.10 | 26L (2012–2013) drilling plan | 37 |
| Figure 8.1 | 2025 Standard performance – high-grade standard | 41 |
| Figure 8.2 | 2025 Standard performance – low-grade standard | 41 |
| Figure 8.3 | January 2026 Inter-laboratory Check Sample Results | 42 |
| Figure 9.1 | Catchment boundaries of Zimbabwe (BMC Limited) | 45 |
| Figure 9.2 | Sub-catchment boundaries of Mzingwane, Zimbabwe (BMC Limited) | 46 |
x
| Figure 11.1 | Long section view looking East showing existing development in grey and Namib’s planned MRE wireframes in orange. | 50 |
| Figure 11.2 | (left) log probability plot of Au assays at How, (right) log probability plot of waste interval lengths at How | 51 |
| Figure 11.3 | Plan view +/- 13m at 155mRL showing the intervals selected in the low-grade wireframe in pink with external segments in blue. The resulting low-grade wireframes outline is in orange. | 52 |
| Figure 11.4 | North facing section view +/- 13m at 5725mN | 52 |
| Figure 11.5 | (Left) Log probability plot of Au assays within the low-grade wireframe at How. (Right) Log probability plot of waste interval lengths within the low-grade wireframe at How. | 53 |
| Figure 11.6 | Plan view at 285mRL showing the medium grade domain (red) inside the low-grade domain (orange). Structural trend shown in blue. | 54 |
| Figure 11.7 | (Left) Histogram of Au grades within the medium grade domain at How. (Right) log probability plot of Au grades within the medium grade domain at How. | 55 |
| Figure 11.8 | Plan view at 420mRL showing the Low-grade wireframe outline in orange with the Medium-grade wireframe in red and the internal High-grade wireframes in purple. | 55 |
| Figure 11.9 | Long section view showing collar locations of different drill types | 56 |
| Figure 11.10 | Plan view at 300mRL showing channel samples in the development drive (light blue collars) with diamond drilling (collars in dark blue) | 57 |
| Figure 11.11 | Long section looking East showing distance of the collar points to the development drive. | 58 |
| Figure 11.12 | Long section view looking East showing dog-leg severity in diamond drill holes | 59 |
| Figure 11.13 | Histogram of raw assay length within mineralised domains | 61 |
| Figure 11.14 | Correlograms for low-grade domain | 63 |
| Figure 11.15 | Correlograms for medium-grade domain | 63 |
| Figure 11.16 | Correlograms for high-grade domain | 63 |
| Figure 11.17 | Cross section at -5625mN +/- 15m showing the block model and composites both coloured by Au | 66 |
| Figure 11.18 | Swath Plot for HG mineralisation (Top left – X, Top right – Y, Bottom – Z) | 67 |
| Figure 11.19 | Swath Plot for MG mineralisation (Top left – X, Top right – Y, Bottom – Z) | 68 |
| Figure 11.20 | Swath Plot for LG mineralisation (Top left – X, Top right – Y, Bottom – Z) | 69 |
| Figure 11.21 | Plan view of the block model at Dam 3, showing estimated grades and composited data at the 1261 m levels (±1 m). Topography is shown in brown. | 70 |
xi
| Figure 11.22 | NE–SW cross-section (±5 m) looking northwest at Dam 3, comparing Au composite grades with the block model Au_IDW grades. Topography is shown in brown. | 71 |
| Figure 11.23 | NE–SW cross-section (±5 m) looking northwest at Dam 3, comparing Au composite grades with the block model Au_IDW grades. Topography is shown in brown. | 71 |
| Figure 11.24 | NW–SE long-section (±5 m) looking northeast at Dam 3, comparing Au composite grades with the block model Au_IDW grades. Topography is shown in brown. | 72 |
| Figure 11.25 | Plan view of the block model at Dam 4, showing estimated grades and composited data at the 1,271 m levels (±1 m). Topography is shown in brown. | 72 |
| Figure 11.26 | NE–SW cross-section (±5 m) looking northwest at Dam 4, comparing Au composite grades with the block model Au_IDW grades. Topography is shown in brown. | 73 |
| Figure 11.27 | NE–SW cross-section (±5 m) looking northwest at Dam 4, comparing Au composite grades with the block model Au_IDW grades. Topography is shown in brown. | 73 |
| Figure 11.28 | NW–SE long-section (±5 m) looking northeast at Dam 4, comparing Au composite grades with the block model Au_IDW grades. Topography is shown in brown. | 73 |
| Figure 11.29 | Swath Plot for Dam 3 (Top left – X, Top right – Y, Bottom – Z) | 74 |
| Figure 11.30 | Swath Plot for Dam 4 (Top left – X, Top right – Y, Bottom – Z) | 75 |
| Figure 11.31 | Long section view looking East showing Measured (green) and Indicated (pink) blocks and diamond drill hole traces in white. Material outside of these areas but within the orange estimation domain are classified Inferred. | 76 |
| Figure 11.32 | Long section view looking East showing RPEEE stopes in blue with existing stopped out areas in white | 79 |
| Figure 13.1 | Figure showing general mining method (Mining – blasthole stoping, ore extraction, drilling | Britannica) | 90 |
| Figure 13.2 | HGM underground mining infrastructure end 2025 | 91 |
| Figure 13.3 | Updated CY2025 MRE MSO inventory looking east | 95 |
| Figure 13.4 | Previous CY2024 MRE stoping inventory looking east | 96 |
| Figure 13.5 | Updated lateral and vertical development looking east | 97 |
| Figure 13.6 | CY2025 MRE updated mine design looking east | 98 |
| Figure 13.7 | DTS mining schedule | 100 |
| Figure 13.8 | Total ore tonnes and average gold grade (g/t) - Proven and Probable only | 101 |
| Figure 14.1 | HGM processing flowsheet (KDM 2018) | 103 |
| Figure 15.1 | NRZ rail network schematic (NRZ 2024c) | 108 |
| Figure 16.1 | Historical (blue) gold spot price US$/oz (World Gold Council Feb 26) | 111 |
| Figure 16.2 | Zimbabwean gold currency exchange rate ZiG/USD (Trading Economics, 24 February 2026) | 112 |
| Figure 17.1 | BMC Zimbabwe ML and other claims | 116 |
| Figure 17.2 | Site layout for TSF Dam 5 and proposed Dam 6 | 119 |
| Figure 17.3 | TSF Dam 5 location from satellite imagery | 120 |
| Figure 17.4 | Tailings storage facility Dam 5 cross section and plan schematic of construction, December 2023 | 121 |
| Figure 19.1 | Mineral Reserves only project NPV and sensitivity analysis | 132 |
List of appendices
Appendix A Limitations statement
xii
| 1 | Executive summary |
| 1.1 | Property description and ownership |
The How Gold Mine (HGM) [or the Property] is located in the Matabeleland South Province, Zimbabwe, approximately 30 kilometres (km) southeast of the city of Bulawayo (latitude 20°18’S and longitude 28°46‘E), in the Bulawayo Mining District of Zimbabwe.
The HGM is situated within the Mining Lease (ML) 28 tenement, which has a surface area of 2,408 hectares (ha) [Figure 3.2].
HGM is wholly owned and operated through Namib Minerals, which acquired Bulawayo Mining Company Limited (BMC)—the long-standing operator of the mine—in 2024 from Metallon Corporation. Following this transaction, Namib Minerals holds 100% indirect ownership of HGM, while BMC continues to function as the on-site operator under the new corporate structure.
The Property is accessible via a sealed road from Bulawayo, approximately 30 kilometres (km) west-northwest, which is in fair condition. Access to the mine site and ore is authorised by the applicable mining legislation, and BMC Zimbabwe’s title and mining rights. Mining exploration and exploitation works conducted, or to be conducted on site are authorised in accordance with the applicable legislation, and BMC Zimbabwe’s title and mining rights.
| 1.2 | Geology and mineralisation |
The HGM is located in the Umzingwane Formation of the Bulawayo Greenstone Belt (BGB). The lithological units characteristic of the Umzingwane Formation includes clastic metasediments, fine-grained tuffaceous rocks, banded shales and siltstones, ferruginous cherts or Banded Iron Formation (BIF), and rhyodacites and andesitic lavas. This assemblage has been subjected to metamorphism of lower greenschist facies.
The local geology around HGM consists of a sequence of talc-chlorite schist, laminated black shale, silicate facies BIF, tuffaceous units, and siltstone from southwest to northeast with the occurrence of felsic porphyry intrusions and mafic dykes.
Mineralisation at the HGM is thought to have been formed by hydrothermal solutions migrating along structurally controlled channels, predominantly caused by an extensional duplex, with its long axis parallel to the direction of extension.
The deposit shows significant hydrothermal alteration, commonly with associated sulphide mineralisation. Strong carbonation, silicification, and in extreme cases propylitisation occur together with sulphides. Pyrite is the dominant sulphide, with significantly less chalcopyrite and occasional pyrrhotite present, becoming more abundant at depth. Chalcocite and arsenopyrite have also been reported. Ore microscopy has shown that gold is associated with a late generation of pyrite and chalcocite.
Mineralisation generally strikes to the north, and dips steeply at approximately 80 degrees (°) to the west, with a steep northerly plunge.
| 1.3 | Exploration |
Exploration is based on detailed geological mapping that established the following sequence from southwest to northeast: talc-chlorite schist, laminated black shale, silicate facies BIF, tuffaceous units, and siltstone. The occurrence of felsic porphyry intrusions and mafic dykes was observed in historical quarries and underground at HGM.
Channel sampling, diamond drilling, and sludge drilling samples were used for the purposes of geological modelling and Mineral Resource estimation.
| Project No PS229049 | WSP |
| How Mine | March 2026 |
| S-K 1300 Technical Report Summary | Page 1 |
| Namib Minerals |
| 1.4 | Mineral Resources estimates |
This report is prepared as a Technical Report Summary (TRS) for the Property, in accordance with the United States Securities and Exchange Commission’s (SEC) Modernized Property Disclosure Requirements for Mining Registrants as described in Subpart 229.1300 of Regulation S K, Disclosure by Registrants Engaged in Mining Operations (S-K 1300) and Item 601(b)(96).
The Mineral Resources estimate has been defined, classified and reported according to the guiding principles and minimum requirements as set out in S-K 1300 requirements for the reporting of Mineral Resources.
The relevant Qualified Person (QP) is satisfied that there has been sufficient orebody knowledge work completed to support Reasonable Prospects for Economic Extraction (RPEE) at the Property from a Mineral Resource perspective.
In the QP’s opinion the assumptions for definition of the resource base are current.
For the purpose of demonstrating the capacity to exploit the resource and define Mineral Resources as required under S-K 1300, the QP utilised Datamine’s Mineable Shape Optimiser (MSO) software to define mineable envelopes (stopes) based on the current mining method stope definition parameters above the calculated marginal cut-off, as per accepted industry practice. The parameters used in the MSO process are detailed in Table 13-2 below. The marginal cut-off was calculated on updated macro-economic inputs and current costs data and is detailed in Section 11.11 of this report. A process recovery of 89%, detailed in Section 14.4, for gold was applied for cashflow modelling consistent with recent historical averages and fixed tail estimates. Further assumptions are provided under Section 11.11.
Table 1.1 presents the underground Measured and Indicated Mineral Resources (exclusive of Mineral Reserves) reported as at 31 December 2025.
Mineral Resources are reported on an in-situ basis, exclusive of Mineral Reserves, inside Mineable Stope Optimiser shapes generated at a cut-off grade of 0.6 g/t Au and is inclusive of material below 0.6 g./t Au within these shapes.
Table 1-1 HGM underground Measured and Indicated Mineral Resources estimate as at 31 December 2025, exclusive of Mineral Reserves.
| Category | Tonnage (Mt) | Au Grade (g/t) | Au Metal (koz) |
| Underground | |||
| Measured Resource | 13.7 | 1.32 | 583 |
| Indicated Resource | 10.2 | 1.41 | 463 |
| Grand Total | 23.9 | 1.36 | 1,046 |
Notes: Mt = Million tonnes; Au Grade g/t = gold grams per tonne; koz = thousand ounces.
Table 1.2 presents the underground Inferred Mineral Resource reported as at 31 December 2025. The Mineral Resource is reported within Mineable Stope Optimiser shapes generated at a cut-off grade of 0.6 g/t Au and is inclusive of material below 0.6 g./t Au within these shapes.
| Project No PS229049 | WSP |
| How Mine | March 2026 |
| S-K 1300 Technical Report Summary | Page 2 |
| Namib Minerals |
Table 1-2 HGM underground Inferred Mineral Resource estimate as at 31 December 2025
| Category | Tonnage (Mt) | Au Grade (g/t) | Au Metal (koz) |
| Underground | |||
| Inferred Resource | 31.0 | 2.18 | 2,176 |
| Grand Total | 31.0 | 2.18 | 2,176 |
Notes: Mt = Million tonnes; Au Grade g/t = gold grams per tonne; koz = thousand ounces.
Table 1.3 presents the sands (tailings) Inferred Mineral Resource reported as at 31 December 2025.
Table 1-3 HGM sands (tailings) Inferred Mineral Resource estimate as at 31 December 2025
| Category | Tonnage (Mt) | Au Grade (g/t) | Au Metal (koz) |
| Sands (Tailings) | |||
| Inferred Resource | 12.0 | 0.59 | 220 |
| Grand Total | 12.0 | 0.59 | 220 |
Notes: Mt = Million tonnes; Au Grade g/t = gold grams per tonne; koz = thousand ounces.
It should be noted that the underground and surface Mineral Resource estimate for the Property is reported exclusive of Mineral Reserves.
The Mineral Resources presented in this Section are not Mineral Reserves, and do not reflect demonstrated economic viability. The reported Inferred Mineral Resources are considered too speculative geologically to have the economic considerations applied to them that would enable them to be categorised as Mineral Reserves. There is no certainty that all or any part of this Mineral Resource will be converted into Mineral Reserve.
All figures are rounded to reflect the relative accuracy of the estimates and totals may not add correctly.
Based on the geological results presented in this TRS, it is the QP’s opinion that the Mineral Resources have Reasonable Prospects for Economic Extraction.
| 1.5 | Mineral Reserves estimates |
The Mineral Reserves have been defined, classified and reported according to the guiding principles and minimum requirements as set out in S-K 1300.
The QP is satisfied that there has been sufficient standard of evaluation to support estimation of a Mineral Reserve that has been demonstrated to be technically and economically viable.
WSP has applied an extractable mining recovery of 90% applied in conjunction with the Mine Call Factor (MCF). The MCF is the product of the Block Call Factor (BCF), and the Assay Plan Factor (APF). The APF for this estimate is applied to gold grade (102.1% of resource grade), reflecting both plan dilution and positive reconciliation as a 3-year trailing average excluding outliers (+10%) as at end December 2025. The BCF has been calculated to 98% utilising the same methodology giving a MCF of 100.1%. Mineral Reserves are reported on a plant feed basis, inclusive of dilution and ore loss modifying factors, assuming a gold metallurgical recovery of 89%.
The Mineral Reserve accounts for 3.6%, by tonnage, of the current Mineral Resource inclusive of the surface sands (tailings). The Mineral Reserve accounts for 44.5%, by tonnage, of the HGM 9-year strategic LOM plan inclusive of the surface sands (tailings).
The Mineral Reserve estimate is based on Proved and Probable material only, delineated by Datamine’s MSO software, that has been deemed to be economically viable through industry accepted mine planning practices. The economic basis for the Mineral Reserve is based on detailed financial modelling of the Mineral Reserve only mine plan.
| Project No PS229049 | WSP |
| How Mine | March 2026 |
| S-K 1300 Technical Report Summary | Page 3 |
| Namib Minerals |
Please note that the HGM strategic LOM plan is a combination of the Mineral Reserve only mine plan with the addition of Inferred material that has been assessed to be safely and economically extractable within the parameters of the current mine design.
Further Inferred material may be able to be added to the HGM strategic LOM plan once a strategic LOM is completed. Please note that such a study is outside the purview of the requirements to generate this report.
Table 1.4 presents the HGM Mineral Reserves estimate as at 31 December 2025.Table 1-4 Mineral Reserves estimate as at 31 December 2025
| Category | Tonnage (Mt) | Au Grade (g/t) | Au Metal (koz) | % Contribution |
| Underground | ||||
| Proved Reserve | 1.08 | 1.40 | 48 | 47% |
| Probable Reserve | 0.52 | 1.70 | 28 | 27% |
| Total Proved & Probable | 1.60 | 1.50 | 77 | 75% |
| Surface | ||||
| Probable Reserve | 0.89 | 0.89 | 26 | 25% |
| Grand Total | 2.49 | 1.29 | 103 | 100% |
Notes: UG = Underground, SF = Surface Stockpile Dam 3 and 4.
The estimates are rounded to reflect the order of accuracy, to the nearest ten thousand tonnes (10 kt) for tonnage, to two decimal places for grade, and to the nearest thousand ounces (koz) for contained gold. Estimates are prepared carrying relevant decimal place accuracy to derive subtotals and totals that are subsequently rounded. Minor rounding errors may occur as a result.
| 1.6 | Capital and operating costs |
Capital and operating cost estimates have been prepared by HGM to generate a 4-year Mineral Reserves only plan, plus 1 year for mine closure. WSP has analysed historical physical quantities, operating and capital costs of operation over the past 3 years 2023 – Q1 2026, and estimated an additional 5% contingency which has been applied to all operating and capital costs. Mine closure independently includes a contingency of 15.0%.
Capital costs total US$30.0 M comprising sustaining capital of US$27.6 M, growth capital of US$2.4. M (only in CY2025 for underground and process plant production upgrades) and mine closure of US$7.6 M (assuming a planned closure scenario). A mine closure cost estimate of US$8.1 M has been updated December 2025 in a review undertaken by Enmin Consulting (Private) Limited (Enmin).
Operating costs total US$123.5 M (averaging US$77.12/t processed) comprising direct operating C1 costs of US$108.5 M (US$67.81/t processed) and fixed overheads US$14.9 M (US$9.33/t processed).
Given the historical track record of operation of the HGM, and a 5% contingency allowance for both operating and capital costs, WSP views the cost estimates comply with the level of accuracy required by § 229.1302 (Item 1302 of Regulation S–K). The capital and operating cost estimate accuracy is assessed at +15% while a 5% contingency allowance on all costs is consistent with recent historical variability as a provision for any additional, unforeseen costs associated with unanticipated geologic circumstances, engineering conditions and unanticipated geopolitical conditions.
| Project No PS229049 | WSP |
| How Mine | March 2026 |
| S-K 1300 Technical Report Summary | Page 4 |
| Namib Minerals |
| 1.7 | Economic evaluation |
Key outcomes of the cashflow evaluation and sensitivity analysis on an after-tax basis, considering Mineral Reserves only are:
| — | A positive project NPV of US$22.1 M when Mineral Reserves only (PP) are considered over a 4-year LOM. |
| — | The project value is most sensitive to operating costs then gold price, but relatively less sensitive to capital cost. |
| — | The project value is relatively less sensitive to discount rate over a 11% – 20% range and gold price range from -25% (US$2,454/oz) and +25% (US$4,090/oz). |
| — | Project breakeven for the Mineral Reserve inventory is a 24% fall in gold price (US$2,640/oz) or a 37% increase in total costs. |
On this basis, the economic analysis is judged sufficiently robust to provide breakeven economics within a +10% level of accuracy and <15% contingency.
| 1.8 | Permitting requirements |
The ML is renewed on an annual basis with the Government of Zimbabwe. The area covered by ML 28 was surveyed and declared to be 2,408 ha. Isolated cases of illegal gold mining activities have been reported along some streams, and historical mine workings in the ML 28 area. Higher artisanal activity is concentrated along the Mzingwane River, on the southern margins of the ML 28 area. The ML is renewed annually, and the current certificate is valid to 17 August 2026.
| 1.9 | QP’s conclusions and recommendations |
| 1.9.1 | Mineral Resources |
Based on the information presented in this TRS, the QP’s key conclusions are as follows:
| — | The level of understanding of the regional geology, local geology and the nature and controls on mineralisation are high, and provide a solid foundation for geological modelling, Mineral Resource estimation, and mining and exploration geology. |
| — | The drilling, sampling, assay and Quality Assurance Quality Control (QAQC) techniques used for both exploration and resource estimation are consistent with standard industry practice and are considered appropriate for the purposes of geological modelling and Mineral Resource estimation. |
| — | The on-site assay laboratory is well-equipped, clean and maintained and is suitable for the work it is being utilised for. |
| — | The Mineral Resource estimate uses ordinary kriging which is considered appropriate for the mineralisation style. |
| — | Grade estimates were constrained to updated mineralisation wireframes during grade estimation and includes mineralisation defined using a lower cutoff of 0.36 g/t Au. |
| — | Quality Assurance Quality Control (QAQC) techniques used for both exploration and resource estimation are consistent with standard industry practice and are considered appropriate for the purposes of geological modelling and Mineral Resource estimation. |
| — | Grade estimates utilise all available samples, including channel, sludge and diamond drill core samples and incorporate level mapping where available. |
| — | Dry bulk density of 2.8 tonnes per cubic metre (t/m3) was assigned for all mineralised domains. |
| — | Statistical validation of the Mineral Resource estimate as well as visual validation has been completed and demonstrates a robust estimate which correlates well to the input data. |
| — | RPEE has been considered, and the parameters used are considered reasonable. The Mineral Resource estimate has been reported withing Mineable Stope Optimiser (MSO) shapes demonstrating reasonable prospects of economic extraction. |
| — | The Mineral Resource classification that has been applied is considered appropriate. |
| Project No PS229049 | WSP |
| How Mine | March 2026 |
| S-K 1300 Technical Report Summary | Page 5 |
| Namib Minerals |
Based on the information presented in this TRS, the QP’s key recommendations are as follows:
| — | Data and database management requires additional work to streamline the existing process and remove the current need for manual transcription of assay results and other data, and to ensure built in validation of data is completed. It is recommended that HGM invest in a corporate database with inbuilt validation routines and reporting functionality to assist with the large amount of geological information currently housed in excel spreadsheets. |
| — | Consider the creation of a lithology and a structural model to help guide the mineralisation modelling. |
| — | Further bulk density testwork should be completed to ensure the values used in the Mineral Resource are appropriate and suitable for use across the entire deposit. It is recommended that density values are reviewed by lithology and area of the mine to determine whether different values would be more appropriate. |
| — | Consider changing the down hole survey method currently used to a north seeking gyro tool to minimise the impact of magnetic material currently influencing the surveys at depth. |
| — | Include blank material with every laboratory submission to test the amount of contamination between samples through the sample preparation stages at the laboratory. |
| — | Undertaking core photography will provide a lasting record of drilling, particularly useful when mining historic areas where the core has already been disposed of. |
| — | Mineral Resource reconciliation practices should be reviewed, and a system implemented that provides a measure of the estimate’s performance. It is recommended that mined development and production be reconciled monthly, and stope close-out reports be developed for each completed stope. |
| 1.9.2 | Mineral Reserves |
The QP is satisfied with the basis for estimation and update of the 2025 Mineral Reserves. The outlook for the Mineral Reserve and generally the LOM has improved on a number of fronts, these being:
| — | Capital upgrades to increase underground production and process throughput from 40.5ktpm to 55ktpm due to be completed by end 2026 |
| — | The shaft was extended to 34L allowing access to lower levels and installation of the loading pocket. Further shaft deepening to the 36L, eventually to 38L, is planned and will allow access to the deeper Mineral Resources and Mineral Reserves. |
| — | Process plant capital upgrades and improvements that are ongoing to provide improved plant reliability and performance. |
| — | Work has been completed to consolidate the individual Mineral Resource models into a single Mineral Resource model streamlining the process for Mineral Resource and Mineral Reserve estimation. |
| — | An adjusted increase to the gold price of US$3272/oz assumed for cashflow evaluation, and cut-off grade (pay limit) determination. |
| — | WSP has completed a Mineral Reserve update based on modern software and accepted mine designs and mine planning practices for stoping and the majority of lateral and vertical development. Where WSP has used existing stope designs the stope block assessments are supported by technical work and methodology to the required level to estimate a Mineral Reserve. |
| Project No PS229049 | WSP |
| How Mine | March 2026 |
| S-K 1300 Technical Report Summary | Page 6 |
| Namib Minerals |
Based on the information presented in this TRS, the QP’s key conclusions are as follows:
| — | The planned development metres, and the scheduling of them, lack the detail provided the planned stopes. While WSP believes the historical, and current, monthly actuals are adequate for the current mine plan to be achieved it is preferable to include greater detail for all development types in the mine schedule and plan. WSP notes that HGM has confirmed they will be upgrading their mine planning software, and processes, in CY2026 with the assistance of Maptek’s Vulcan software. Preparation of complete development wireframes for inventory interrogation that may allow additional ore tonnages and overall Mineral Resource recovery. |
As part of the updates to HGM’s mine planning process WSP recommends including:
| — | The system of application of mining modifying factors based on reconciliation is a conventional approach, however, consideration should be given to separate estimation of tonnage and grade factors, particularly where there is significant contribution to production from MII category resources (non-PP). This may be implemented in the electronic mining schedule. |
| — | Review of Mineral Reserve definition and stope design practices maximising the utilising of modern mining software. |
| — | Review of the application APF, BF and BCF modifying factors based on gold metal content and applied solely as a grade factor. |
| — | Review of stope block Mineral Reserve, break, hoist, mill feed and reconciled mill production to confirm reconciliation factors calculated monthly. Additionally, a complete review of the reconciliation process should be undertaken to confirm the gross level of dilution and ore loss, planned (via stope design), unplanned (operational) and actual. |
| — | Review of average mineralisation width, stope block width and diluent grade to ensure that appropriate account is made for both practically achievable mining widths and dilution estimates when using modern software to create stope shapes. |
The QP recommends providing further HGM improvements to future Mineral Reserve estimates including:
| — | The level of overall plan dilution appears low but the manner in which the MCF, dilution and extraction are applied adequately account for both excess dilution and ore loss in the stopes. There is no separate account for unplanned or operational ore loss. The APF and BF estimated from gold content are applied as the MCF only on the grade. In effect, the adoption of APF and BF factoring of grades accounts for historical production performance as call factors that take account of both dilution and ore loss, however, the relatively high level of contribution from Inferred resource category (20-50% historically) may be masking the overall reconciliation. |
| — | Ore tonnages are reported on a dry basis. Recent inspection in February 2026 indicates that the mine is relatively dry. Density estimates are applied at one significant decimal place. WSP recommends estimating average densities either by interpolation within the Mineral Resource model by lithology or by reconciliation to derive an average dry density estimate to two significant decimal places. |
| — | Marginal blocks were included in the Mineral Reserve base. These blocks were included by the QP on the basis of a reduction in the pay limit to 0.6 g/t, based on US$3,272/oz, given the hoisting and processing availability for each year in the Mineral Reserve mine plan. |
| — | Underground and surface broken ore stocks have not reconciled. Starting stocks for the LOM plan end December 2025 assume nil stocks. |
| — | The surface Dam Sands #3 & #4 Mineral Reserve estimates are appropriately based on survey solid wireframes, resource models and pay limit estimates (0.8 g/t). The Dam Sands (sands) Mineral Reserve is not currently included in the LOM plan since it would displace higher grade underground resource but remains as potential project upside at the conclusion of underground mining and processing. The sands process amenability should be reviewed with respect to potential for impurities, deleterious elements and pregnant solution robbing materials. Process variability testwork should be revisited. The marginal cut-off for the sands has been calculated in the relevant section in this report. |
| — | Capital and operating costs for the operation are considered appropriate and compare well with historical benchmarks, contracts and quotations. A 5% contingency allowance is included in WSP estimates. |
| — | Unit operating costs should be reviewed on a fixed and variable basis to confirm forecast cost savings from economies of scale. This is an area that HGM is currently improving and should be finalised in CY2026. |
The mining methods are appropriate to the style and type of mineralisation and are based on a history of successful implementation. Subject to capital constraints, the QP recommends consideration be given to implementing more modern, mechanised mining techniques to improve general safety, productivity and production tonnage per personnel-shift. This will need to take appropriate account of the existing underground infrastructure and constraints, including ventilation. It could include the use of diesel, electric or battery powered boggers and electric-hydraulic drill rigs.
| Project No PS229049 | WSP |
| How Mine | March 2026 |
| S-K 1300 Technical Report Summary | Page 7 |
| Namib Minerals |
| 2 | Introduction |
| 2.1 | Registrant information |
This Technical Report Summary (TRS) is for the Namib Minerals owned How Gold Mine (HGM) [or the Property], located in Matabeleland South Province, southwestern Zimbabwe, and was prepared by the Qualified Person (QP) for Namib Minerals.
HGM is wholly owned and operated through Namib Minerals. Namib Minerals acquired BMC - the long-standing operator of the mine in 2025 from Greenstone Corporation. Following this transaction, Namib Minerals holds 100% indirect ownership of HGM, while BMC continues to function as the on-site operator under the new corporate structure
The area covered by ML 28 has a surface area of 2,408 hectares (ha) [Figure 3.2].
Figure 2.1 presents the corporate structure of Namib Minerals.
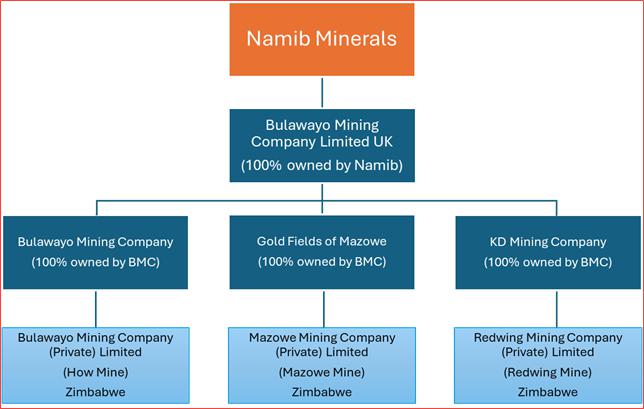
Figure 2.1 Namib Minerals corporate
This portfolio of mineral assets located in Zimbabwe consists of three mining properties located within a significant land package consisting of some 66.02 square kilometres (km2) in area. The mining properties comprise three separate underground gold mines, namely: How, Mazowe, and Redwing. Each mining property is serviced by its own dedicated processing facilities and accompanying infrastructure. Namib considers there to be significant exploration potential at each of the mining properties.
From acquisition of the assets in 2002 until 2006, gold production steadily increased, with gold production peaking in 2005 at approximately 156,000 ounces (oz) of gold, one of Zimbabwe’s largest gold producers.
Due to political unrest and hyperinflation in 2007, BMC Limited’s mining activities in Zimbabwe ceased, and all mines were placed on Care and Maintenance (C&M). In 2009, mining activities recommenced, with several of the mines requiring rehabilitation work.
| Project No PS229049 | WSP |
| How Mine | March 2026 |
| S-K 1300 Technical Report Summary | Page 8 |
| Namib Minerals |
Operations were suspended at the Mazowe Gold Mine (MGM) on 31 December 2018, and at the Redwing Gold Mine (RGM) on 30 March 2019 due to general economic challenges.
Gold production from the HGM since 2018 is as follows (BMC Zimbabwe Operation Reports):
| — | 2018: 39,746 oz. |
| — | 2019: 25,719 oz. |
| — | 2020: 19,099 oz. |
| — | 2021: 30,381 oz. |
| — | 2022: 26,769 oz. |
| — | 2023: 33,714 oz. |
| — | 2024: 36,636 oz. |
| — | 2025: 25,004 oz. |
| 2.2 | Terms of reference and purpose |
WSP was appointed by Namib to prepare this Technical Report Summary (TRS) to report Mineral Resources, and Mineral Reserves for the How Gold Mine effective 31 December 2025 . This TRS conforms to the United States Securities and Exchange Commission’s (SEC) Modernized Property Disclosure Requirements for Mining Registrants as described in Subpart 1300 of Regulation S-K, Disclosure by Registrants Engaged in Mining Operations (S-K 1300), and Item 601(b)(96) of Regulation S-K. Mineral Resources and Mineral Reserves reported herein are supported by annual report statements prepared by Namib Minerals in accordance with S-K 1300 requirements.
The WSP Qualified Persons (QPs) who have prepared this TRS meet the QP requirements defined by the SEC.
The TRS utilises:
| — | Australian English spelling. |
| — | Metric units of measure. |
| — | Gold grades presented in grams per tonne (g/t). |
| — | Co-ordinate system presented in metric units using Cape/Lo29. |
| — | United States Dollars (USD). |
Summary Mineral Resources and Mineral Reserves in Table 1.1, Table 1.2, Table 1.3, and Table 1.4 are presented based on a Namib Minerals equity ownership basis (100%).
Key acronyms and definitions used in this TRS include those items listed in Table 2.1.
| Table 2-1 | List of acronyms and abbreviations used in this TRS |
| Acronym/Abbreviation | Description |
| ° | Degrees |
| °C | Degrees Celsius |
| ACZ | Airport Company of Zimbabwe (Private) Limited |
| AMD | Acid Mine Drainage |
| amsl | Above mean sea level |
| APF | Assay Plan Factor |
| ASCII | American Standard Code for Information Interchange |
| Attica | Attica Mines (Pvt) Ltd. |
| Project No PS229049 | WSP |
| How Mine | March 2026 |
| S-K 1300 Technical Report Summary | Page 9 |
| Namib Minerals |
| Acronym/Abbreviation | Description |
| Ballarat | Ballarat Mines (Pvt) Ltd |
| BBR | Beitbridge Bulawayo Railway (PVT) LTD |
| BCF | Block Call Factor (a mine call factor) |
| BD | Bulk Density |
| BGB | Bulawayo Greenstone Belt |
| BIF | Banded Iron Formation |
| BF | Block Factor |
| BMC Limited | Bulawayo Mining Company Limited |
| BMC Zimbabwe | Bulawayo Mining Company (Private) Limited Zimbabwe |
| BMC UK | Bulawayo Mining Company (UK) Limited |
| CAD | Computer-Aided Design |
| Capex | Capital Expenditure |
| CFM | Cubic Feet per Metre |
| CIP | Carbon in Pulp |
| C&M | Care and Maintenance |
| COG | Cut Off Grade |
| CPR | Competent Person’s Report |
| CRM | Certified Reference Material |
| CV | Coefficient of Variation |
| DRC | Democratic Republic of Congo |
| DXF | Drawing Exchange Format |
| EBIT | Earnings Before Interest and Taxes |
| EBITDA | Earnings Before Interest, Taxes, Depreciation, and Amortization |
| EDA | Exploratory Data Analysis |
| EIA | Environmental Impact Assessment |
| EMA | Environmental Management Agency |
| EMP | Environmental Management Plan |
| Enmin | Enmin Consulting (Private) Limited. |
| ESIA | Environmental and Social Impact Assessment |
| FGB | Filabusi Greenstone Belt |
| Frobisher | Frobisher Ltd. |
| FS | Feasibility Study |
| Goldfields | Goldfields Development Co. Ltd |
| Project No PS229049 | WSP |
| How Mine | March 2026 |
| S-K 1300 Technical Report Summary | Page 10 |
| Namib Minerals |
| Acronym/Abbreviation | Description |
| g | Grams |
| g/l | Grams per litre |
| g/t | Grams per tonne |
| ha | Hectares |
| Halo | Halo Co. Ltd |
| HGM | How Gold Mine |
| IML | Independence Mining (Private) Limited |
| ISO | International Organization for Standardization |
| Independence | Independence Mining (Pvt) Ltd. |
| JMN | Joshua Mqabuko Nkomo International Airport |
| kg | Kilograms |
| km | Kilometres |
| km2 | Square kilometres |
| koz | Thousand ounces |
| kt | Thousand tonnes |
| ktpa | Thousand tonnes per annum |
| ktpm | Thousand tonnes per month |
| kV | Kilovolts |
| l/s | Litres per second |
| LOM | Life of Mine |
| Lonmin plc | Lonmin |
| Lonrho | Lonrho Zimbabwe (Pvt) Ltd. |
| m | Metres |
| M | Million |
| MAR | Mean annual run-off |
| MCF | Mine Call Factor |
| Ml | Megalitre |
| ML | Mining Lease |
| mm | millimetre |
| MMC Zimbabwe | Mazowe Mining Company (Private) Limited Zimbabwe |
| MPa | Megapascal |
| Middindi | Middindi Consulting Pty Ltd |
| Mt | Million tonnes (metric) |
| Project No PS229049 | WSP |
| How Mine | March 2026 |
| S-K 1300 Technical Report Summary | Page 11 |
| Namib Minerals |
| Acronym/Abbreviation | Description |
| mVA | Megavolt-ampere |
| NPV | Net Present Value |
| NRZ | National Railways of Zimbabwe |
| OK | Ordinary Kriging |
| opex | Operating Expenditure |
| oz | Ounce |
| PSA | Pressure Swing Absorption |
| QAQC | Quality Assurance Quality Control |
| QP | Qualified Person |
| Rhodesian | Rhodesian Gemstones (Pvt) Ltd. |
| RMC Zimbabwe | Redwing Mining Company (Private) Limited Zimbabwe |
| RMR | Rock mass rating |
| ROB | Rough-Ore-Bin |
| ROM | Run of Mine |
| RPEE | Reasonable Prospects for Economic Extraction |
| RTGS | Real Time Gross Settlement |
| SAMREC | South African Mineral Resource Committee |
| SD | Standard Deviation |
| SG | Specific Gravity |
| SHEQ | Safety, Health, Environment and Quality |
| SRK | SRK Consulting (South Africa) (Pty) Ltd |
| t | Tonne |
| t/m3 | Tonnes per cubic metre |
| tpm | Tonnes per month |
| TRS | Technical Report Summary |
| TSF | Tailings Storage Facility |
| UK | United Kingdom |
| μm | Micrometre |
| USD | United States Dollar |
| WSP | WSP Australia Pty Limited |
| Wt.% | Weight percent |
| ZESA | Zimbabwe Electricity Supply Authority |
| ZETDC | Zimbabwe Electricity Transmission and Distribution Company |
| Project No PS229049 | WSP |
| How Mine | March 2026 |
| S-K 1300 Technical Report Summary | Page 12 |
| Namib Minerals |
| Acronym/Abbreviation | Description |
| ZiG | Zimbabwe gold currency |
| ZINIRE | Zimbabwe National Institute of Rock Engineering |
| ZWL | Zimbabwean Dollar |
| 2.3 | Sources of information |
This TRS relies upon various reports and other material prepared by Namib Minerals and information from staff and consultants as provided to WSP. This data and information have been supplemented with information in the public domain, and through information gathered during a site inspection by WSP in February 2026 (Section 2.4).
WSP has taken reasonable care to ensure that the information contained in this TRS is in accordance with the facts and information available to it and is unaware of any omission likely to affect its import.
| 2.4 | Personal inspection |
Information in this TRS has been prepared under the supervision of the WSP QPs for Geology/Resources and Mining/Reserves.
The WSP geologist and mining engineer visited the site between 24 February 2026 and 25 February 2026. The WSP geologist reviewed the regional and deposit geology with senior personnel from the management, geology and mining teams. They visited the core storage facility to review the deposit geology, core logging, sampling, analytical, QAQC, and core/sample chain of custody and archiving processes and also visited the site laboratory, the sand dumps and a surface drill rig drilling potential new resource areas above the 10 Level.
WSP QPs visited the operating underground mine (active development and production areas) and surrounding area and observed exploration drilling occurring on the 30 Level.
During the personal inspection, the WSP QPs interviewed senior personnel from the management, geology and mining teams regarding recent mine performance, practices and financial performance.
| 2.5 | Previously filed Technical Report Summaries |
This is the second TRS filed for the Property. The first TRS was filed in January 2024, with an effective date of 31st December 2023.
| 2.6 | WSP declaration |
The opinions of QPs in the employ of WSP contained herein and effective 31 December 2025, are based on information collected throughout the course of investigations by the QPs. The information in turn reflects various technical and economic conditions at the time of preparing the TRS. Given the nature of the mining business, these conditions can change significantly over relatively short periods of time. Consequently, actual results may be significantly more or less favourable.
This TRS may include technical information that requires subsequent calculations to derive sub-totals, totals, and weighted averages. Such calculations inherently involve a degree of rounding, and consequently introduce a margin of error. Where these occur, the QPs do not consider them to be material.
Neither WSP, nor the QPs responsible for this TRS, are insiders, associates, or affiliates of Namib or any of its subsidiaries. The results of the technical review by the QPs are not dependent on any prior agreements concerning the conclusions to be reached, nor are there any undisclosed understandings concerning any future business dealings.
| Project No PS229049 | WSP |
| How Mine | March 2026 |
| S-K 1300 Technical Report Summary | Page 13 |
| Namib Minerals |
| 2.7 | Statement of Independence |
WSP has provided and continues to provide technical consulting services to Namib Minerals with respect to its mineral assets; some of that work is referred to in this report. The work is carried out independently on a fee for service basis. Fees generated from Namib Minerals are not material to WSP either locally or globally. The QPs have not previously worked on projects for Namib Minerals and in our opinion, WSP’s association with Namib Minerals does not impact on the independence of this report. Furthermore:
| — | WSP and the authors of this report have no material present or contingent interest in or association with Namib Minerals, and their subsidiaries or the assets under review. Individual employees of WSP may hold non-material securities holdings in these entities either directly or indirectly. |
| — | WSP has had no material association during the previous two years with the owners/promoters of the mineral assets, the company acquiring the assets or any of the assets to be acquired and has no material interest in the projects. |
| — | There are no business relationships between WSP and Namib Minerals. WSP or its employees and associates are not, nor intend to be, a director, officer or other direct employee of Namib. The relationship with Namib Minerals is solely one of professional association between client and independent consultant. |
| — | WSP does not hold and has no interest in the securities of Namib Minerals and its subsidiaries under review. |
| — | WSP has no relevant pecuniary interest, association or employment relationship with Namib Minerals and its subsidiaries. |
| — | WSP has no interest in the material tenements, the subject of the Report. |
| — | WSP is not a substantial creditor of an interested party, nor has WSP a financial interest in the outcome of the proposal. The review work and this report are prepared in return for professional fees based upon agreed commercial rates and the payment of these fees is in no way contingent on the results of this report. |
| — | The Report has been prepared in compliance with the Australian Corporations Act and ASIC Regulatory Guide 112 with respect to WSP’s independence as experts. |
| — | Fees for the preparation of this report are being charged at WSP’s standard schedule of rates, with expenses being reimbursed at cost plus a handling charge. Payment of fees and expenses is in no way contingent upon the conclusions of this report. |
| — | Based on the information provided to WSP and to the best of its knowledge, WSP has not become aware of any material change or matter affecting the validity of the report. |
| Project No PS229049 | WSP |
| How Mine | March 2026 |
| S-K 1300 Technical Report Summary | Page 14 |
| Namib Minerals |
| 3 | Property description |
| 3.1 | Property location |
The Property is located in Matabeleland South Province, Zimbabwe, approximately 30 km southeast of the city of Bulawayo (latitude 20°18’S and longitude 28°46‘E), in the Bulawayo Mining District of Zimbabwe.
The location of the Property and its proximity to major infrastructure is presented in Figure 3.1.
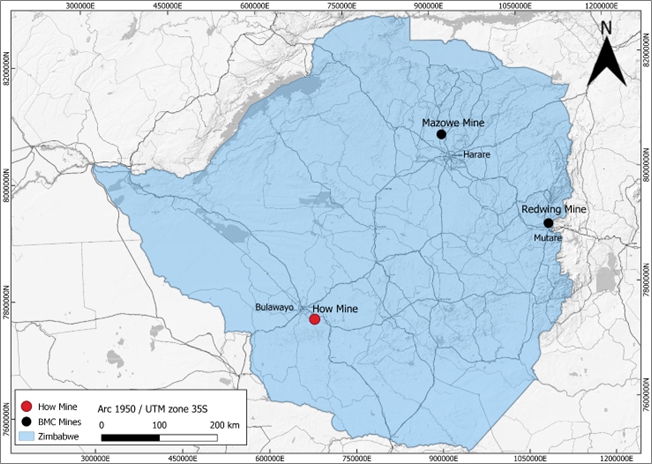
Figure 3.1 Property location map
| 3.2 | Title and mineral rights |
BMC Zimbabwe, a wholly owned subsidiary of BMC UK, which is a wholly owned subsidiary of Namib Minerals, holds ML 28. The area covered by ML 28 has a surface area of 2,408 ha. ML 28 is renewed annually, and the current certificate is valid until 17 August 2026.
Isolated cases of artisanal gold mining activities have been reported along some streams, and historical workings within the ML area. Artisanal activity is largely concentrated along the Mzingwane River, on the southern margins of the ML area.
| Project No PS229049 | WSP |
| How Mine | March 2026 |
| S-K 1300 Technical Report Summary | Page 15 |
| Namib Minerals |
Figure 3.2 presents the ML 28 boundary.
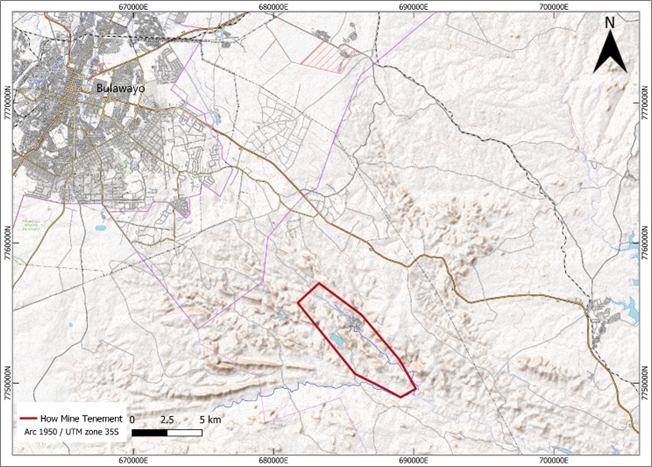
Figure 3.2 HGM ML 28 boundary
While WSP has referred to tenement holdings in this TRS, such reference is for convenience only and may not be complete or accurate. WSP is not expert in tenement management and the reader should not rely on information in this TRS relating to the current ownership and legal standing of the tenements or any encumbrances impacting on those tenements. This TRS assumes that all tenements and tenement applications are in good standing and free of all encumbrances other than those set out in this TRS.
| 3.3 | Encumbrances |
There are no known significant encumbrances to the Property that would impact the current Mineral Resources or Mineral Reserves.
| 3.4 | Risks to access, title or right to perform work |
Access to the mine site and to the ore is authorised by the applicable mining legislation, and BMC Zimbabwe’s title and mining rights (Section 3.2). Mining exploration and exploitation works conducted or to be conducted on site are authorised in accordance with the applicable legislation, and BMC Zimbabwe’s title and mining rights (Section 3.2). Other required permits and authorisations (e.g., environmental, building, etc.) are applied for by BMC Zimbabwe in accordance with the applicable legislation.
| Project No PS229049 | WSP |
| How Mine | March 2026 |
| S-K 1300 Technical Report Summary | Page 16 |
| Namib Minerals |
| 3.5 | Agreements and royalties |
In 2022, the government of Zimbabwe has promulgated new regulations through Statutory Instrument 189 of 2022 to the effect that mineral royalties are to be paid partly in kind and partly in monetary form. The mineral royalties are collected from minerals specified in terms of section 49(1)(c1) of the Reserve Bank of Zimbabwe Act [Chapter 11:15] deemed to be components of the reserves maintained by the Reserve Bank of Zimbabwe. Minerals include but are not limited to gold, diamonds, platinum group metals and lithium. These regulations have also caused timeous amendments to the Finance Act and the Reserve Bank of Zimbabwe Act to ensure the cooperation in application of legislation (BMC 2023b).
In 2024, the monetary component was revised.
Royalties remitted to the Zimbabwe Revenue Authority in respect of gold and those minerals specified are paid based on 50% in kind and 50% in monetary form. With regards the “in kind component”, miners submit actual minerals they would have extracted. The 50% monetary component would be paid as follows:
| — | 37.5% in the Zimbabwe Gold (ZiG) currency. |
| — | 12.5% in foreign currency (RBZ 2024). |
| — | Prior to the promulgation of these regulations, royalties were paid only in monetary form. |
| — | A US$21 per kilogram (/kg) realisation fee is also charged for gold lodged with Fidelity Printers and Refiners (BMC 2023b). |
| 4 | Accessibility, climate, local resources, infrastructure, and physiography |
| 4.1 | Topography, elevation, and vegetation |
The HGM is located at an altitude of approximately 1,250 m above mean sea level (amsl). The surrounding hills range between 1,230 and 1,410 m amsl, and the property drains southeast towards the Mzingwane River (BMC 2023b).
The natural vegetation of the Property is veldt, which covers the gently undulating hills and slopes. Various types of mixed woodland species are naturally found throughout the area. However, the natural vegetation in the area has not been significantly disturbed particularly by forestry activities and historic mining activity dating back to early 1941. Invader plants include amongst others Eucalyptus (gum tree). The majority of the vegetation in the area consists of indigenous plants (BMC 2023b).
| Project No PS229049 | WSP |
| How Mine | March 2026 |
| S-K 1300 Technical Report Summary | Page 17 |
| Namib Minerals |
| 4.2 | Access and proximity to population centres |
The HGM is located approximately 30 km southeast (by road) of the city of Bulawayo (latitude 20°18’S and longitude 28°46‘E), which has a population of approximately 1.5 million (urban plus rural areas).
Bulawayo is serviced by Joshua Mqabuko Nkomo International Airport (JMN), operated by the Airport Company of Zimbabwe (Private) Limited (ACZ), which has the capacity to handle 1.5 million passengers per annum (ACZ 2024), and by rail. The National Railways of Zimbabwe (NRZ) provides both freight services (NRZ 2024a), and passenger services (NRZ 2024b), whilst the Beitbridge Bulawayo Railway (PVT) LTD (BBR) provides a dedicated freight service to South Africa.
The Property is accessible via a sealed road from Bulawayo, which is in fair condition.
| 4.3 | Climate |
The HGM operates continuously throughout the year, with no interruptions due to seasonal changes.
Bulawayo is located in the tropics but due to its high altitude has a sub-tropical climate, classified as hot semi-arid climate (BSh) under the Köppen climate classification. The average annual temperature is 19 degrees Celsius (°C), with maximum daily temperatures ranging from 21°C in July to 30°C in October and cool nightly minimum temperatures ranging from 7°C in July to 16°C in January. Bulawayo experiences three distinct seasons: a dry cool winter from May to August; a hot dry early summer from August to November; and a warm wet late summer from November to April (BMC 2023b).
The mean annual rainfall is 575 millimetres (mm) falling mostly between November and February. However, the region is vulnerable to drought and wet season rainfall can vary significantly from one year to the next. 888 mm of rain fell between December and February in 1978, while only 84 mm fell during the same period in 1983 (BMC 2023b).
Table 4.1 and Figure 4.1 present climate statistics for Bulawayo, Zimbabwe.
Table 4-1 Mean temperatures in Bulawayo (World Meteorological Organization)
| Month | Jan | Feb | Mar | Apr | May | Jun | Jul | Aug | Sep | Oct | Nov | Dec |
| Mean Maximum (°C) | 27.7 | 27.2 | 27.1 | 25.9 | 24.1 | 21.6 | 21.5 | 24.4 | 27.9 | 29.4 | 28.7 | 27.7 |
| Mean Temperature (°C) | 21.8 | 21.2 | 20.6 | 18.7 | 16.0 | 13.7 | 13.8 | 16.4 | 19.9 | 21.6 | 21.7 | 21.4 |
| Mean Minimum (°C) | 16.5 | 16.2 | 15.3 | 13.0 | 9.9 | 7.4 | 7.2 | 9.1 | 12.4 | 15.0 | 16.0 | 16.3 |
| Mean Rainfall (mm) | 117.8 | 104.6 | 51.4 | 33.3 | 7.0 | 2.2 | 1.0 | 1.4 | 7.0 | 38.4 | 91.1 | 120.3 |
| Mean rainy days | 10 | 8 | 5 | 3 | 1 | 1 | 0 | 0 | 1 | 4 | 8 | 10 |
Notes: Climatological information is based on monthly averages for the 30-year period 1961–1990.
| Project No PS229049 | WSP |
| How Mine | March 2026 |
| S-K 1300 Technical Report Summary | Page 18 |
| Namib Minerals |
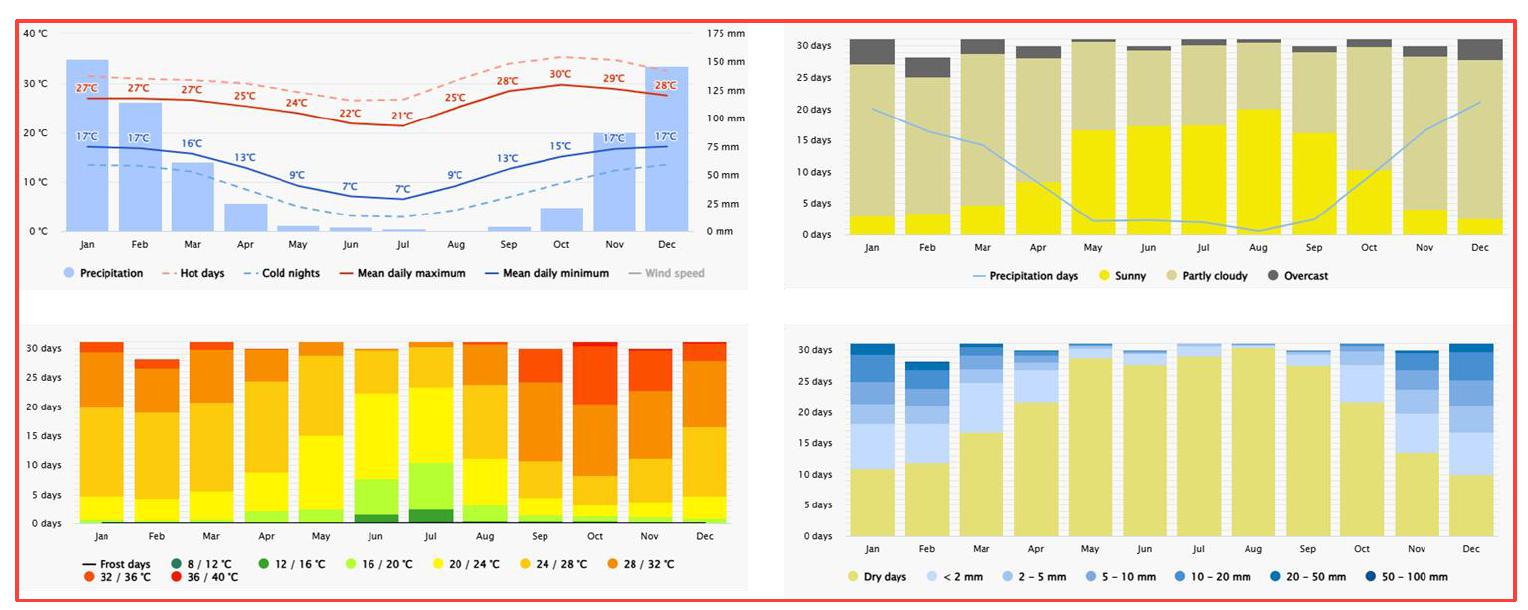
Figure 4.1 Climate statistics for Bulawayo, Zimbabwe (Meteoblue 2026)
| 4.4 | Local resources and existing infrastructure |
| 4.4.1 | Power supply |
Electricity is provided from the national grid through the Springs and Criterion lines at 7.5 Megavolt Ampere (MVA), and 2.5 MVA respectively. The lines are operated by the Zimbabwe Electricity Supply Authority (ZESA).
| 4.4.2 | Water supply |
Water used in the operations is obtained from a dam on the Gabalozi River (on the mine site) and the Chimedza Dam (located approximately 7 km west of the mine location). Drinking water is provided from a line supplying the City of Bulawayo. Water is also supplied by way of water bores drilled on site.
| 4.4.3 | Personnel |
For the 40,500 tonnes per month (tpm) throughput, budgeted employee establishment is 1,023 of whom 111 are managerial employees. The staff is largely housed on-site, in family accommodation, except for a few members of staff who are bussed in from Bulawayo daily.
| 4.4.4 | Suppliers |
The principal raw materials used in the mining operations are fuel, electricity (Section 4.4.1), and water (Section 4.4.2). Diesel fuel is used to power front-end loaders, tractors, motor vehicles, and standby power generators. The mine is currently upgrading the on-site fuel pump station to a holding capacity of 35,000 litres.
| Project No PS229049 | WSP |
| How Mine | March 2026 |
| S-K 1300 Technical Report Summary | Page 19 |
| Namib Minerals |
| 5 | History |
| 5.1 | Exploration and ownership history |
The Property draws on over 60 years of exploration field activities and previous studies.
The HGM claims were first pegged as a greenfields discovery in July 1941. In August 1941, the claims were transferred to the Halo Syndicate, which changed the name to Halo Co. Ltd (Halo) in October 1943. Two quarries had been established by July 1944, with the southern quarry developed to a depth of 30 m. The accompanying processing facility had a 19-stamp battery. During the period 1950-1951, the mine was put on option to Goldfields Development Co. Ltd (Goldfields) [BMC 2023a].
Frobisher Ltd. (Frobisher) had an option on the mine in the period 1952-1953. In the same period, a diamond drilling program totalling 2,020 m was undertaken. This program indicated potential for a large tonnage operation, with an average grade of 4.90 grams per tonne (g/t) Au. The option was abandoned in 1953, effectively ceasing all processing operations. Ballarat Mines (Pvt) Ltd (Ballarat) took over the mine in June 1954 and sunk the main shaft between the two open pits (BMC 2023a).
The property was taken over by Lonrho Zimbabwe (Pvt) Ltd. (Lonrho) in 1973, first under the name of Rhodesian Gemstones (Pvt) Ltd. (Rhodesian), then Attica Mines (Pvt) Ltd. (Attica) and eventually Independence Mining (Pvt) Ltd. (Independence), in 1986. Since 1970, the mine has operated continuously and is one of the largest gold producers in the Matabeleland region. In October 2002, Lonrho relinquished ownership of Independence to Metallon (BMC Limited). In 2016, the name changed from How Mine to Bulawayo Mining Company (Pvt) Ltd (BMC) after the parent company. Metallon (BMC Limited) separated the group’s mines into standalone mining operations (BMC 2023a).
HGM is now wholly owned and operated through Namib Minerals, which acquired Bulawayo Mining Company Limited (BMC)—the long-standing operator of the mine—in 2025 from Greenstone Corporation. Following this transaction, Namib Minerals holds 100% indirect ownership of HGM, while BMC continues to function as the on-site operator under the new corporate structure.
The surface footprint of the mineral rights owned by Namib at the HGM covers an area of 2,408 ha. Isolated cases of illegal gold mining activities have been reported along some streams and historical workings located within the ML. The majority of artisanal mining activity is concentrated along the Mzingwane River, on the southern margins of the ML area (BMC 2023a).
| 5.2 | Production history |
Total gold produced from the HGM between 1941, and 2025 is approximately 1.84 million ounces (Moz).
| Project No PS229049 | WSP |
| How Mine | March 2026 |
| S-K 1300 Technical Report Summary | Page 20 |
| Namib Minerals |
Figure 5.1 presents total gold production from the HGM for the period 1941–2025.
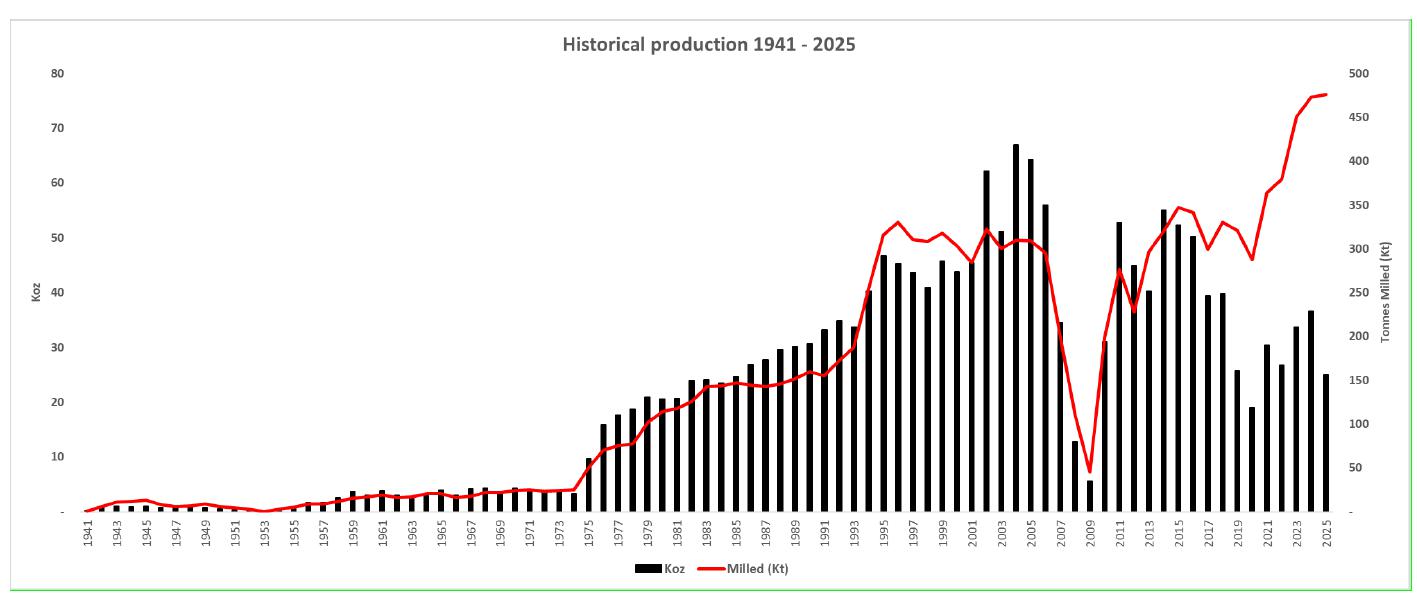
Figure 5.1 HGM total gold production 1941–2025
| Project No PS229049 | WSP |
| How Mine | March 2026 |
| S-K 1300 Technical Report Summary | Page 21 |
| Namib Minerals |
| 5.3 | Production reconciliation |
The Property’s MRMR as of the end of the 2025 and 2024 calendar years are compared in Table 5.1. WSP sourced the 2024 MRMR numbers from Metallon’s Mineral Reserves and Mineral Resources (MRMR) Estimates ( (Metallon Corporation, 2024).
Key variances between 2024 and 2025 are summarised as follows:
Mineral Resources
| — | Measured Resources: There has been a large increase in tonnes and ounces in Measured material due to an updated mineralisation domaining cut-off and a complete re-interpretation of the mineralisation to include the entire deposit, rather than small, discrete areas as was done in previous estimates. Due to the drop in reporting cut-off (where the MSO shapes were created using a 0.6 g/t Au cutoff), the grade of Measured material has dropped from 1.8 g/t Au to 1.3 g/t Au. |
| — | Indicated Resources: Similar to the commentary above on the changes in Measured inventory, the Indicated resource has significantly increased by 538% of overall ounces. The tonnage has increased significantly with a reduction in grade from 1.7 g/t Au to 1.4 g/t Au, reflecting the lower cut-off grade applied. |
| — | Inferred Resources: There has also been a very large increase in the Inferred Underground resource due to the re-interpretation process and the drop in reporting cut-off grade. The tonnes and ounces have increased dramatically with the grade dropping from 2.4 g/t Au to 2.1 g/t Au due to the lower cut-off grade applied to mining and in defining the mineralisation domains. The tailings material has remained steady. |
Mineral Reserves
| — | Total Underground: A 30% increase in Proved Reserves, and a 10% decrease in Probable Reserves, leading to a 10% increase in total gold ounces: |
| — | Proved Reserves tonnage increased by 120%, while grade reduced by 0.92 g/t, leading to a net increase of 30% in contained gold. The Proved Reserves change is driven by the updated block model and new stopes mainly below 30L. |
| — | Probable Reserves tonnage decreased by 17%, with an increase in grade of 0.07 g/t, to yield a 10% reduction in contained gold. The Probable Reserves change derives from the updated block model and a significant increase in Probable to Proved conversion. |
| — | Surface: No change to the No. 3 & 4 tailings dam (sands) Probable Reserve. |
Table 5-1 MRMR summary comparison end December 2024 to end December 2025
| Category | 31 December 2024 | 31 December 2025 | Var. (%) | |||||
| Tonnes (Mt) | Au Grade (g/t) | Au (koz) |
Tonnes (Mt) | Au Grade (g/t) | Au (koz) |
Au (koz) | ||
| Mineral Reserves | ||||||||
| Proved Mineral Reserves UG | 0.5 | 2.32 | 37 | 1.1 | 1.40 | 48 | 30% | |
| Probable Mineral Reserves UG | 0.6 | 1.63 | 31 | 0.5 | 1.70 | 28 | -10% | |
| Total Mineral Reserves UG | 1.1 | 1.91 | 68 | 1.6 | 1.50 | 76 | 12% | |
| No 3 & 4 Sands Dam – Probable Reserves | 0.8 | 0.89 | 26 | 0.8 | 0.89 | 26 | 0% | |
| Total Mineral Reserves | 1.9 | 1.46 | 94 | 2.4 | 1.29 | 103 | 10% | |
| Project No PS229049 | WSP |
| How Mine | March 2026 |
| S-K 1300 Technical Report Summary | Page 22 |
| Namib Minerals |
| Category | 31 December 2024 | 31 December 2025 | Var. (%) | |||||
| Tonnes (Mt) | Au Grade (g/t) | Au (koz) |
Tonnes (Mt) | Au Grade (g/t) | Au (koz) |
Au (koz) | ||
| Mineral Resources | ||||||||
| Measured Mineral Resources | 0.26 | 1.8 | 15 | 13.7 | 1.32 | 583 | 3,887% | |
| Indicated Mineral Resources | 1.58 | 1.7 | 86 | 10.2 | 1.41 | 463 | 538% | |
| Total M+I Mineral Resources | 1.84 | 1.7 | 101 | 23.9 | 1.36 | 1,046 | 1,036% | |
| Inferred Mineral Resources UG | 2.42 | 2.7 | 211 | 31.0 | 2.18 | 2,176 | 1,031% | |
| Inferred Mineral Resources – Tailings | 11.54 | 0.6 | 220 | 12.0 | 0.59 | 220 | 0% | |
| Total Mineral Resources | 17.79 | 1.05 | 532 | 66.9 | 1.60 | 3,442 | 647% | |
Notes: Numbers are rounded, Mineral Resources exclude Mineral Reserves, and Mineral Reserves are inclusive of dilution and ore loss. 2024 MROR Au grade was provided rounded to one decimal place.
| 5.4 | Aggregate fiscal year production |
Aggregate production over the past 5 years is provided in Table 5.2. Annual production has ramped up as shown.
Table 5-2 Aggregate calendar year production ending December 2021–2025
| Year | Process (Mt)
|
Au
Grade (g/t) |
Contained Au (Koz) | Process Recovery (%) |
Recovered Au (Koz) |
Variance % (Tonnage) |
Variance % (oz) |
| 2021 | 363.5 | 2.92 | 34.08 | 89.14 | 30.3 | 0% | 0% |
| 2022 | 379.5 | 2.45 | 29.86 | 89.65 | 26.7 | 4% | -12% |
| 2023 | 450.3 | 2.60 | 37.65 | 89.55 | 33.7 | 24% | 10% |
| 2024 | 473.0 | 2.66 | 40.51 | 90.44 | 36.6 | 0% | 11% |
| 2025 | 476.0 | 1.84 | 28.19 | 88.69 | 25.0 | -6% | -13% |
| Total | 2,142 | 2.47 | 170.29 | 89.49 | 152.3 | -5% | 6% |
| 5.5 | Exploration and development by previous owners or operators |
Previous exploration and development are discussed in Section 5.1.
| Project No PS229049 | WSP |
| How Mine | March 2026 |
| S-K 1300 Technical Report Summary | Page 23 |
| Namib Minerals |
| 6 | Geological setting, mineralisation, and deposit |
| 6.1 | Regional geology |
The HGM is located in the Umzingwane Formation of the Bulawayo Greenstone Belt (BGB). The Umzingwane Formation occupies an area broadly in the centre of an almost triangular shaped greenstone belt that tapers to the southeast, and links with the Filabusi Greenstone Belt (FGB) to the east (BMC 2023b).
Figure 6.1 presents a simplified regional geology map of Zimbabwe and the locations of major greenstone belts. The BGB is situated proximal to the city of Bulawayo.
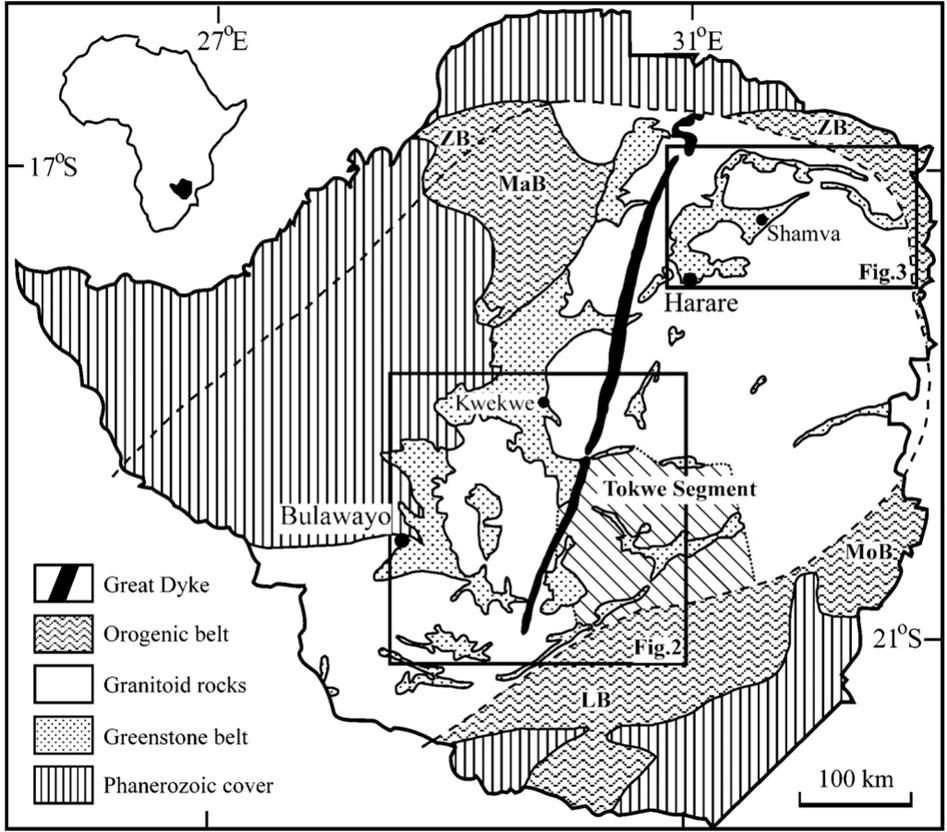
Figure 6.1 Regional geology of Zimbabwe showing location of Greenstone Belts (Prendergast 2004)
The lithological units characteristic of the Umzingwane Formation include clastic metasediments, fine-grained tuffaceous rocks, banded shales and siltstones, ferruginous cherts or Banded Iron Formation (BIF), and rhyodacites and andesitic lavas. This assemblage has been subjected to metamorphism of lower greenschist facies (BMC 2023b).
| Project No PS229049 | WSP |
| How Mine | March 2026 |
| S-K 1300 Technical Report Summary | Page 24 |
| Namib Minerals |
Figure 6.2 presents the regional geology of the HGM area.
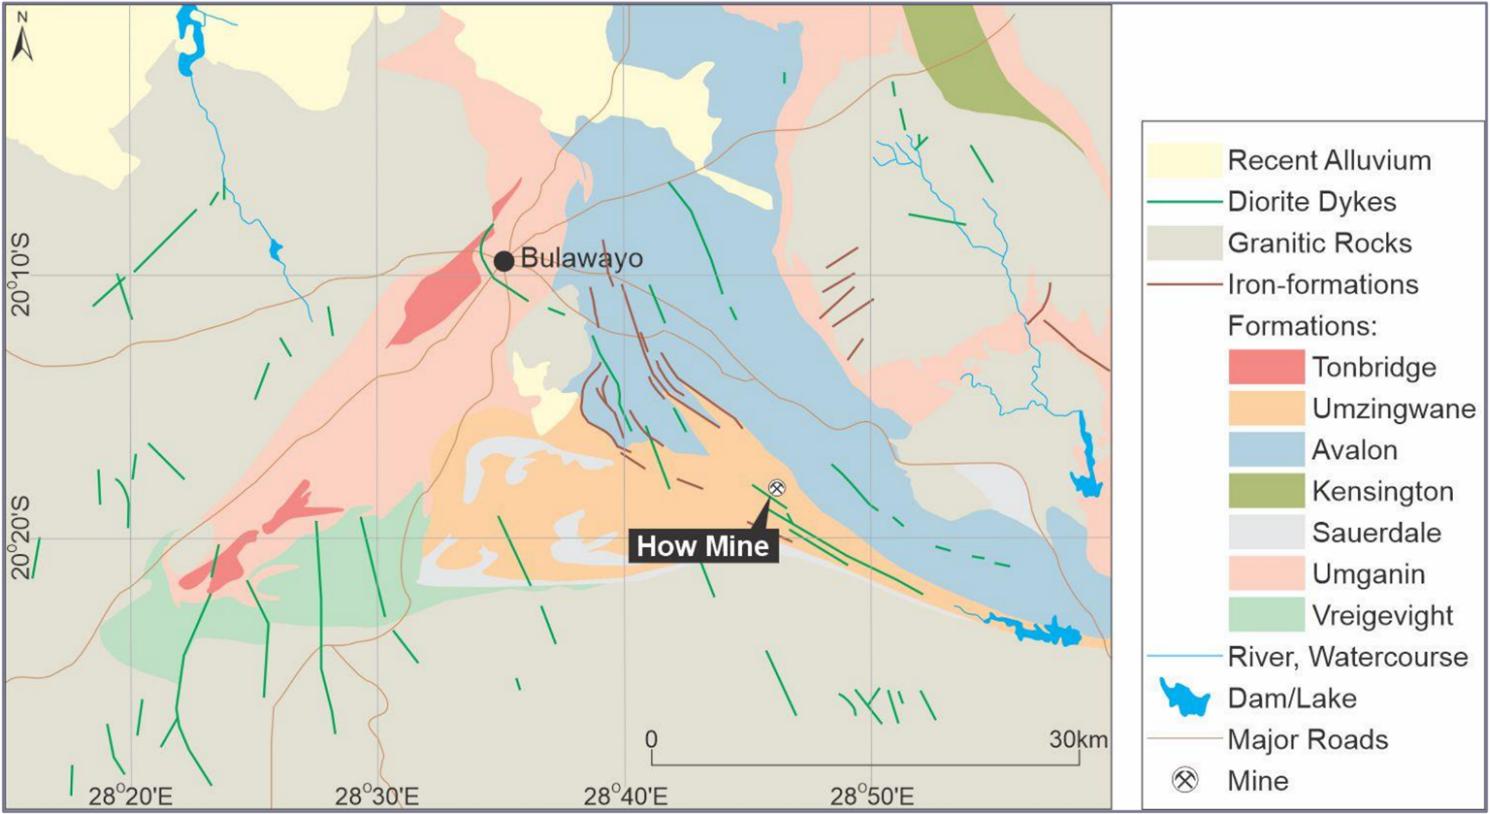
Figure 6.2 Regional geology of the HGM area (BMC Limited)
| 6.2 | Structural setting |
The setting of the volcaniclastic sediments is thought to be a rift-type basin, possibly fault bounded. Part of the deformation in the Upper Greenstones affecting the Umzingwane Formation is due to the intrusion of diapiric granites such as the Esigodini Granite to the east. The effects of this deformation phase were significant shortening, thrusting and shearing. Rocks within the Umzingwane Formation are strongly deformed, with shortening in the northeast-southwest direction and extension along a northwest-southeast axis. The How and Umzingwane shears are oriented in this direction (BMC 2023b).
| 6.3 | Local and Property geology |
The area around the HGM was geologically mapped in detail in 1976. This geological mapping work established a sequence of talc-chlorite schist, laminated black shale, silicate facies BIF, tuffaceous units and siltstone from southwest to northeast (BMC 2023b).
The occurrence of felsic porphyry intrusions and mafic dykes in local quarries is also expressed in exposures underground. The disposition of the quarries show that the ore channel locally transgresses lithological boundaries and is therefore not strictly stratabound (BMC 2023b).
| Project No PS229049 | WSP |
| How Mine | March 2026 |
| S-K 1300 Technical Report Summary | Page 25 |
| Namib Minerals |
Figure 6.3 presents the local geology of the HGM area.
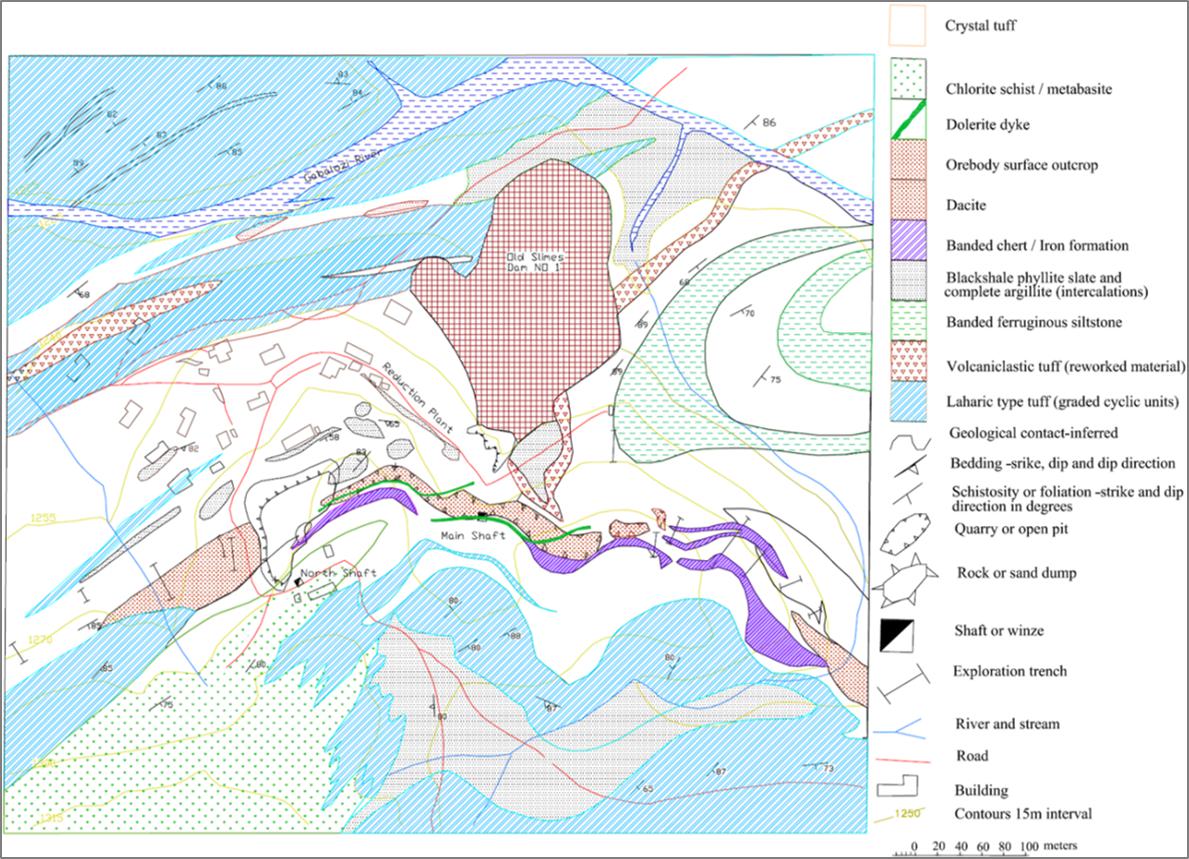
Figure 6.3 Local geology of the HGM area (BMC 2023b)
Figure 6.4 presents simplified stratigraphic columns for the Umzingwane Formation (which hosts the HGM), Avalon Formation, and Kensington Formation.
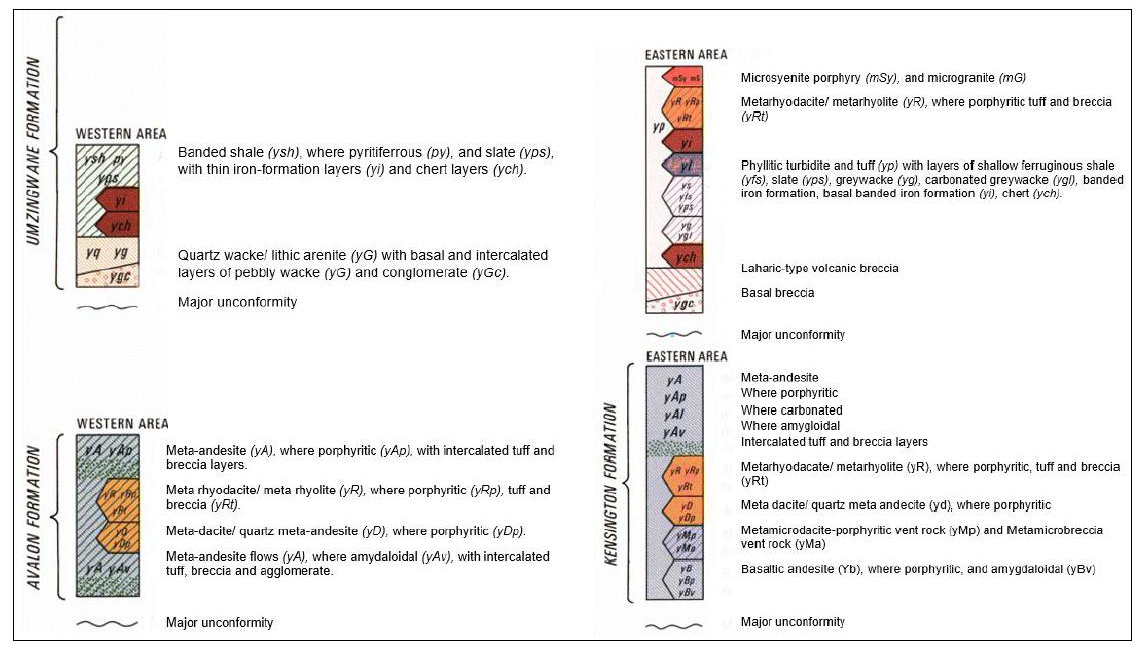
Figure 6.4 Simplified stratigraphic columns for the Umzingwane, Avalon, and Kensington formations (BMC Limited)
| Project No PS229049 | WSP |
| How Mine | March 2026 |
| S-K 1300 Technical Report Summary | Page 26 |
| Namib Minerals |
| 6.4 | Deposit type and geology |
The geological and structural information seen in the open pits provides some insight into the structural controls that are believed to be responsible for the localisation of mineralisation at the HGM. The main control is believed to be an extensional duplex, with a long axis oriented along the direction of extension (BMC 2023b).
Previous models suggesting that the ore was stratabound within felsites and was syngenetic in nature have now been disregarded due to the transgressive nature of the mineralisation. The felsites are in fact, propylitised tuffs. Prominent shears are evident on both the hangingwall and footwall contacts of the ore channel, and these represent the principal shears of the duplex system (BMC 2023b).
A new theory being tested suggests that the hangingwall contact of the dacite controlled mineralisation in the main orebodies on both strike and dip. This theory is evident when a composite plan of the mine is viewed. All development that continued into the hangingwall contact of the dacite, both north and south, does not contain significant mineralisation when compared to the main orebodies. However, there are some orebodies in the top section of the mine that are hosted in dacite. It appears that these orebodies are located at the central inflection point of the hangingwall dacite contact. This phenomenon is observed above the 16 Level. This theory is significant in terms of defining future exploration targets within the dacite hangingwall contact envelope and within the dacite itself and suggests the possibility of another “trouser leg” orebody plunging to the south (BMC 2023b).
| 6.5 | Mineralisation |
Orebodies are generally elliptical in plan, strike to the north, and dip steeply at approximately 80° to the west, with a steep northerly plunge. The major orebodies are the 300N, 180N, 350N, 400N, and 10S, which have a combined strike length of approximately 500 m. A low-grade parting separates the 300N and 180N orebodies, which becomes narrower at depth, and below the 20 Level is approximately 5 to 10 m in width.
Current information from deep diamond drilling indicates that the orebodies gradually taper in width with depth and become shallower in dip i.e. approximately 60°. The deposit shows significant hydrothermal alteration is frequently associated with sulphide mineralisation. Strong carbonation, silicification, and in extreme cases propylitisation occur together with sulphides. Pyrite is the dominant sulphide, with significantly less chalcopyrite and occasional pyrrhotite present. Chalcocite and arsenopyrite have also been reported. Ore microscopy has shown that gold is associated with a late generation of pyrite and chalcocite. The location of gold mineralisation is either in fractures within the sulphides or on sulphide grain surfaces (BMC 2023b).
Mineralisation at the HGM is thought to have been formed by hydrothermal solutions migrating along structurally controlled channels, predominantly caused by an extensional duplex, with its long axis parallel to the direction of extension. Recent underground exploration drilling between the 30 Level and 32 Level, has identified three new orebodies, namely 320N, 330N, and 360N, which are situated in the footwall of 300N and are hosted within the dacite, a completely different environment when compared to the other orebodies. (BMC 2023b).
While these orebodies appear as discrete mineralisation packages, referred to by the numeric orebodies (e.g. 300N), they are contained within a single low grade mineralisation halo.
| Project No PS229049 | WSP |
| How Mine | March 2026 |
| S-K 1300 Technical Report Summary | Page 27 |
| Namib Minerals |
Figure 6.5 presents a typical cross-section of ore zones within tuff.
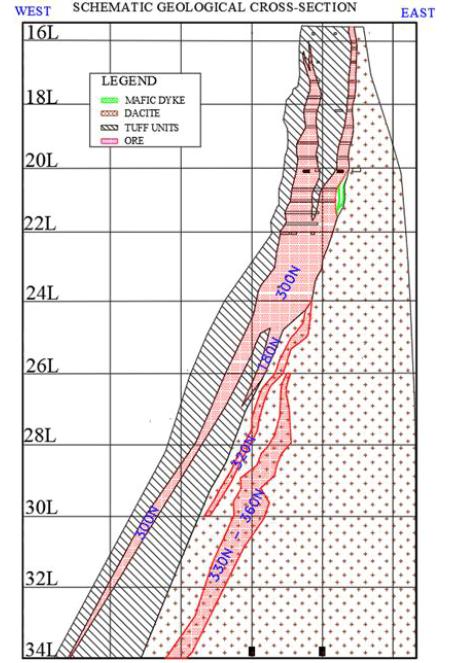
Figure 6.5 Typical cross-section of ore zones within tuff (Edelrod 2024)
| Project No PS229049 | WSP |
| How Mine | March 2026 |
| S-K 1300 Technical Report Summary | Page 28 |
| Namib Minerals |
| 7 | Exploration |
Exploration at the Property is based on detailed geological mapping that established the following sequence from southwest to northeast: talc-chlorite schist, laminated black shale, silicate facies BIF, tuffaceous units, and siltstone (Edelrod 2023).
The occurrence of felsic porphyry intrusions, and mafic dykes in historical quarries is also expressed in underground exposures. This shows that the mineralisation channel locally transgresses lithological boundaries and is therefore not strictly stratabound (Edelrod 2023).
Locally, a new theory is being tested which suggests that the hanging-wall contact of the dacite was a control on mineralisation of the main orebodies along strike and up and down dip. A plan view of the mine shows that all development that proceeded past the hanging-wall contact of the dacite (north and south) contains lower amounts of mineralisation when compared to the main orebodies. However, there are some orebodies in the top section of the mine that are hosted in dacite. Investigating the new theory is significant in terms of defining future exploration targets within the dacite hangingwall contact envelope, and within the dacite itself. This theory suggests the possibility of another “trouser leg” orebody plunging to the south (Edelrod 2023).
Channel sampling, diamond drilling, trench and sludge drilling samples were used for the purposes of geological modelling and Mineral Resource estimation.
| 7.1 | Diamond drilling |
Diamond drill core is logged and sampled at a nominal 1 m interval, depending on geology. Samples are taken to at least 5 m beyond the geologically defined mineralisation boundary in all drill holes. Core recovery averages >98% (BMC 2023b) and a visual review of core by the QP showed excellent recovery and few zones of broken core.
Core size is AXT (32.5 mm core diameter) and BQ (36.4 mm core diameter) for resource delineation, and exploration drill holes respectively (BMC 2023b).
Collars are surveyed using a Total Station. Downhole survey is conducted using a multishot digital downhole survey tool.
| Project No PS229049 | WSP |
| How Mine | March 2026 |
| S-K 1300 Technical Report Summary | Page 29 |
| Namib Minerals |
A long section view of all HGM diamond drill hole collars and existing mine development is provided in Figure 7.1.
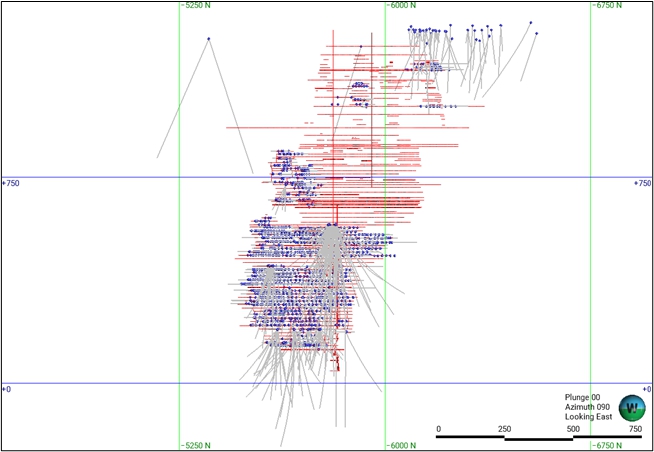
Figure 7.1 Long Section view, looking East of all HGM diamond drill hole collars, traces and existing mine development
| 7.1.1 | Exploration drilling 2025 |
The 2025 diamond drilling campaign at the How Mine formed the primary basis for updating the Mineral Resources in the deeper areas of the deposit. A total of 147 drill holes were completed for 8,216 m (Figure 7.2), distributed across the 13L, 17L, 18L, 30L, and 32L levels. Of the total drilled, 136 holes correspond to horizontal drill holes (resource delineation holes), with a combined length of 5,540 m, while the remaining holes are inclined drill holes totalling 2,676 m, which were drilled from the 30L level.
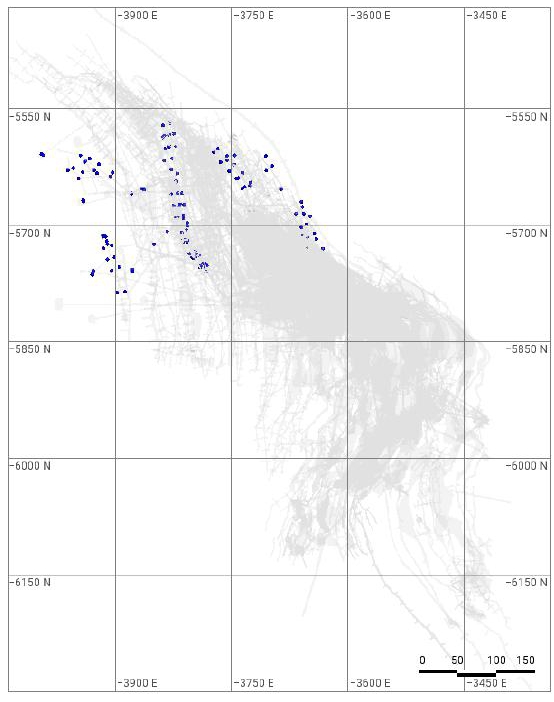 | 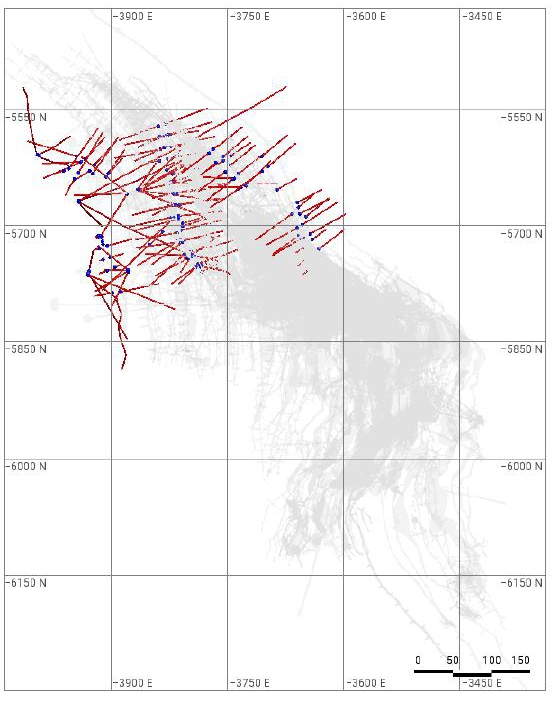 |
Figure 7.2 Plan view of 2025 drill hole collars (left) and traces (right), with existing mine development shown in grey
| Project No PS229049 | WSP |
| How Mine | March 2026 |
| S-K 1300 Technical Report Summary | Page 30 |
| Namib Minerals |
| 7.1.1.1 | 13L Drilling Plan (2025) |
Horizontal drilling targeted the 13L10m and 13Lev lift, where 4 drill holes were completed for a total of 165.3 m. The 13L (2025) drilling plan is presented in Figure 7.3.
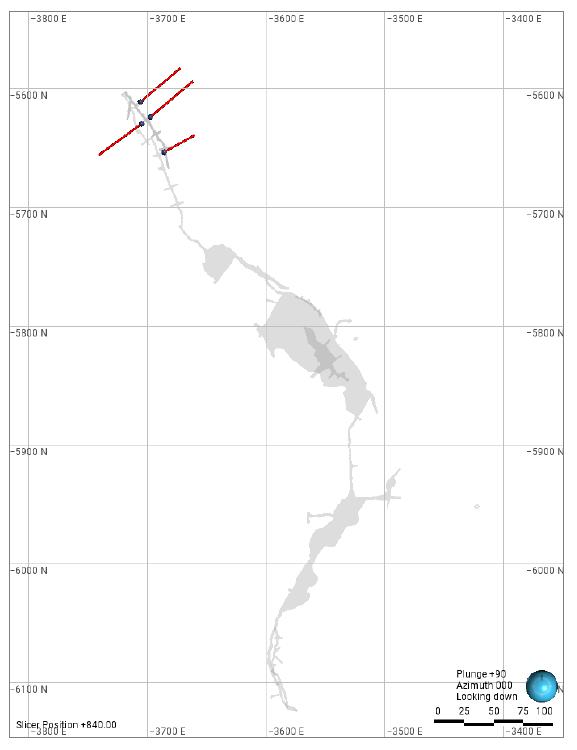
Figure 7.3 13L (2025) drilling plan
| Project No PS229049 | WSP |
| How Mine | March 2026 |
| S-K 1300 Technical Report Summary | Page 31 |
| Namib Minerals |
| 7.1.1.2 | 17L Drilling Plan (2025) |
Horizontal drilling targeted the 17L20m and 17Lev lift, where 19 drill holes were completed for a total of 739 m. The 17L (2025) drilling plan is presented in Figure 7.4.
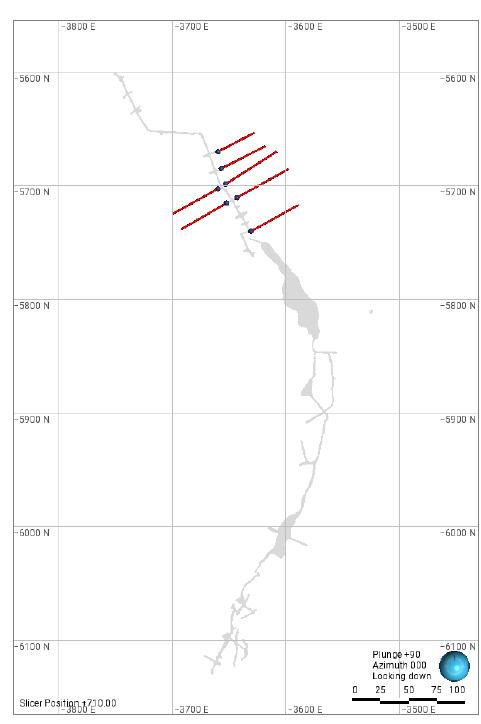 | 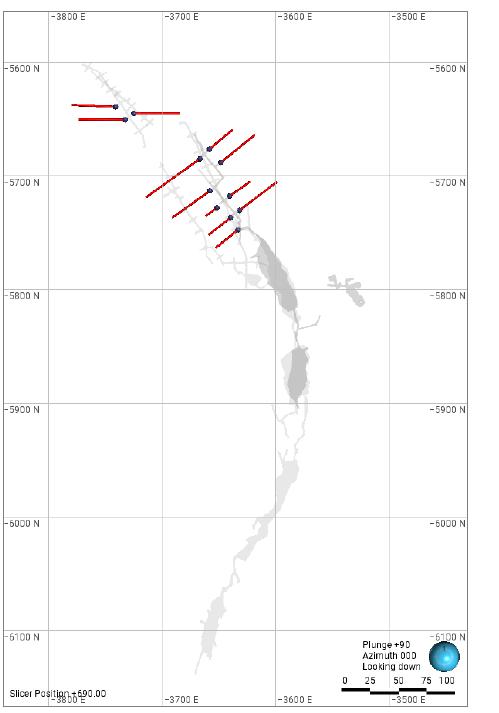 |
| Figure 7.4 | 17L (2025) drilling plan - 17L20m (left) and 17Lev (right) |
| Project No PS229049 | WSP |
| How Mine | March 2026 |
| S-K 1300 Technical Report Summary | Page 32 |
| Namib Minerals |
| 7.1.1.3 | 18L Drilling Plan (2025) |
Horizontal drilling targeted the 18L10m and 18L20m lift, where 12 drill holes were completed for a total of 476.1 m. The 18L (2025) drilling plan is presented in Figure 7.5.
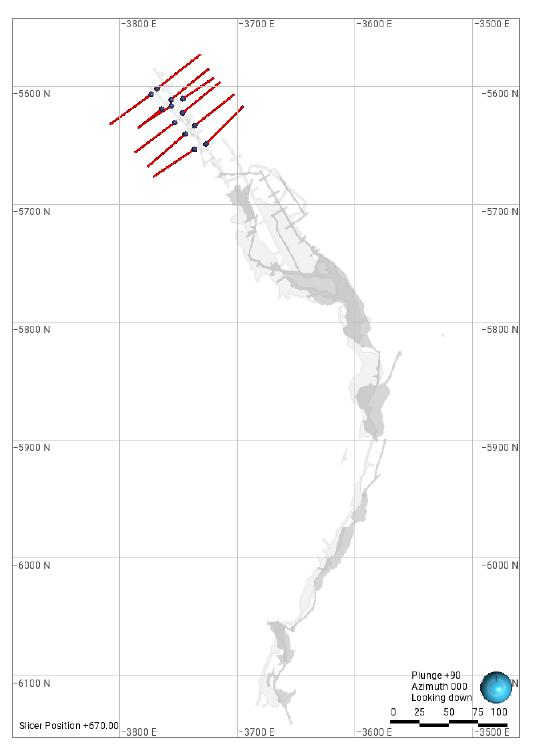
| Figure 7.5 | 18L (2025) drilling plan |
| Project No PS229049 | WSP |
| How Mine | March 2026 |
| S-K 1300 Technical Report Summary | Page 33 |
| Namib Minerals |
| 7.1.1.4 | 30L Drilling Plan (2025) |
Inclined drill holes were completed from the 30L lift, where 11 drill holes were drilled for a total of 2,676.7 m. The 30L (2025) drilling plan is presented in Figure 7.6.
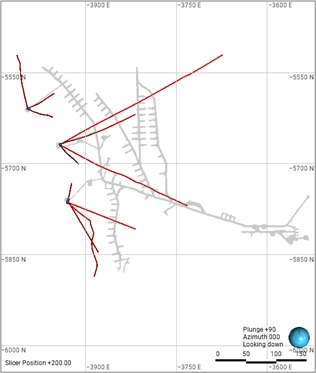 | 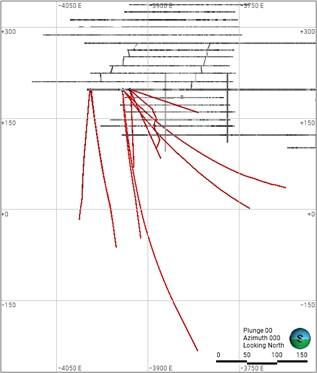 |
| Figure 7.6 | 30L (2025) drilling plan. Plan view (left) and section view (right) |
| Project No PS229049 | WSP |
| How Mine | March 2026 |
| S-K 1300 Technical Report Summary | Page 34 |
| Namib Minerals |
| 7.1.1.5 | 32L Drilling Plan (2025) |
Horizontal drilling targeted the 32L20m, 32L10m, and 32Lev lift, where 101 drill holes were completed for a total of 4,159.6 m. The 32L (2025) drilling plan is presented in Figure 7.7.
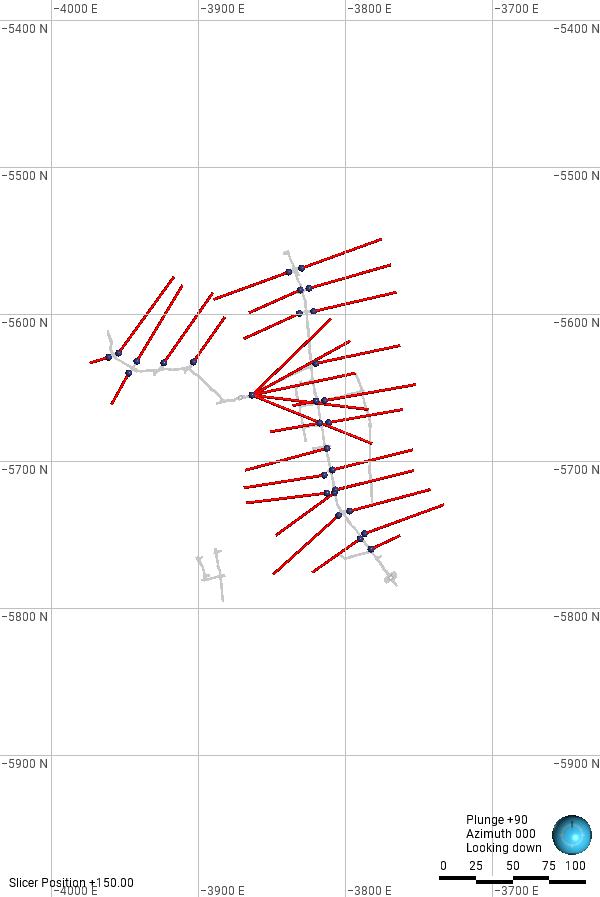 | 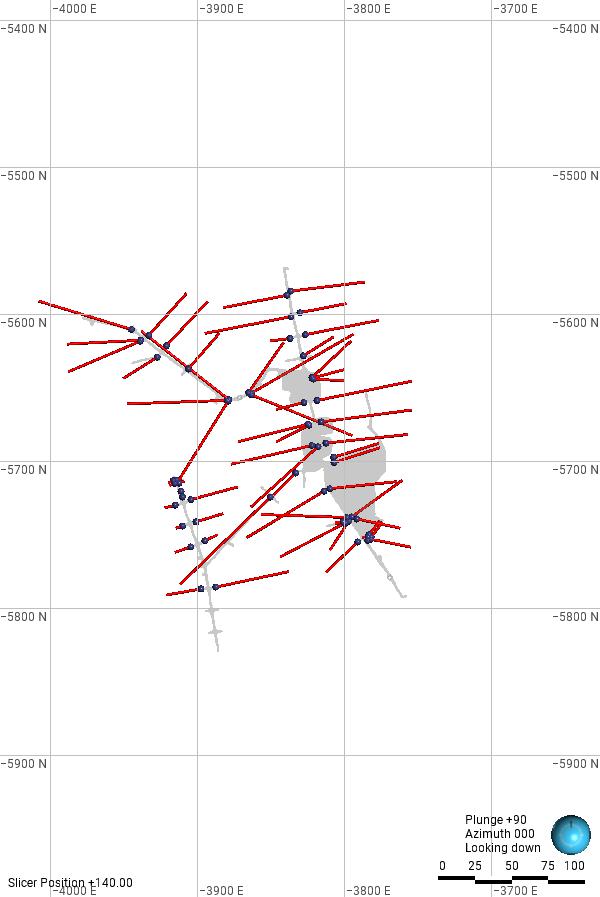 |
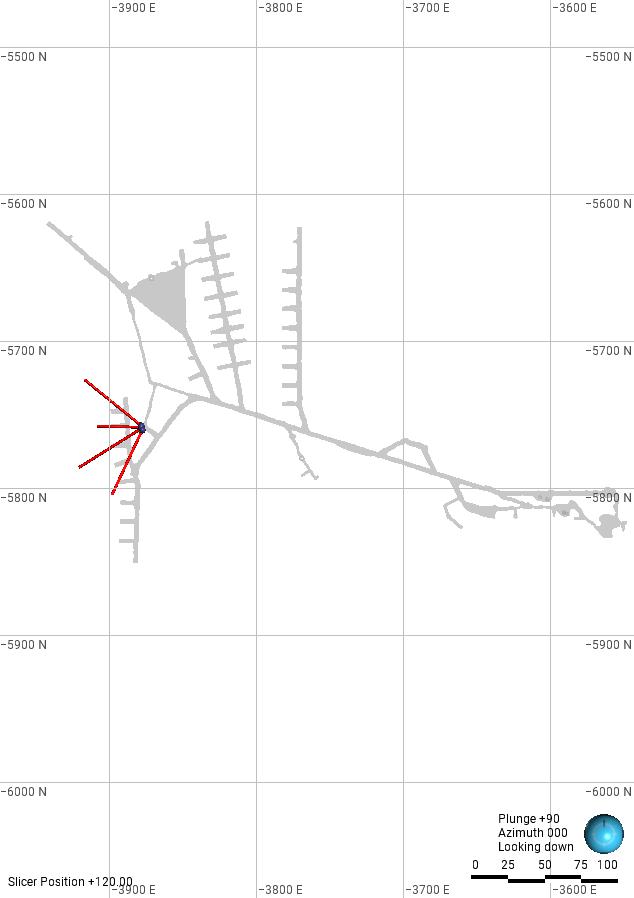
Figure 7.7 32L (2025) drilling plan - 32L20m (top left), 32L10m (top right), and 32Lev (bottom)
| Project No PS229049 | WSP |
| How Mine | March 2026 |
| S-K 1300 Technical Report Summary | Page 35 |
| Namib Minerals |
| 7.1.2 | Exploration drilling 2012-2023 |
Exploration holes drilled between 2012 to 2023 are summarised in the following section. All the hole collars were machine surveyed and downhole surveys were completed for determination of dip and azimuth deviations.
| 7.1.2.1 | 30L Drilling Plan (2021 -2023) |
Drilling targeting the 30L – 32L lift on the 300N, 320N, 360N and 400N orebodies. 19 holes totalling 5,596 m were drilled. The 30L (2021-2023) drilling plan is shown in Figure 7.8.
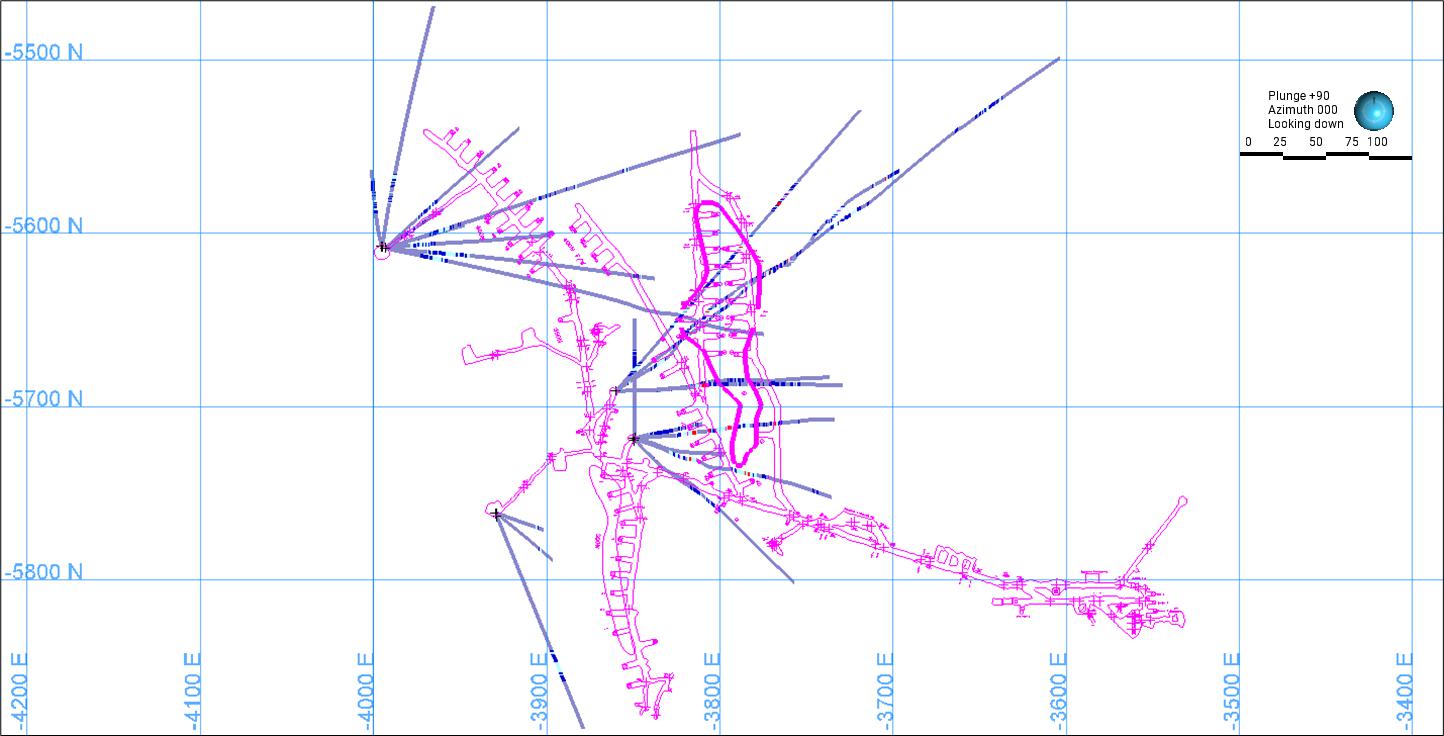
Figure 7.8 30L (2021–2023) drilling plan
| 7.1.2.2 | 24L Drilling Plan (2015–2016) |
Drilling was undertaken from two chambers on the 24L.
| — | In the 1st Chamber, 11 holes totalling 1,619 m were drilled targeting the 24L -26L lift of the 400N orebody. |
| — | In the 2nd Chamber, 9 holes totalling 2,276 m were drilled targeting the 26L – 28L lift the 400N orebody. |
| Project No PS229049 | WSP |
| How Mine | March 2026 |
| S-K 1300 Technical Report Summary | Page 36 |
| Namib Minerals |
The 24L (2015–2016) drilling plan is shown in Figure 7.9.
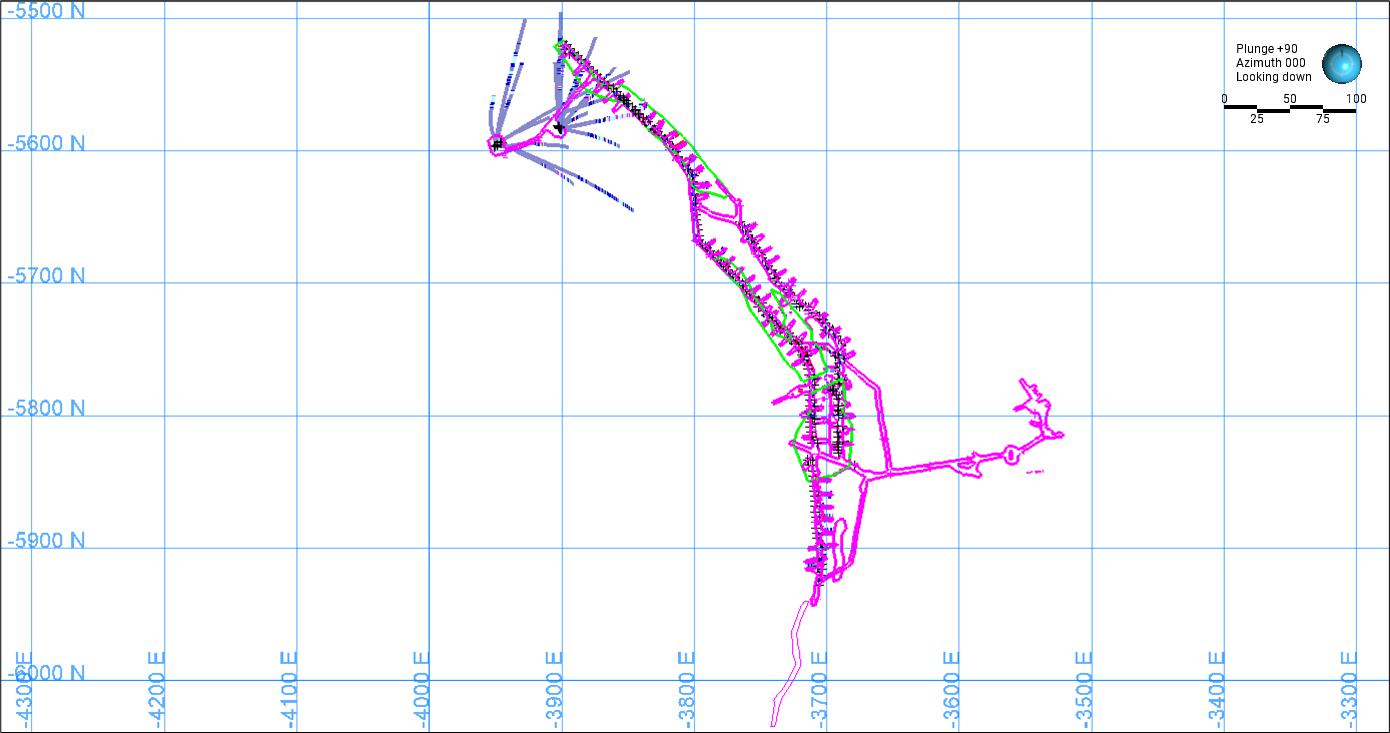
Figure 7.9 24L (2015–2016) drilling plan
| 7.1.2.3 | 26L Drilling Plan (2012–2013) |
Drilling was undertaken from the 1st chamber where 4 holes totalling 1,173 m were drilled targeting the 28L to 30L lift the 300N orebody.
The 26L (2012–2013) drilling plan is shown in Figure 7.10.
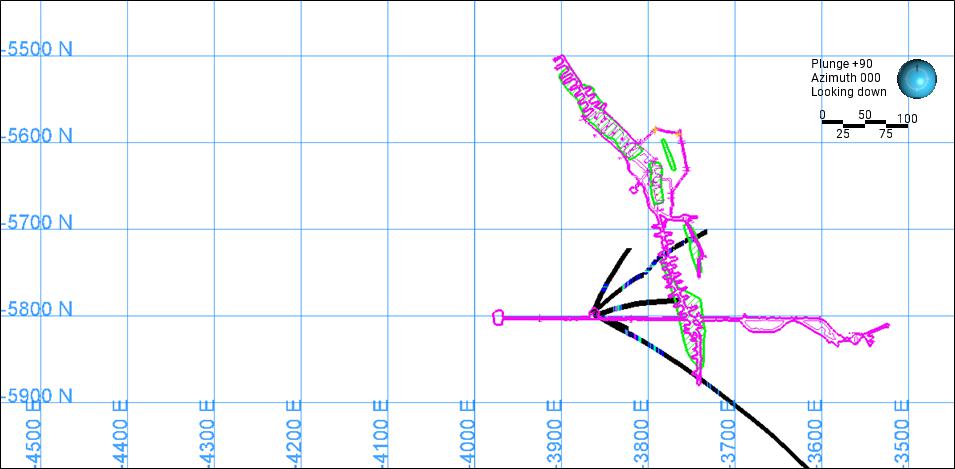
Figure 7.10 26L (2012–2013) drilling plan
| Project No PS229049 | WSP |
| How Mine | March 2026 |
| S-K 1300 Technical Report Summary | Page 37 |
| Namib Minerals |
| 7.2 | Sludge drilling |
Sludge drilling was formerly used for resource evaluation purposes. Sludge drill holes were sampled on 1 m intervals. Historical sludge drilling results remain in the resource database for mineralisation areas on or above the 20 Level. Sludge drilling has been phased out entirely due to questionable reliability. All evaluation below the 20 Level is based on diamond core and channel sampling only (BMC 2023b). Sludge samples have been included in the estimate due to them being the only available data in certain parts of the mine. Where there is no diamond drilling present and the estimate relies on the presence of sludge drilling, the Mineral Resource estimate has been classified as Inferred.
| 7.3 | QP’s opinion |
The QP considers the data collected including method of collection and storage to be appropriate for the preparation of geological models and Mineral Resources estimates, and that the data type and quality have been considered during resource classification.
| Project No PS229049 | WSP |
| How Mine | March 2026 |
| S-K 1300 Technical Report Summary | Page 38 |
| Namib Minerals |
| 8 | Sample preparation, analyses, and security |
| 8.1 | Sampling techniques |
The following types of samples are taken at the HGM and used to inform the Mineral Resource estimate:
| 8.1.1 | Core sampling |
The entire drill hole is sampled in the case of resource delineation drill holes, while only mineralised zones are sampled in the case of exploration drill holes as well as 5 m either side. For exploration drill holes, core is halved using a core splitter in the core shed. Half core is sampled and assayed, while the other half is archived.
Current practice is that half core and pulps from exploration drill holes are securely stored and only discarded after mining through the areas where drilling was completed.
| 8.1.2 | Channel sampling |
Channel sampling is undertaken using a pneumatic diamond-saw, to cut a 10 mm deep and 30 mm wide channel in the backs of development drives, or sidewalls of crosscuts. Channels are taken at 2 m intervals (and at 4 m intervals below the 22 Level) in the backs of development drives, and along sidewalls of crosscuts. The nominal sample length is 1 m; however, may be smaller to allow for variations in geology, apparent mineralisation, or excavation dimensions. The sampling interval was increased from 2 m to 4 m below the 22 Level following a variography study that demonstrated no material change to the definition of the deposit.
| 8.1.3 | Sample security |
Samples are collected and transported to the surface by an appointed sampler. Upon arrival on surface at the main shaft, the sampler is escorted by mine security to the secure on-site assay laboratory.
| 8.2 | Dry bulk density determination |
Dry bulk density (BD) determinations are completed at the on-site assay laboratory on selected diamond drill core samples. Previously, the geology technicians completed bulk density determinations. These determinations have indicated that there are only subtle variations between, or within orebodies. No clear relationship has been established between gold grade, and BD e.g., some waste material samples possess a higher value than ore.
Scientific Investments (now known as Duration Gold Limited [DGL]), a commercial analytical laboratory located in Bulawayo, initially completed a total of 105 BD determinations on core samples, and obtained a mean value of 2.8 g/cm³. This result was used to benchmark the accuracy of the in-house determinations completed which average less than 2.8 g/cm3. WSP recommend additional commercial laboratory samples are completed to allow application of different density values across the lithologies.
| 8.3 | Sample preparation, analysis, and procedures |
The on-site assay laboratory processes all samples collected from resource delineation diamond drilling, channel and face samples, draw-point grab samples, and processing plant samples.
Whole dried samples are crushed to -2 mm, riffle split to 500 g and pulverised in a Keegor Vertical Spindle pulveriser to 80% passing -75 micrometres (μm).
| Project No PS229049 | WSP |
| How Mine | March 2026 |
| S-K 1300 Technical Report Summary | Page 39 |
| Namib Minerals |
Approximately 4,000 samples are assayed each month. All samples are fire assayed with a gravimetric finish. The sample aliquot is 50 grams (g) for channel and drill core samples. Blanks and Certified Reference Material (CRM) samples are introduced at a rate of 2 samples for every 16 samples assayed. Repeat samples are also sent to the on-site assay laboratory on a regular basis. An assay repeats register is kept in the Geology Department for monitoring laboratory performance.
Exploration drill core samples from are sent to an external accredited laboratory (Antech, located in Kwekwe approximately 250 km from the HGM) for assaying. For every 16 pulp samples dispatched, two CRM samples are incorporated into the sample batch for Quality Assurance Quality Control (QAQC) purposes. Repeat samples of pulps to monitor precision are completed on mineralised intersections only.
Records of all samples collected and sent for assay are systematically kept in various ways that have an in-built back-up system. All samples collected underground have their details captured in a field logbook, from which they are transferred to daily return sheets and on-site assay laboratory submission/report sheets. These records are filed separately. For drill core assay results, records are captured in logbooks, log sheets, and computer and assay report sheets. Remaining sample pulp from exploration drill core samples is returned and kept in the sample library on site.
| 8.4 | Quality Assurance Quality Control |
The following QAQC procedures are used at the HGM:
| 8.4.1 | Channel sampling |
For channel samples, a CRM sample is inserted into each sample batch. The CRM’s are created using HGM material, ensuring matrix matched standards are used. CRM results are tested for compliance to set tolerance ranges, equal to two standard deviations from the designated mean value. No blanks are included in the channel sampling batches.
Any assay batches which contain standards which are outside of these tolerance ranges are re-assayed in their entirety. Data is subjected to analyses by scatter and regression plots.
WSP recommends introducing a blank into each sample batch and monitoring QAQC results on a monthly basis.
| 8.4.2 | Core sampling |
For core samples, a CRM sample is inserted every 14 samples. In some cases, a second CRM is inserted every 14 samples as well or alternatively, a duplicate is included.
Any assay batches which contain standards which are outside of these tolerance ranges are re-assayed in their entirety. Data is subjected to analyses by scatter and regression plots.
| 8.4.3 | 2025 QAQC results |
During 2025, Namib inserted a high-grade standard which changed ranged from an accepted value of 1.7g/t Au to 2.7 g/t Au. Three different high-grade standards were used over the year, and the graph is shown in Figure 8.1. The performance of the standards is considered acceptable. The standards were created for Namib using their own material and certified which ensures the matrix matches with typical HGM mineralisation. The values of the standards created change over time to align with current average mining grades.
| Project No PS229049 | WSP |
| How Mine | March 2026 |
| S-K 1300 Technical Report Summary | Page 40 |
| Namib Minerals |
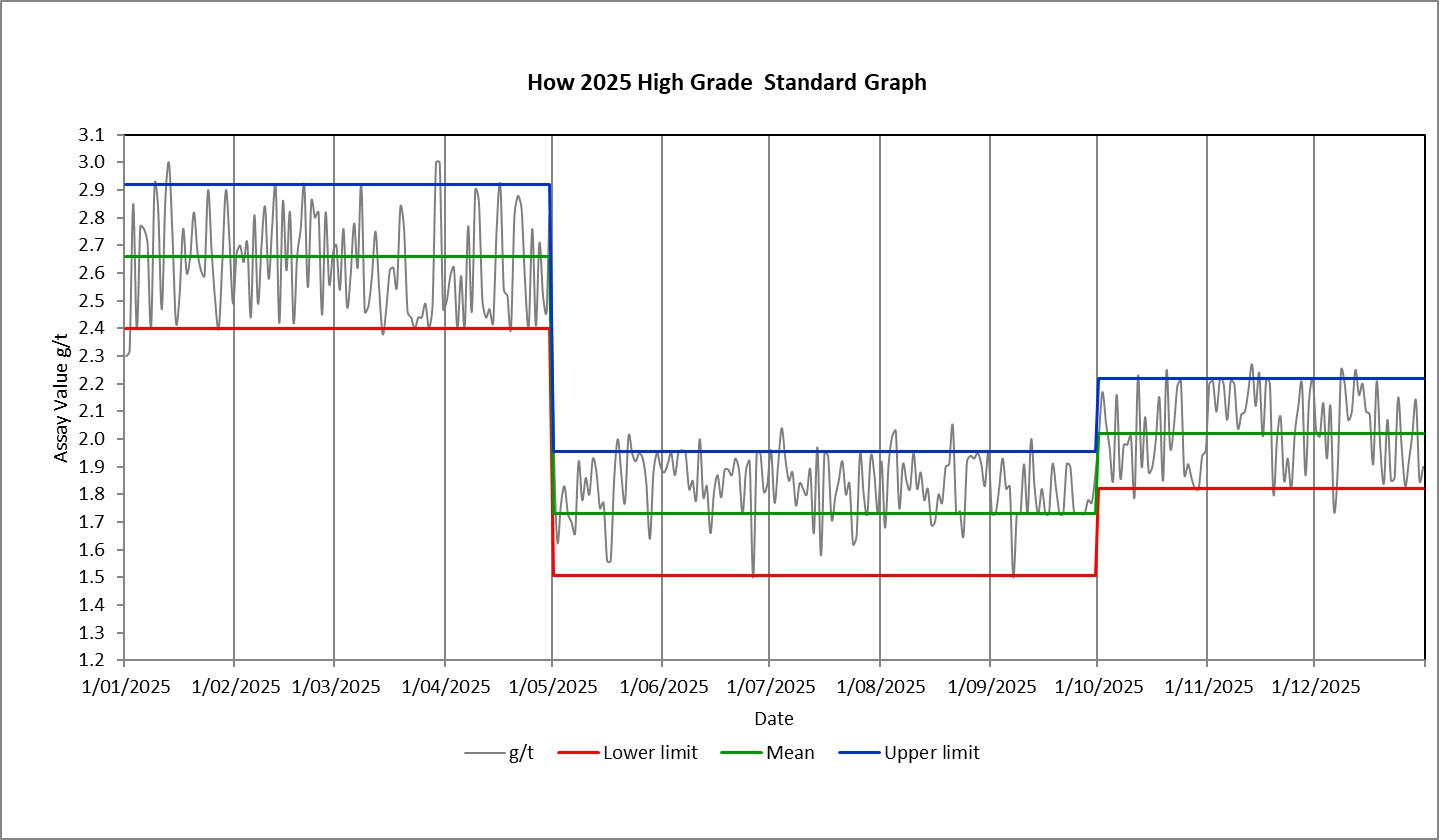
Figure 8.1 2025 Standard performance – high-grade standard
In addition to the high-grade standard, Namib also inserted a lower-grade standard which ranged in accepted value from 0.22 g/t Au to 0.38 g/t Au, the results of which are presented in Figure 8.2.
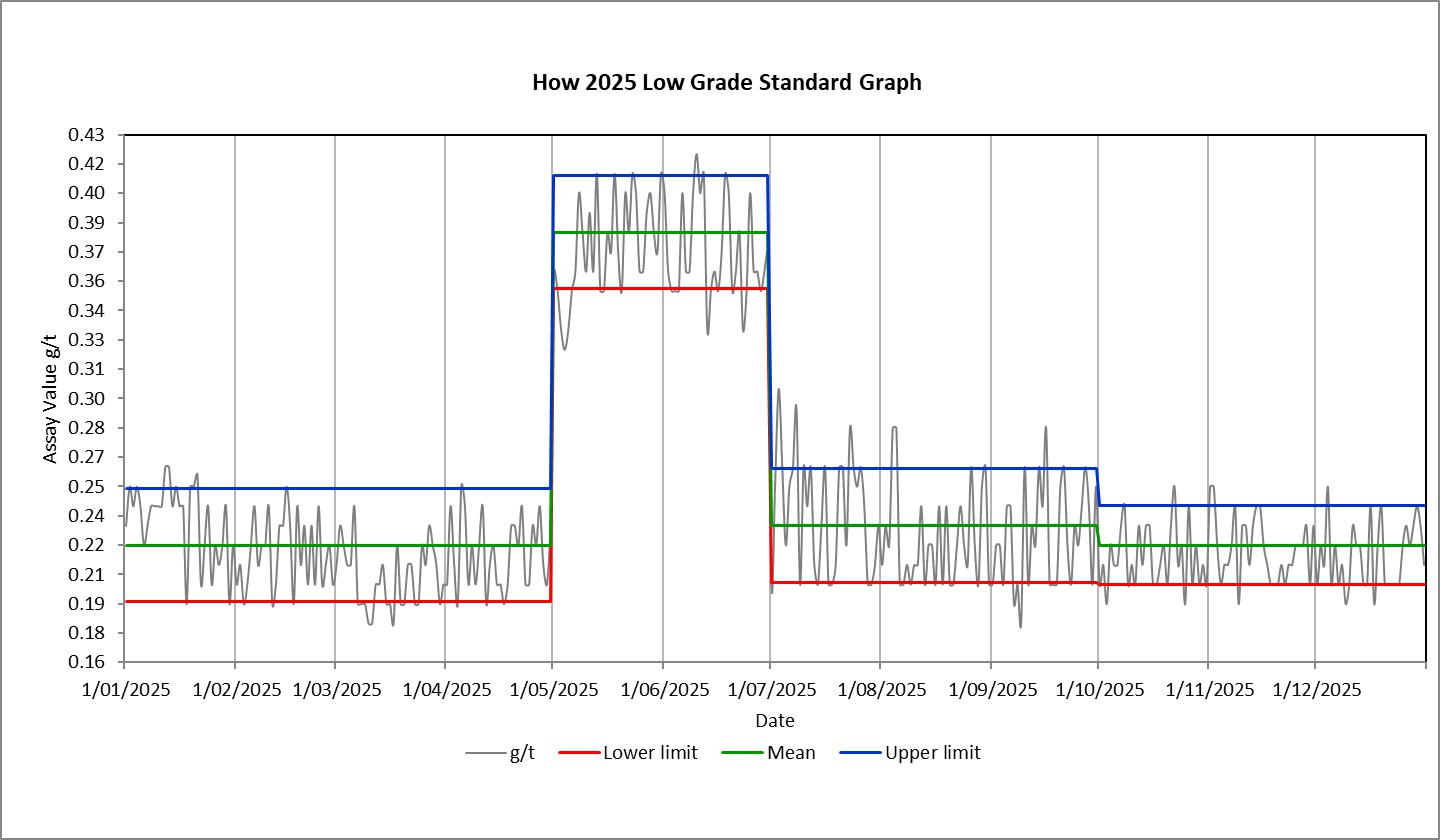
Figure 8.2 2025 Standard performance – low-grade standard
| Project No PS229049 | WSP |
| How Mine | March 2026 |
| S-K 1300 Technical Report Summary | Page 41 |
| Namib Minerals |
The on-site laboratory also sends off umpire samples to three external laboratories each month. Two of these laboratories are site laboratories located at the nearby Turk Mine (approximately 85 km north of the HGM) and at the Renco Mine (approximately 375 km east of the HGM) with one being a commercial laboratory (Performance Laboratories, located in Ruwa, 485 km northeast of the HGM). The results for January 2026 are shown in Figure 8.3 and show the How laboratory is reporting approximately 5% higher compared to the Turk Mine laboratory, 11% lower than the Renco Mine laboratory and 3% higher than the Performance Laboratory. Overall this suggests that the How on-site laboratory performs well compared to the other laboratories, particularly well with the commercial laboratory.

Figure 8.3 January 2026 Inter-laboratory Check Sample Results
| 8.5 | Bulk density |
Namib provided a total of 250 recent density measurements taken from diamond drill core and draw points as well as almost 4000 samples taken between 2007 and 2016. Previously, an assigned density of 2.8 g/cm3 has been used which aligns with the average density measurements received from 105 diamond drill core samples tested at an external laboratory (Scientific Investments) in 2000. Results do not suggest a clear correlation between density and grade. For the purpose of this estimate, a constant density of 2.8 g/cm3 has been utilised, consistent with previous estimates, however further analysis is recommended to inform future estimates.
Table 8-1 Summary of density samples taken between 2007 and 2016.
| Lithology | Number of Samples | Mean Density (g/cm3) | Mean Gold Grade |
| AGM | 1241 | 2.74 | 1.04 |
| DSH | 601 | 2.75 | 0.97 |
| CHT | 58 | 2.66 | 0.68 |
| CTF | 816 | 2.77 | 0.96 |
| DIO | 165 | 2.69 | 0.57 |
| DOL | 66 | 2.71 | 0.58 |
| LTF | 326 | 2.75 | 0.81 |
| MDK | 100 | 2.66 | 0.37 |
| MTF | 453 | 2.77 | 1.05 |
| TFF | 119 | 2.68 | 0.65 |
| Total | 3945 | 2.75 | 0.93 |
WSP recommends further review of density by domain and by lithology type to confirm the existing assumptions and a review of the density measurement process in addition to further analyses completed at the external laboratory.
| 8.6 | QP’s opinion on adequacy |
The QP considers the sample preparation, analyses, QAQC, and security protocols used at the Property to be appropriate in regard to the data used in the preparation of Mineral Resources estimates, and that the data has been considered during resource classification.
| Project No PS229049 | WSP |
| How Mine | March 2026 |
| S-K 1300 Technical Report Summary | Page 42 |
| Namib Minerals |
| 9 | Data verification |
| 9.1 | Mineral Resources data verification |
| 9.1.1 | Data verification conducted by BMC Zimbabwe |
Data validation conducted by BMC Zimbabwe was completed using Microsoft Excel, inbuilt Vulcan™ software validation tools, physical checks, and correction of any erroneous input data to ensure completeness, and integrity of captured data. Transcription errors were checked, identified, and corrected through direct comparison of captured data with data sources such as assay plans, and diamond drill core log sheets. Drill hole collar locations and elevations were inspected, verified and corrected in Vulcan™. Recently, on site geologists have started using Leapfrog software to assist with data verification activities.
| 9.1.2 | Data verification conducted by WSP |
The QP has validated the following geological and Mineral Resources estimation data:
| — | Drill hole collar locations |
| — | Drill hole downhole surveys |
| — | Drill hole assays |
| — | As built wireframes |
Some errors were identified in drill hole locations, surveys and as built wireframes which were discussed with site personnel and adjusted where necessary.
| 9.1.3 | Limitations on Mineral Resources data verification |
The QP was not directly involved in the exploration drilling, and sampling programs that formed the basis for collecting the data used in the geological modelling, and Mineral Resources estimation for the Property; however, the QP was able to observe drilling, sampling, and sample preparation methods at the HGM during the personal inspection (Section 2.4) and visited the on-site laboratory.
The QP is not aware of any other limitations on, nor failure to conduct appropriate data verification.
The QP has validated the data presented in Section 9.1, including collar survey, downhole geological data and observations, sampling, analytical, and other test data underlying the information or opinions contained in the written disclosure presented in this TRS. The QP has presented information relating to uncertainty in the estimates of Inferred, Indicated, and Measured Mineral Resources (Section 11.14), and opinions on factors likely to influence the prospect of economic extraction. A comprehensive list of Mineral Resources interpretations and conclusions, and Mineral Resources recommendations have also been presented in Sections 22.1 and 23.1 respectively.
Notwithstanding these matters, the QP considers the data used is acceptable for the purposes of geological modelling and Mineral Resources estimation.
| 9.2 | Mining and Mineral Reserves data verification |
WSP utilised the updated 2025 block model, and 2025 Mineral Resource as the basis for the Mineral Reserve:
| — | The supplied site BF, APF and BCF factors were also reviewed prior to use. |
| Project No PS229049 | WSP |
| How Mine | March 2026 |
| S-K 1300 Technical Report Summary | Page 43 |
| Namib Minerals |
The HGM financial model, used as the basis of the COG and pay limit calculations, as well as the economic analysis for the Mineral Reserve only Life of Mine Plan (LOMP) was also reviewed and deemed suitable for use in the Mineral Reserve estimate.
The supplied mine design data including the 2024 Mineral Reserves and the supplied as-built development and current (December 2025) mined stoping solids were reviewed and deemed suitable for the Mineral Reserve estimate.
The QP considers the data suitable for the purposes of preparing the mine design, mine schedule, and Mineral Reserves estimate.
| 9.3 | Geotechnical data verification |
WSP was not able to review a copy of the current HGM GCMP but has reviewed the supplied geotechnical Code of Practice (BEMS-TS-RM-COP-01.pdf), and all supplied data and the QP believes the data is adequate for the purposes for which it is used for in this TRS.
Please note: WSP was previously, in 2024, provided with the HGM geotechnical database (BMC_Geotechnical Database.xlsx) which contained Rock Mass Rating (RMR) data for a total of 648 drill holes, and scans of HGM in-situ Geomechanics classification logging sheets for a total of 44 drill holes. WSP compared the database with the logging sheets and found that a total of 33 drill holes and RMR data matched between the datasets. The remaining 11 drill holes presented in the logging sheet scans could not be identified. No additional work has been undertaken by WSP regarding this during the compilation of the TRS.
| 9.4 | Hydrology and hydrogeology data verification |
HGM commissioned a Hydrogeological assessment in 2024 following a period of drought. The operation requires 55,000m3 of water per month for ore processing. Typically, the water is sourced from surface water dams. The report identified 18 feasible drill sites to source water across site. The drilling program was later completed, providing sufficient water supplementation to get through the 2024 drought. The water level of the How Dam is at 100% at the time of this report being published, and the Chimedza dam is at 25% capacity.
The HGM is located in Matabeleland South Province, Esigodini in the Upper Mzingwane sub-catchment of the Mzingwane Catchment. Figure 9.1 shows the various Zimbabwe catchments, and Figure 9.2 shows the sub-catchments of the Mzingwane Catchment (BMC 2023a).
| Project No PS229049 | WSP |
| How Mine | March 2026 |
| S-K 1300 Technical Report Summary | Page 44 |
| Namib Minerals |

Figure 9.1 Catchment boundaries of Zimbabwe (BMC Limited)
| Project No PS229049 | WSP |
| How Mine | March 2026 |
| S-K 1300 Technical Report Summary | Page 45 |
| Namib Minerals |
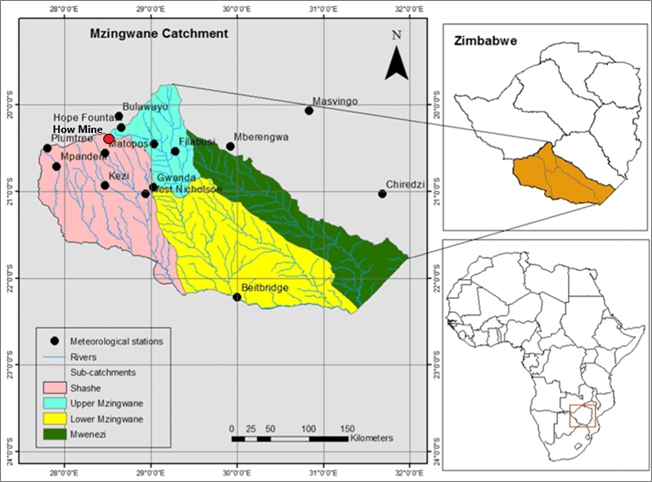
Figure 9.2 Sub-catchment boundaries of Mzingwane, Zimbabwe (BMC Limited)
| 9.4.1 | Hydrology |
Esigodini is a hydrological sub-zone BIK in the Upper Mzingwane sub-catchment of the Mzingwane Catchment. The hydrological sub-zone BIK has a Mean Annual Run-off (MAR) of 49 mm, and a Coefficient of Variation (CV) of 150%. This means that there is a high probability of having low run-off that is experienced from year to year. The Inyankuni River is the major river in the area and drains into the Mzingwane River in Mbalabala. The Inyankuni Dam (on the Inyankuni River) has a capacity of approximately 80,000 megalitres (Ml). Esigodini experiences annual rainfall of 618 mm, which is characterised by intra-season dry spells. Maximum temperatures average 27°C, and annual evaporation is 1,836 mm. There is also a local dam that supplies the mine with water. The local dam is on the Ngwabalozi River. The river is not perennial (BMC 2023a).
| 9.4.2 | Hydrogeology |
Younger intrusive granites characterise Esigodini. These granites possess low average transmitting properties, and secondary permeability. Groundwater occurrence is determined by the development of secondary structures such as faults, and weathering and shearing. Unprotected groundwater sources are vulnerable to contamination from run-off from areas where fertilisers, pesticides, herbicides, fuels, and chemicals have been applied, and those built downstream of sanitation facilities are at most risk of contamination (BMC 2023a).
| — | General groundwater potential: low to moderate. |
| — | Abstraction facilities: boreholes, and deep and shallow wells. |
| — | General water strike range: 15 to 60 m. |
| — | Borehole depth: 40 to 70 m. |
| Project No PS229049 | WSP |
| How Mine | March 2026 |
| S-K 1300 Technical Report Summary | Page 46 |
| Namib Minerals |
| — | Deep well depth: 10 to 20 m. |
| — | Shallow well depth: <10 m along river channels and low lying areas. |
| — | Water level range: 5 to 30 m. |
| — | General average yield: 0.02–2.0 litres per second (l/s). |
| — | General water quality: Good for human consumption, crops, and livestock consumption. |
| — | In the opinion of the QP, the data used to inform the groundwater models is of adequate quality. |
| — | In the opinion of the QP, this data is adequate for use in the mine design and mine schedules, and for the purposes for which it is used in this TRS. |
| 9.5 | Processing and recovery methods data verification |
The QP has validated HGM metallurgical processing by way of documentation provided, which includes metallurgical reports and performance, technical reports and business improvement projects. Further details regarding the HGM processing plant and flowsheet are presented in Section 14.
In the opinion of the QP, the processing and recovery methods data used to inform the Mineral Reserves estimate are adequate for the purposes for which it is used for this TRS.
| Project No PS229049 | WSP |
| How Mine | March 2026 |
| S-K 1300 Technical Report Summary | Page 47 |
| Namib Minerals |
| 10 | Mineral processing and metallurgical |
| 10.1 | Nature and extent of mineral processing and metallurgical testing |
The metallurgical plant encompasses a wide range of activities for extracting the gold from the ore. Ore consists of mainly sulphides, carbonates and silicates. Gold occurs at sulphide grain boundaries and in fractures within sulphides. Free gold is also found in chert bands. Pyrite, accounting for 90% of total sulphides, is fine grained and is associated with high ore grades. The plant design is appropriate for free-milling gold ore, that is, no pre-treatment refractory processing (e.g., roasting or re oxidation) is currently installed. Extraction is via gravity concentration and conventional cyanidation & adsorption.
| 10.1.1 | Nature of Mineral Processing Operations |
Comminution – designed to reduce particle size and liberate gold
| — | Crushing (Primary and secondary stages) |
| — | Milling (Primary and secondary milling circuits) |
| — | Cyclone classification (Target grind: typically, 75 µm P80) |
Gravity Recovery - designed to recover free-milling gold prior to cyanidation
| — | Knelson concentrators (KC48, KC30 x 2 and KC20) |
| — | Intensive leach reactor (Acacia) |
Cyanidation and Adsorption
| — | Carbon-in-Pulp (CIP) circuit with 14 operational tanks |
| — | Cyanide leaching at controlled pH (>10.5) |
| — | Activated carbon adsorption |
| — | Elution and electrowinning |
Tailings Handling
| — | Detoxification of cyanide using ferrous sulphate |
| — | Tailings disposal to TSF (Dam 5) |
| 10.1.2 | Extent of Metallurgical Testing |
Operational Test Work
Current metallurgical testing includes:
| — | Daily head and tail grade determination |
| — | Daily bottle roll tests |
| — | Daily grinds tests |
| — | Weekly carbon activity tests |
| Project No PS229049 | WSP |
| How Mine | March 2026 |
| S-K 1300 Technical Report Summary | Page 48 |
| Namib Minerals |
Historical Test Work
Metallurgical test work conducted included:
| — | Gold deportment studies Bottle roll cyanidation tests and Gravity recoverable tests) |
| — | Bond work index determination |
| — | Mineralogical analysis |
| 10.2 | Spatial representativity of metallurgical sampling |
The Mine has implemented documented sampling procedures, mechanical sampling systems and statistical quality control measures to ensure spatial representativity of metallurgical samples designed to minimise sampling bias and account for ore heterogeneity and nugget effect.
Plant feed sampling is conducted using a time-based, automatic, cross-belt, mechanical sampler that cut the full stream of the ore on the conveyor belt. For slurry streams, samples are collected manually using a specially designed sample cutter to collect full cross-sectional cuts.
To maintain spatial representativity during preparation, a riffle sample divider is used instead of the manual coning and quartering.
To address the nugget effect given the presence of coarse gold in the ore, especially before gravity concentration, a large sample mass is taken and sample mass reduction is done and, in the process, duplicate samples are taken.
Periodic inter-lab comparisons are done to check variability.
| 10.3 | Details of analytical or testing laboratories |
Commercial laboratories
| — | Performance Laboratories (Ruwa, Harare) |
| — | Antech Laboratories (Kwekwe) |
| — | Zimlabs (Harare) |
Mine Laboratories
| — | Turk Mine |
| — | Renco Mine |
| 10.4 | Predictions and assumptions in mineral processing |
There are no major changes in mineralogy with depth. Gold deportment remains consistent based on laboratory test works performed and historical plant performance data. Ore mineralogy and ore hardness remains consistent from between mining levels/sources.
The feed rate of ore and chemicals (lime, cyanide, peroxide) remains steady.
| Project No PS229049 | WSP |
| How Mine | March 2026 |
| S-K 1300 Technical Report Summary | Page 49 |
| Namib Minerals |
| 11 | Mineral Resource estimate |
| 11.1 | Resource database |
The HGM database was provided in the form of four separate csv files; collar, survey, assay and lithology. No geological database has been installed on site, instead the data is housed in excel files. Site geologists routinely perform data quality checks to ensure data collection quality is high.
WSP recommends Namib consider the implementation of a geological database to ensure minimal manual data entry is necessary and to improve the quality of data captured.
| 11.2 | Geological interpretation |
Consistent with previous Mineral Resource estimates, Namib supplied domain wireframes to WSP (Figure 11.1) which were created using grade-based cut-offs and sectional interpretations to create solids. These wireframes were all separate spatially and only created away from previous mining areas. Some of these wireframes at depth were created around single drillhole intercepts which WSP considers to be high risk.
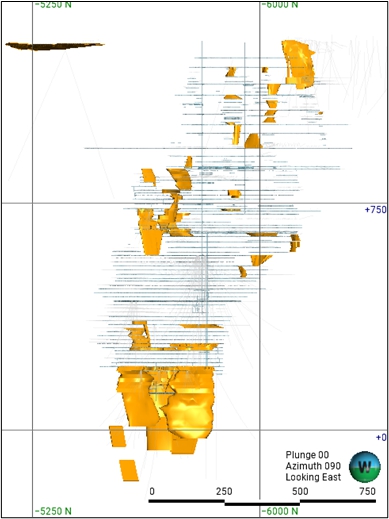
Figure 11.1 Long section view looking East showing existing development in grey and Namib’s planned MRE wireframes in orange.
| Project No PS229049 | WSP |
| How Mine | March 2026 |
| S-K 1300 Technical Report Summary | Page 50 |
| Namib Minerals |
WSP reviewed the provided wireframes and found considerable mineralisation exists in drilling in the hanging wall and footwall to the solids. With the gold price increasing dramatically since the previous MRE, a full mineralisation re-interpretation was undertaken to ensure all potentially economic material is captured and modelled to enable further future mining studies if warranted.
| 11.2.1 | Mineralisation Modelling |
The mineralisation at How is associated with sulphide mineralisation with pyrite being the dominant sulphide. Gold mineralisation occurs in fractures within the sulphide or on sulphide grain surfaces. Mineralisation is associated with hydrothermal solutions migrating along structures and appears to occur across different lithologies, including various tuff units, black shale and chert. Due to the absence of core photography and limited underground mapping available, mineralisation modelling has relied on gold grade entirely and checked against level plan mapping where available.
| 11.2.1.1 | Low Grade Domain |
Gold assays underwent statistical and spatial assessment using histograms, log probability plots and visual observation of trends to determine nominal cut-off grades to model a low-grade halo with internal high-grade domains. Statistical analysis of internal waste lengths was used to choose an appropriate amount of internal waste to include. 4.5 m of internal waste was incorporated into the low-grade mineralisation wireframes which showed visual continuity of mineralisation without the need to create a large number of internal waste domains.
A low-grade cut-off of 0.36g/t Au with up to 4.5m of internal waste was selected for the low-grade mineralisation wireframes (Figure 11.2)
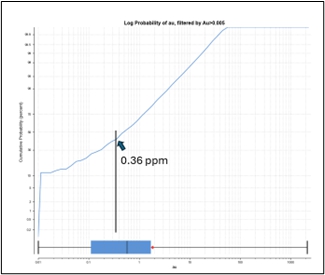 | 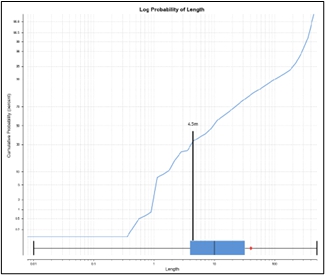 |
Figure 11.2 (left) log probability plot of Au assays at How, (right) log probability plot of waste interval lengths at How
The low-grade mineralisation wireframes were constructed in Leapfrog Geo using intrusion modelling on a section-by-section basis using the interval selection tool to manually select grade composite intervals to define the wireframes. This process is shown in Figure 11.3 where the pink intervals represent material above 0.36g/t Au containing less than 4.5m of internal waste and the blue intervals which do not meet the selection criteria.
| Project No PS229049 | WSP |
| How Mine | March 2026 |
| S-K 1300 Technical Report Summary | Page 51 |
| Namib Minerals |
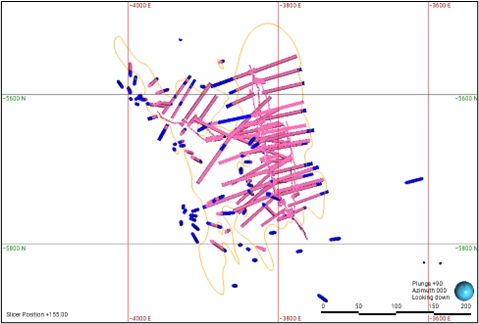
Figure 11.3 Plan view +/- 13m at 155mRL showing the intervals selected in the low-grade wireframe in pink with external segments in blue. The resulting low-grade wireframes outline is in orange.
A north facing section view of the resulting low-grade wireframe is shown in Figure 11.4.
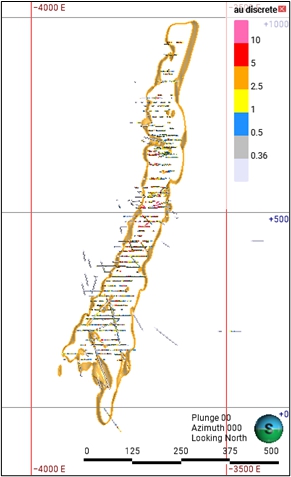
Figure 11.4 North facing section view +/- 13m at 5725mN
| Project No PS229049 | WSP |
| How Mine | March 2026 |
| S-K 1300 Technical Report Summary | Page 52 |
| Namib Minerals |
| 11.2.1.2 | Medium Grade Domain |
To review the requirement for further grade domaining, a log probability plot of Au assays within the low-grade domain was created. There was no distinct break in grade population so a 1g/t cut-off was applied with an internal waste length of 1.8 m included in the domain. Similar to the low-grade domain, an amount of internal waste was incorporated into the medium grade domains to ensure reliable connections can be made between drillholes.
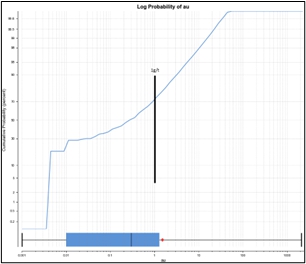 | 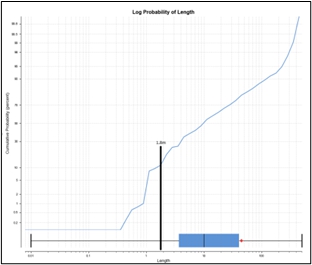 |
Figure 11.5 (Left) Log probability plot of Au assays within the low-grade wireframe at How. (Right) Log probability plot of waste interval lengths within the low-grade wireframe at How.
The medium grade domains were also created in Leapfrog using refined intrusion models, restricting the medium grade domains within the low-grade ones. To help guide the orientation of the domains, a structural trend was created for three separate areas of the mine and used to define anisotropy of the domain.
| Project No PS229049 | WSP |
| How Mine | March 2026 |
| S-K 1300 Technical Report Summary | Page 53 |
| Namib Minerals |
A plan view showing the red medium grade domain inside the orange low grade domain is show in Figure 11.6 with the structural trend discs show in blue.
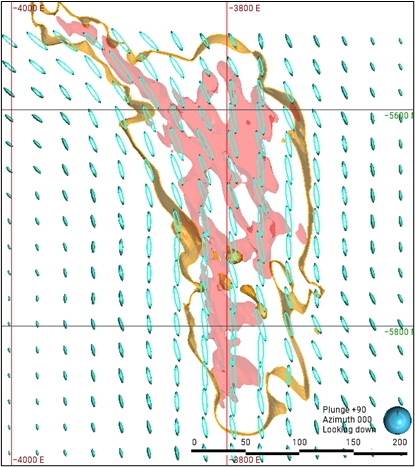
Figure 11.6 Plan view at 285mRL showing the medium grade domain (red) inside the low-grade domain (orange). Structural trend shown in blue.
| Project No PS229049 | WSP |
| How Mine | March 2026 |
| S-K 1300 Technical Report Summary | Page 54 |
| Namib Minerals |
| 11.2.1.3 | High Grade Domain |
A review of the grade distribution with the medium grade domain suggested multiple grade populations remain inside the domain. A high-grade domain was therefore delineated at a cut-off grade of 4g/t Au based on the histogram and log probability plots (Figure 11.7)
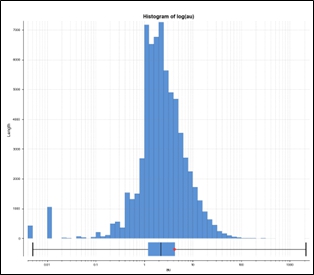 | 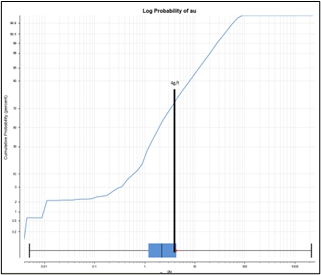 |
Figure 11.7 (Left) Histogram of Au grades within the medium grade domain at How. (Right) log probability plot of Au grades within the medium grade domain at How.
A numeric indicator model was created for this domain in Leapfrog, at a cut-off of 4g/t Au, using an iso value of 0.5. This created a high-grade wireframe internal to the previously created medium-grade wireframe and delineated the high-grade core of the mineralisation.
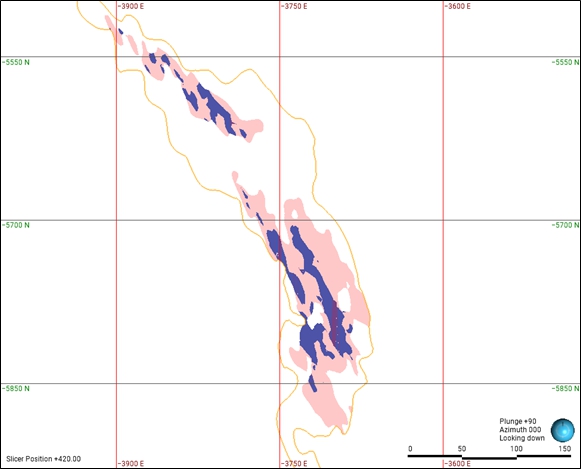
Figure 11.8 Plan view at 420mRL showing the Low-grade wireframe outline in orange with the Medium-grade wireframe in red and the internal High-grade wireframes in purple.
| Project No PS229049 | WSP |
| How Mine | March 2026 |
| S-K 1300 Technical Report Summary | Page 55 |
| Namib Minerals |
| 11.3 | Data preparation |
| — | To ensure the provided database is of sufficient quality to enable QP signoff of the MRE, a high-level data review was undertaken by WSP prior to commencing estimation of the MRE. The review concentrated on data from the 2025 drill program as these areas inform the majority of the forward mining plan. |
| — | Drilling data was provided to WSP as four separate csv files; BMC_dhcollars, BMC_survey, BMC_assay and BMC_geology with exported dates of 3rd January 2026 and is summarised in Table 11.1. |
| 11.3.1 | Hole Types |
Table 11-1 Summary of drill types included in the How database and used in the Mineral resource estimate
| Hole Type | Number of Holes | Total Length (m) | Average length of hole (m) |
| DD | 2,446 | 145,028 | 59.29 |
| Channel | 10,036 | 33,984 | 3.39 |
| Trench | 50 | 2,253 | 45 |
| Sludge | 4,846 | 47,246 | 9.75 |
| Total | 17,378 | 228,511 | 13.15 |
A review of the relationships between DD, Channel, Trench and Sludge drilling was undertaken to determine suitability of using each datatype in the estimate. While the mean grades in the Channel samples are higher than the diamond drilling, trench and sludge holes, this is thought to be due to the location of the sampling generally occurring in the centre of high-grade mineralisation. Due to the spatial locations of different drill type shown in Figure 11.9, all data has been used to define mineralisation, and in the estimate, as there are areas which are only informed by sludge drilling. Those parts of the deposit which are not informed by diamond drilling have had the classification downgraded to Inferred.
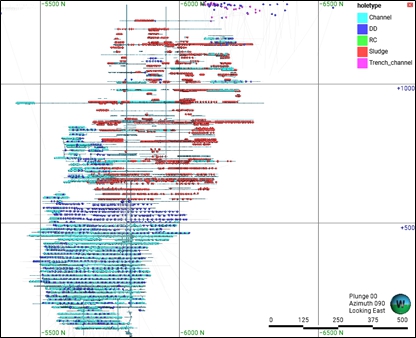
Figure 11.9 Long section view showing collar locations of different drill types
| Project No PS229049 | WSP |
| How Mine | March 2026 |
| S-K 1300 Technical Report Summary | Page 56 |
| Namib Minerals |
Due to the methodology for ore delineation diamond drilling which involves collaring in the development drive and drilling out horizontally from short stubs, the highest-grade core of the mineralisation is often not included in diamond drilling. For this reason, it was considered necessary to include trench and channel samples in the estimate to provide a more accurate representation of the high-grade core areas (Figure 11.10).
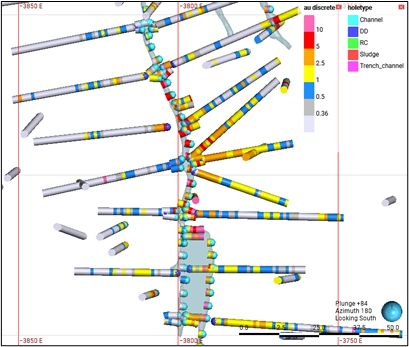
Figure 11.10 Plan view at 300mRL showing channel samples in the development drive (light blue collars) with diamond drilling (collars in dark blue)
| Project No PS229049 | WSP |
| How Mine | March 2026 |
| S-K 1300 Technical Report Summary | Page 57 |
| Namib Minerals |
| 11.3.2 | Collar Review |
A review of the collar location against provided development wireframes was undertaken, with some discrepancies found, particularly in the upper areas of the mine. Figure 11.11 shows that some areas of the mine have the drillholes plotting more than 3m away from the development. This is partly due to missing development pickups which have been requested for follow up by Namib (these were delivered on 10th Feb 2026). Other areas are due to incorrect assignment of Z co-ordinates of the drillholes. These areas of concern are largely in the mined areas of the mine and so not expected to have a material impact on the resource, particularly considering the horizontal nature of the majority of the drilling.
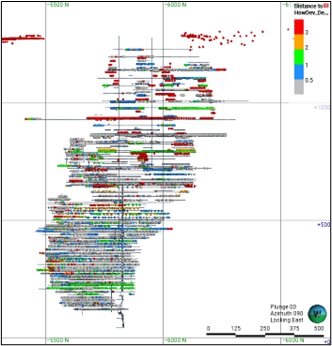
Figure 11.11 Long section looking East showing distance of the collar points to the development drive.
| Project No PS229049 | WSP |
| How Mine | March 2026 |
| S-K 1300 Technical Report Summary | Page 58 |
| Namib Minerals |
There were no excluded holes as all holes were included to inform the domaining and the estimate.
| 11.3.3 | Downhole Survey Review |
WSP reviewed downhole surveys for all of the diamond drill holes in the database with end of hole depths greater than 50m. In total, 715 diamond drill holes exist in the provided data with depths greater than 50 m, and 171 of these holes contain downhole surveys. A kink check of dogleg severity was undertaken on all holes and there are issues with many of the holes towards the bottom of the mine. Figure 11.12 shows any dogleg greater than 10 in red which suggests issues with the downhole surveys. This is potentially due to the presence of sulphides in the mineralised sections of the deposit or alternatively due to the presence of magnetite in some lithologies (potentially dolerite dykes). For the purpose of the estimate, the surveys were ignored in the drilling where the dogleg values suggest they are spurious. A complete list of ignored intervals is shown in Table 11.2.
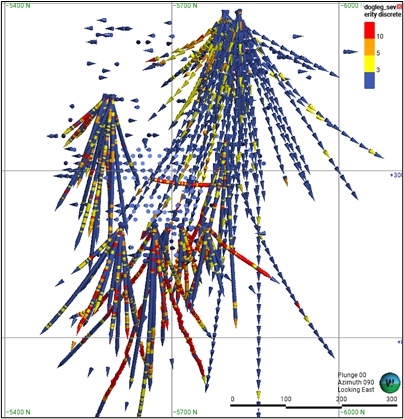
Figure 11.12 Long section view looking East showing dog-leg severity in diamond drill holes
Table 11-2 Survey intervals ignored due to spurious azimuth readings
| Hole ID | Ignored Intervals | Hole ID | Ignored Intervals |
| 26Lev_011 | 3-6; 60, 90, 99-105, 141-312 | 30L360N_011 | 153-159, 171-201, 207-210, 216-222, 228-243, 249-255 |
| 26Lev_012 | 29.71, 120.79, 170.03, 181.58, 207.44-210.31, 263.73, 272.04 | 30L360N_012 | 15, 27-39, 273-285, 306, 327 |
| 26Lev_013 | 2.93, 47-49.92, 70.29-73.19, 124.93 | 30L360N_013 | 0-6, 45-48, 63, 81, |
| 30L360N_006 | 0-6, 210-222, 276-279 | 30L360N_015 | 9-12, 39, 51, 63-69, 90, 126, 135, 144, 153, 177 |
| 30L360N_008 | 39-42, 105-129, 135-359 | 30L400N_003 | 33-36 |
| 30L400N_005 | 6 | 30L400N_006 | 0-6, 165 |
| 30L400N_007 | 6, 237-353.17 | 30L400N_009 | 9-21 |
| 30L400N_011 | 9 | 30L400N_012 | 0-3, 81 |
| 30L400N_013 | 120, 132, 159-165 | 30L400N_014 | 21, 114, 132, 192-195 |
| 30L400N_015 | 18, 39-42, 102, 132, 138-141, 162, 186-201 | 30L400N_016 | 51-54, 72, 117-120, 129-135, 153, 162, 177, 201-204 |
| 30Lev_037 | 0-9, 21, 96-111 | 30Lev_038 | 27 |
| 30Lev_039 | 0-12, 30, 45, 54-57, 63 | 30Lev_040 | 0-3 |
| 30Lev_041 | 15 | 30Lev_042 | 51 |
| Project No PS229049 | WSP |
| How Mine | March 2026 |
| S-K 1300 Technical Report Summary | Page 59 |
| Namib Minerals |
| Hole ID | Ignored Intervals | Hole ID | Ignored Intervals |
| 30Lev_043 | 15, 21-24 | 30Lev_048 | 57-172.5 |
| 30LPH1_001 | 60-72, 99-129, 171 | 30LPH1_002 | 27-33, 51-66, 111-154.92 |
| 30LPH1_003 | 6, 72-402.52 | 30LPH1_004 | 3, 78-252, 324 |
| 30L_027 | 30-126 | 30L_028 | 90-96, 105, 111-117, 126-132 |
| 30L_030 | 30-63, 72-84 | 30L_031 | 3, 42-51, 66-84 |
| 30L_033 | 6-21, 27-57, 63-123 | 30L_034 | 0, 69-135 |
WSP discussed these survey issues with personnel during the site visit and recommend considering an alternative survey method such as north seeking gyro which should negate errors due to magnetic interference.
| 11.3.4 | Assay Review |
A high-level review of the assay results was completed with no material issues identified.
Any missing intervals were assigned an assay code of -99 in the provided database. These were converted to half the detection limit (0.005 g/t Au) for the estimate as they were presumed not assayed due to the lack of presence of alteration/sulphides. Alternatively, some of these intercepts could be due to poor recovery in drilling however the core reviewed during the site visit did not show evidence of core loss.
| 11.3.5 | Compositing |
Analysis of the raw sample within the mineralisation domains at How indicated that the majority of the samples were collected at 1 m intervals (average length of 0.99 m) – see Figure 11.13. Due to the width of mineralisation extending up to 100m, the decision was made to composite drillholes to 2 m. Compositing to 2 m also allows the channel samples, which have an average length of 2 m, to be treated as a single composite.
| Project No PS229049 | WSP |
| How Mine | March 2026 |
| S-K 1300 Technical Report Summary | Page 60 |
| Namib Minerals |
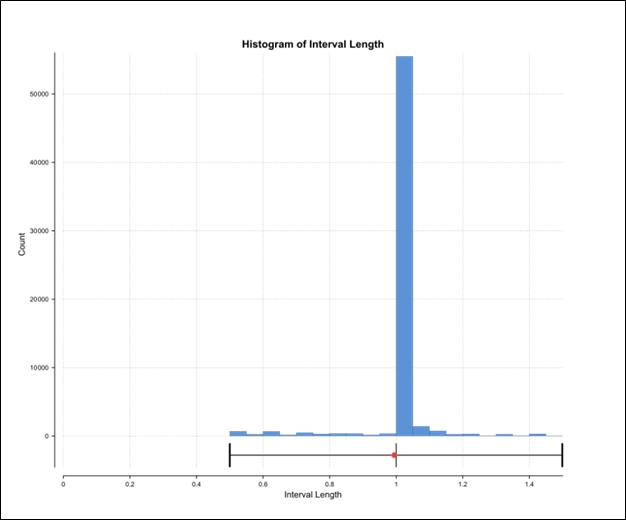
Figure 11.13 Histogram of raw assay length within mineralised domains
| 11.3.6 | Comparison Statistics |
A comparison between the raw and composite sample statistics for the estimation domains are provided below in Table 11.3.
Table 11-3 Comparison of raw and composited sample statistics (Au g/t)
| Domain | Number of Samples | Mean Grade (g/t) | Standard Deviation | ||||
| Raw | Composite | Raw | Composite | % Difference | Raw | Composite | |
| HG | 14,570 | 5,920 | 10.43 | 10.52 | -1% | 13.39 | 10.33 |
| MG | 62,447 | 29,180 | 2.87 | 2.87 | 0 | 10.40 | 7.61 |
| LG | 69,743 | 35,215 | 0.79 | 0.78 | 1% | 1.93 | 1.49 |
There are no significant changes to the mean grades across the domains through the compositing process.
| Project No PS229049 | WSP |
| How Mine | March 2026 |
| S-K 1300 Technical Report Summary | Page 61 |
| Namib Minerals |
| 11.4 | Exploratory data analysis |
| 11.4.1 | High-grade treatment |
Composites within each of the estimation domains have been analysed to ensure that the grade distributions are indicative of a single population, with no requirement for additional sub-domaining. The population analysis also identified any extreme values which could have an undue influence on the estimation of grade within the domains.
For all domains, log histograms and log-probability plots were used to identify the influence of extreme values and confirm the impact of applying a capping strategy to a population.
Au grade top cuts have been applied as tabulated in Table 11.4.
Table 11-4 Top cut statistics per domain for Au
| Domain | Top
cut Value |
Mean Grade | Co-efficient of Variation | Top
Cut percentile | ||
| Un-cut | Top Cut | Un-cut | Top Cut | |||
| HG | 65 | 10.41 | 10.26 | 0.99 | 0.86 | 99.6 |
| MG | 45 | 2.85 | 2.78 | 2.60 | 1.10 | 99.9 |
| LG | 20 | 0.78 | 0.78 | 1.92 | 1.64 | 99.9 |
The application of top cuts was required to reduce the impact of extreme values during the estimate. These high composites generally comprise of very high grades that do not demonstrate sufficient continuity to be domained separately.
| Project No PS229049 | WSP |
| How Mine | March 2026 |
| S-K 1300 Technical Report Summary | Page 62 |
| Namib Minerals |
| 11.5 | Variography |
Spatial variance analysis using variograms was conducted on the top cut and composited data for each estimation domain. Variogram orientations and rotations were checked against the mineralisation wireframe to ensure that they are geologically robust with respect to the strike and dip of each estimation domain.
Downhole and directional variograms for all domain are shown in Figure 11.14 to Figure 11.16 and a summary shown in Table 11.5.
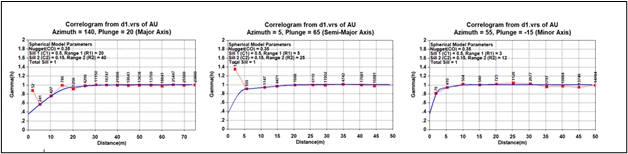
Figure 11.14 Correlograms for low-grade domain
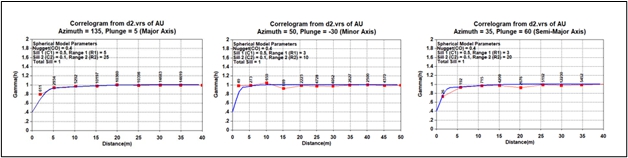
Figure 11.15 Correlograms for medium-grade domain
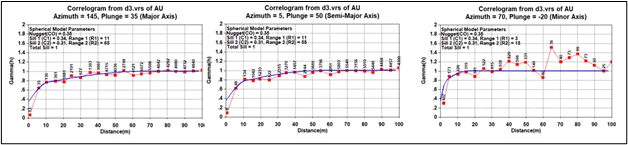
Figure 11.16 Correlograms for high-grade domain
Table 11-5 Summary of variogram parameters by domain
| Domain | Element | Leapfrog Rotations | Variographic parameters | ||||||||
| Dip | Dip Azi | Pitch | C0 | C1 | A1 | C2 | A2 | ||||
| LG | Au | 72 | 237 | 159 | 0.35 | Dir1 | 0.5 | 20 | Dir1 | 0.15 | 40 |
| Dir2 | 5 | Dir2 | 25 | ||||||||
| Dir3 | 3 | Dir3 | 12 | ||||||||
| MG | Au | 61 | 228 | 174 | 0.4 | Dir1 | 0.5 | 5 | Dir1 | 0.1 | 25 |
| Dir2 | 3 | Dir2 | 20 | ||||||||
| Dir3 | 3 | Dir3 | 10 | ||||||||
| HG | Au | 70 | 250 | 142 | 0.35 | Dir1 | 0.34 | 11 | Dir1 | 0.31 | 65 |
| Dir2 | 11 | Dir2 | 55 | ||||||||
| Dir3 | 3 | Dir3 | 15 | ||||||||
| Project No PS229049 | WSP |
| How Mine | March 2026 |
| S-K 1300 Technical Report Summary | Page 63 |
| Namib Minerals |
| 11.6 | Dry bulk density |
As discussed in Section 8.2, bulk density was assigned as a constant 2.8 g/cm3 across the entire deposit.
| 11.7 | Block models |
The block model was constructed according to the prototype parameters outlined in Table 11.6 and contains the variable as described in Table 11.7.
Table 11-6 How Block Model Parameters
| Co-ordinate | X | Y | Z |
| Minimum | -4100 | -6400 | -210 |
| Maximum | -3284 | -5392 | 1350 |
| Range (m) | 816 | 1008 | 1560 |
| Parent Cell | 8 | 8 | 8 |
| Smallest Sub-cell | 1 | 1 | 1 |
| Number of Parent Cells | 102 | 126 | 195 |
Table 11-7 Model Variables
| Variable | Description |
| Estimation Domain | LG, MG, HG |
| Au_OK | Au grade in g/t (Ordinary Kriged) |
| Density | Assigned 2.8 for all domains |
| RESCAT | Resource Classification - Measured, Indicated, Inferred |
| Mined | Mined Status - Developed, Stoped, Unmined |
| RPEEE | In_RPEEE |
The parent block sizes selected are approximately half the dominant drill hole spacing (diamond drilling) within the well-informed areas of the deposits. The blocks are sub-celled to 1 m to account for the variable thicknesses of the mineralised lodes and to accurately represent the wireframe volumes. Parent block estimation has been undertaken, therefore all sub-cells within a single parent block have the same estimated grade as the parent cell.
| Project No PS229049 | WSP |
| How Mine | March 2026 |
| S-K 1300 Technical Report Summary | Page 64 |
| Namib Minerals |
| 11.8 | Grade estimation |
The grade estimation of the mineralisation domains has been undertaken using Ordinary Kriging within each domain using hard boundary estimations. Grade estimation was completed in three passes. The search ellipse ranges applied have been based on the grade continuity and spatial variability (variography) within each domain. Dynamic anisotropy was used in each domain to adjust the search ellipse to the average orientation of the mineralisation. The first pass was estimated to the variogram range, while the second pass extends to twice the variogram range and the third to four times the variogram range (for the MG domain, the third pass was extended to five times the variogram range due to smaller ranges to ensure all blocks were estimated). Search parameters are summarised in Table 11.8.
Table 11-8 How Estimation Parameters - Au
| Domain | Pass | Search | # Samples | DH | |||
| Major | Semi-Major | Minor | Min | Max | Limit | ||
| HG | First | 32.5 | 22.5 | 7.5 | 6 | 24 | 4 |
| Second | 65 | 55 | 15 | 6 | 24 | 4 | |
| Third | 130 | 110 | 40 | 2 | 16 | ||
| MG | First | 40 | 25 | 12 | 6 | 24 | 4 |
| Second | 80 | 50 | 24 | 6 | 24 | 4 | |
| Third | 160 | 100 | 48 | 2 | 16 | ||
| LG | First | 25 | 20 | 10 | 6 | 24 | 4 |
| Second | 50 | 40 | 20 | 6 | 24 | 4 | |
| Third | 120 | 100 | 50 | 2 | 16 | ||
| 11.9 | Model validation |
Validation checks are undertaken at all stages of the modelling and estimation process. Final grade estimates and models have been validated using:
| — | Visual comparison of block grade estimates and the input drillhole data, |
| — | Global comparison of the average composite and estimated block grades, |
| — | Moving window averages (swaths) comparing the mean block grades to the composites. |
| Project No PS229049 | WSP |
| How Mine | March 2026 |
| S-K 1300 Technical Report Summary | Page 65 |
| Namib Minerals |
| 11.9.1 | Visual Validation |
Visual comparison of composite sample grades and block grades has been conducted in cross-section and in plan. Visually, the block model reflects the input composite grades, as shown in the cross section in Figure 11.17.
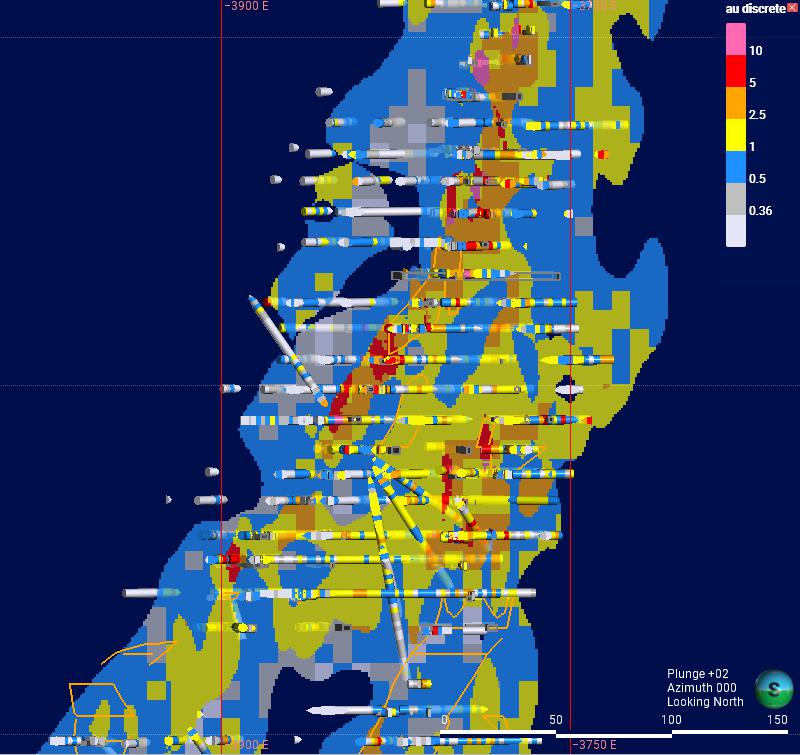
Figure 11.17 Cross section at -5625mN +/- 15m showing the block model and composites both coloured by Au
| 11.9.2 | Global Comparisons |
The final grade estimates for each estimation domain have been validated statistically against the input drillhole composites. Due to the even distribution of drilling across the majority of the deposit, it was not considered necessary to apply declustering for validation purposes.
Table 11-9 Global grade validation for all domains
| Domain | Block Estimated Grade | No of composites | Composite Grade (cut) | % Diff Est Grade vs Composite |
| LG | 0.79 | 35463 | 0.78 | 2% |
| MG | 2.72 | 29391 | 2.78 | -2% |
| HG | 10.30 | 5922 | 10.27 | 0% |
| Project No PS229049 | WSP |
| How Mine | March 2026 |
| S-K 1300 Technical Report Summary | Page 66 |
| Namib Minerals |
| 11.9.3 | Swath Plots |
Sectional validation graphs have been created to assess the reproduction of local means and to validate the grade trends in the block model by Easting, Northing and RL. These graphs (Figure 11.18 to Figure 11.20) compare the mean of the estimated block grades to the mean of the input composite grades within block model slices. The swath plots indicate that there is good local reproduction of the input grades in all directions and the estimate is applying an acceptable level of smoothing.
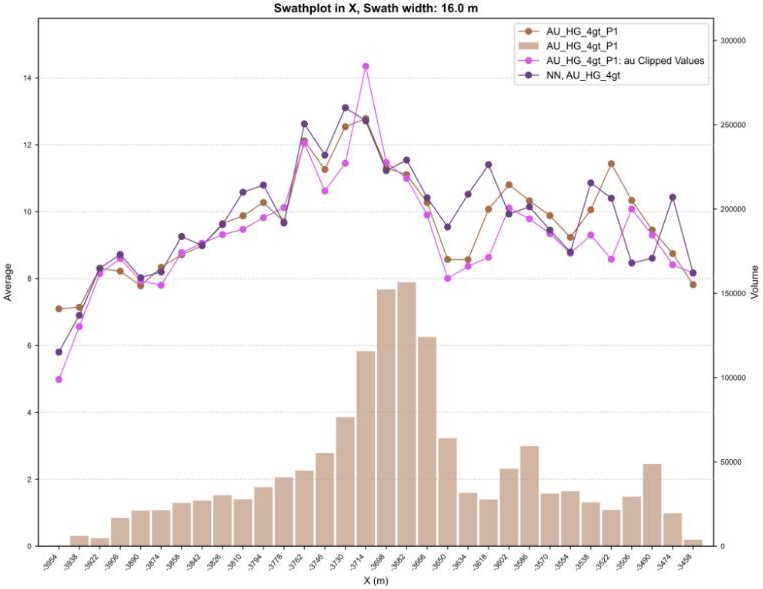 | 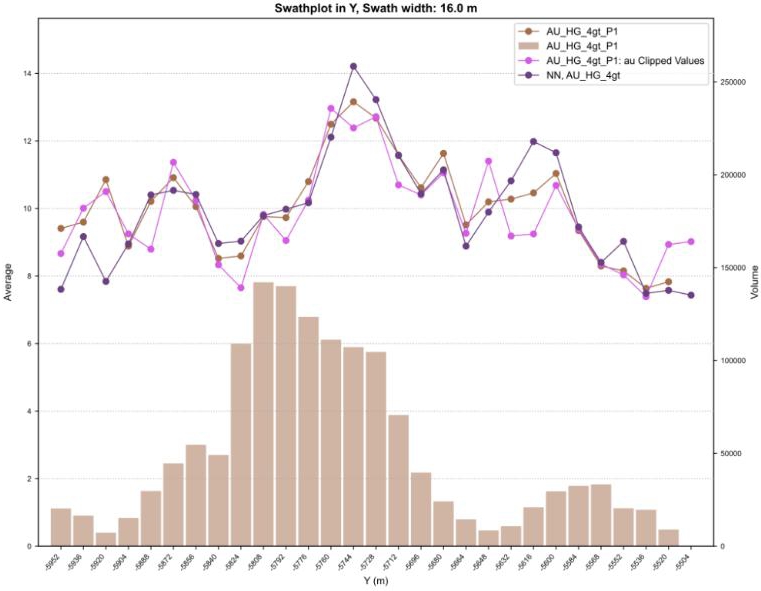 |
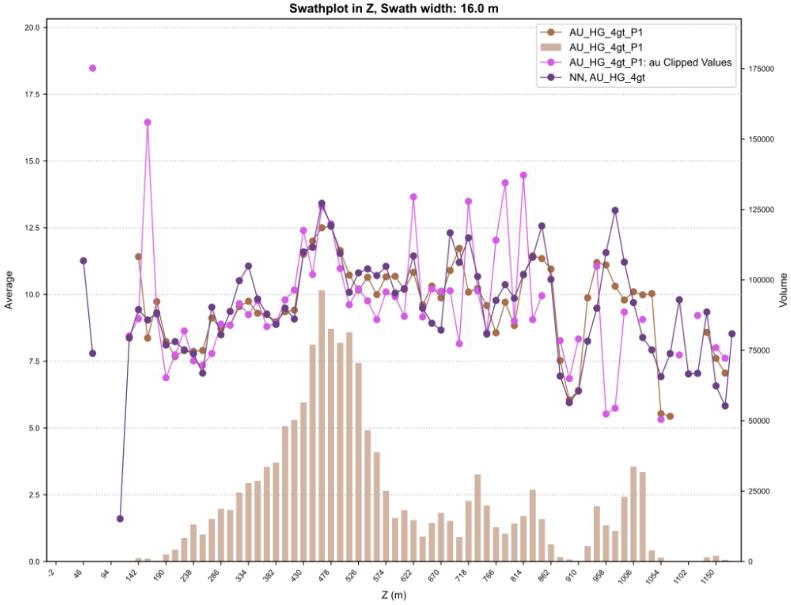
Figure 11.18 Swath Plot for HG mineralisation (Top left – X, Top right – Y, Bottom – Z)
| Project No PS229049 | WSP |
| How Mine | March 2026 |
| S-K 1300 Technical Report Summary | Page 67 |
| Namib Minerals |
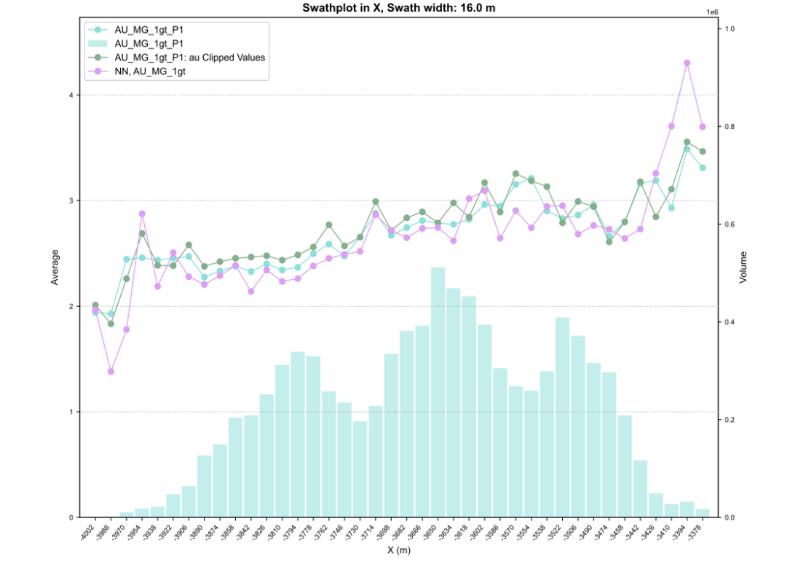 | 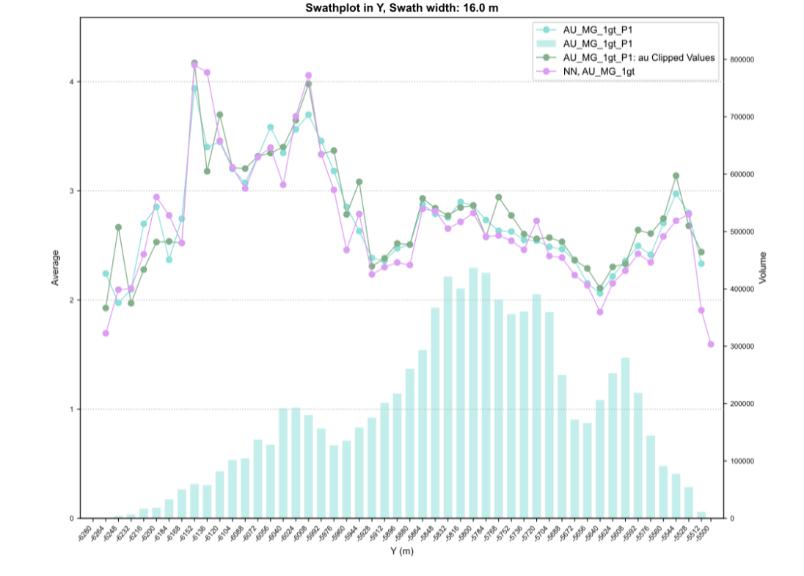 |
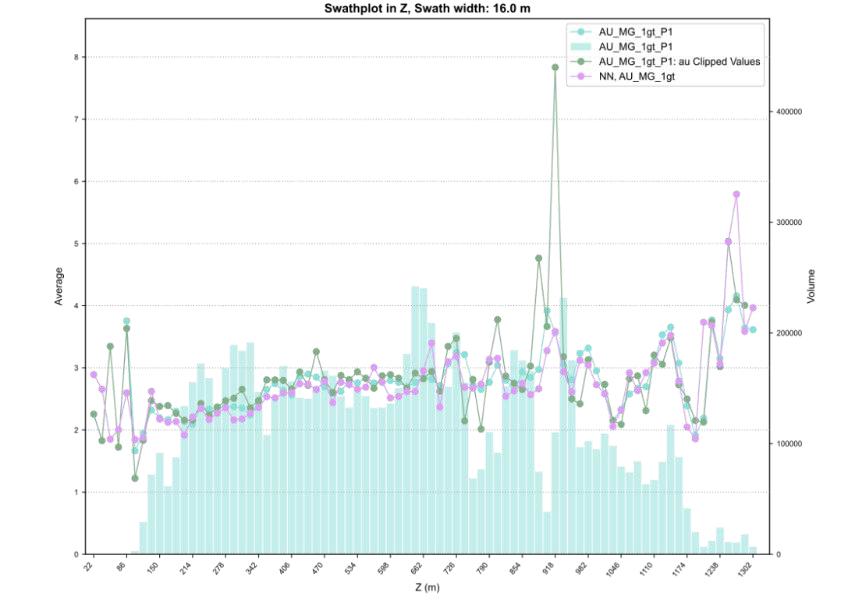
Figure 11.19 Swath Plot for MG mineralisation (Top left – X, Top right – Y, Bottom – Z)
| Project No PS229049 | WSP |
| How Mine | March 2026 |
| S-K 1300 Technical Report Summary | Page 68 |
| Namib Minerals |
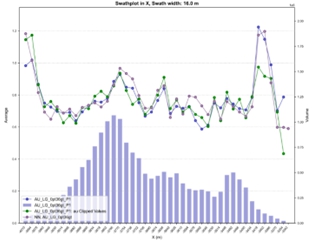 | 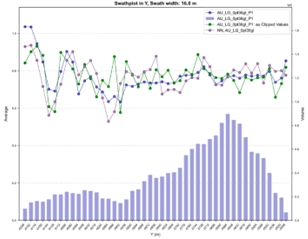 |
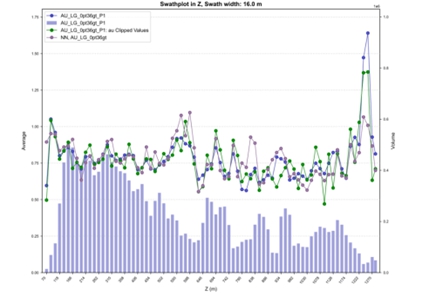
Figure 11.20 Swath Plot for LG mineralisation (Top left – X, Top right – Y, Bottom – Z)
| 11.9.4 | Tailings Dam Block Model Review |
In addition to the in-situ underground Mineral Resource estimate, Namib geologists completed an estimate of the historic Tailings Dam in 2023. These historic tailings dams were reviewed during the February 2026 site visit. WSP reviewed the estimation methodology and final estimate to enable QP sign-off of these resources. The following methodology is summarised from BMC (2021).
The historic tailings dams (Dam 3 and Dam 4) were drilled using manual augur drilling during 2021 at an approximate 15 m x 15 m spacing, resulting in 416 holes. Entire holes were sampled at 1 m spacing with depths ranging from 0.5 m to 18 m, averaging 5.07 m. Samples totalling 2-3 kg were collected and sent to the on-site laboratory for analyses by fire assay.
| Project No PS229049 | WSP |
| How Mine | March 2026 |
| S-K 1300 Technical Report Summary | Page 69 |
| Namib Minerals |
The mean grade of the 1999 samples was 0.93 g/t Au with a maximum grade of 4.99 g/t Au – no top-cutting was deemed necessary. A block model was created using a parent block size of 3.5 x 3.5 x 5m (xyz) with sub-blocking to 1m in all directions. Gold grade was estimated by Ordinary Kriging using a minimum of 2 and a maximum of 20 samples to inform each block using a flat ellipse to guide the estimate. A specific gravity of 1.6 t/m3 was applied to all blocks.
The QP agrees with the methodology used to estimate the tailings dams.
| 11.9.5 | Tailings Dam Block Model Validation |
WSP conducted a visual validation of the Dam3_4.bmf block model by comparing input composites with estimated values in the block model. Comparisons are presented in plan view, and in cross-sectional and long-sectional views for the variable Au for Dam 3 (Figure 11.21to Figure 11.24), and Dam 4 (Figure 11.25to Figure 11.28).
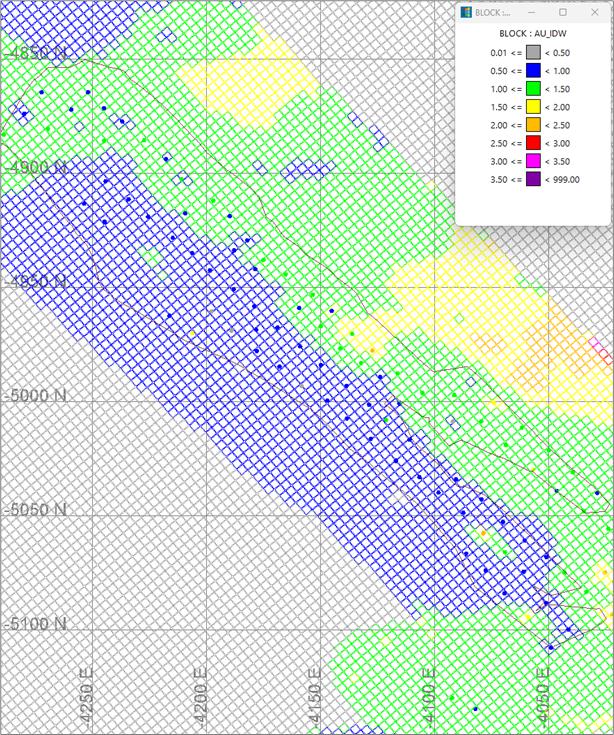
Figure 11.21 Plan view of the block model at Dam 3, showing estimated grades and composited data at the 1261 m levels (±1 m). Topography is shown in brown.
| Project No PS229049 | WSP |
| How Mine | March 2026 |
| S-K 1300 Technical Report Summary | Page 70 |
| Namib Minerals |
| Figure 11.22 | NE–SW cross-section (±5 m) looking northwest at Dam 3, comparing Au composite grades with the block model Au_IDW grades. Topography is shown in brown. |
| Figure 11.23 | NE–SW cross-section (±5 m) looking northwest at Dam 3, comparing Au composite grades with the block model Au_IDW grades. Topography is shown in brown. |
| Project No PS229049 | WSP |
| How Mine | March 2026 |
| S-K 1300 Technical Report Summary | Page 71 |
| Namib Minerals |
| Figure 11.24 | NW–SE long-section (±5 m) looking northeast at Dam 3, comparing Au composite grades with the block model Au_IDW grades. Topography is shown in brown. |
| Figure 11.25 | Plan view of the block model at Dam 4, showing estimated grades and composited data at the 1,271 m levels (±1 m). Topography is shown in brown. |
| Project No PS229049 | WSP |
| How Mine | March 2026 |
| S-K 1300 Technical Report Summary | Page 72 |
| Namib Minerals |
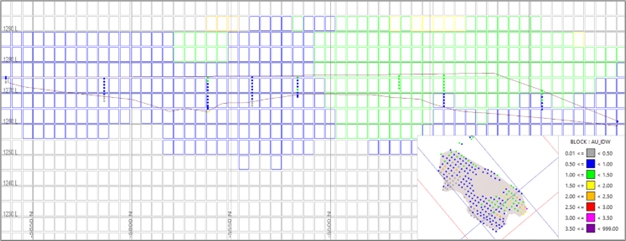
| Figure 11.26 | NE–SW cross-section (±5 m) looking northwest at Dam 4, comparing Au composite grades with the block model Au_IDW grades. Topography is shown in brown. |
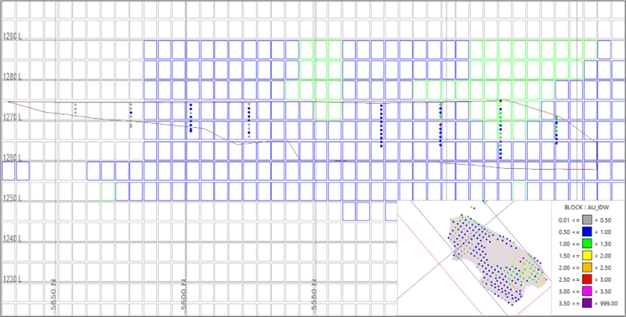
| Figure 11.27 | NE–SW cross-section (±5 m) looking northwest at Dam 4, comparing Au composite grades with the block model Au_IDW grades. Topography is shown in brown. |
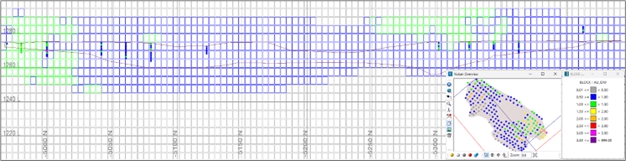
| Figure 11.28 | NW–SE long-section (±5 m) looking northeast at Dam 4, comparing Au composite grades with the block model Au_IDW grades. Topography is shown in brown. |
| Project No PS229049 | WSP |
| How Mine | March 2026 |
| S-K 1300 Technical Report Summary | Page 73 |
| Namib Minerals |
Overall, visual evaluation of grade distribution indicates a reasonable alignment between block model estimates and sample grades.
A statistical comparison between the input samples and the model estimated blocks within each dam wireframe is presented in Table 11.10.
Table 11-10 Comparison between the input samples and the model estimated blocks within each dam wireframe
| Dam | Field | Composites | Block Estimates | Mean Difference (%)* | ||||||||
| Num Rec | Min | Max | Mean | CV | Num Rec | Min | Max | Mean | CV | |||
| D3 | Au g/t | 595 | 0.31 | 3.37 | 1.12 | 0.37 | 5,871 | 0.45 | 3.07 | 1.09 | 0.27 | -2.15 |
| D4 | Au g/t | 1,528 | 0.02 | 4.99 | 0.85 | 0.50 | 13,239 | 0.20 | 2.16 | 0.82 | 0.32 | -3.06 |
Conformance of the model and sample average grades was evaluated in Easting, Northing and RL directions for dam 3 and 4 (Figure 11.29 and Figure 11.30).
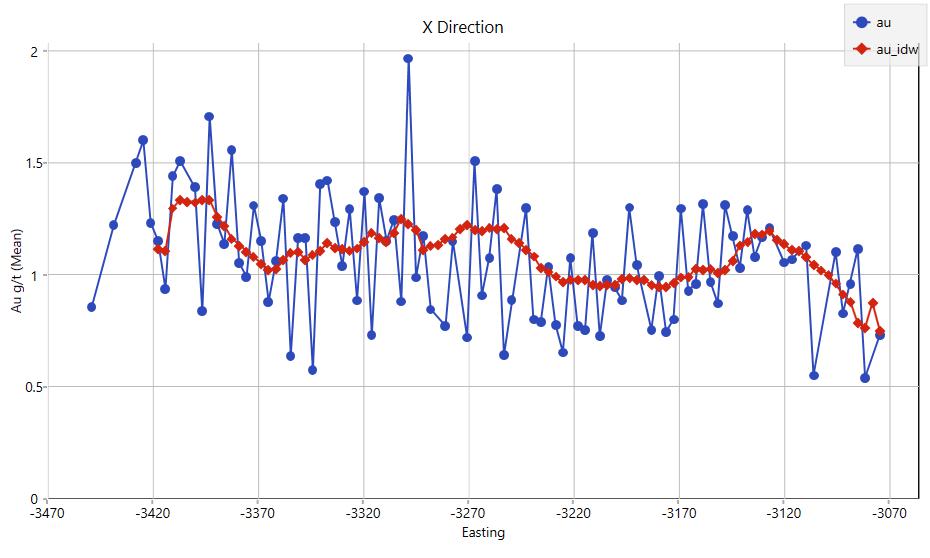 | 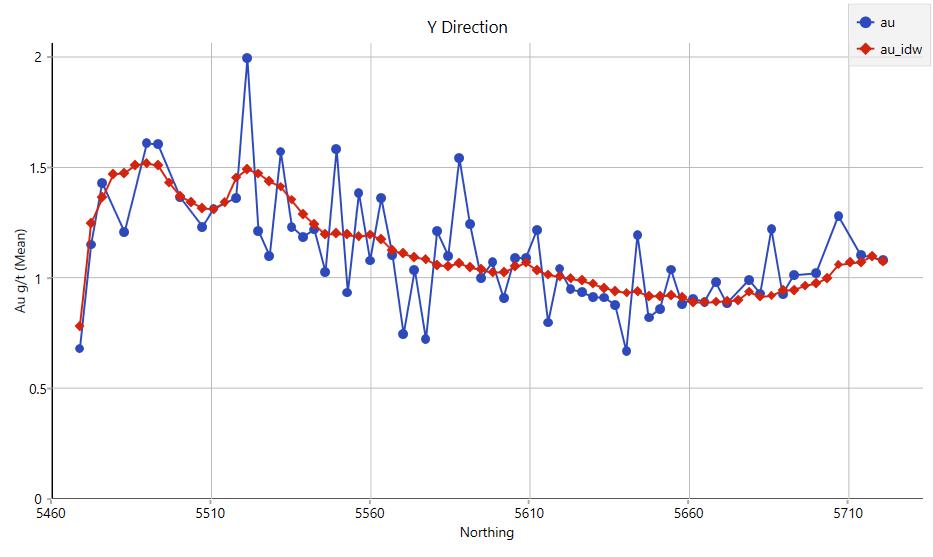 |
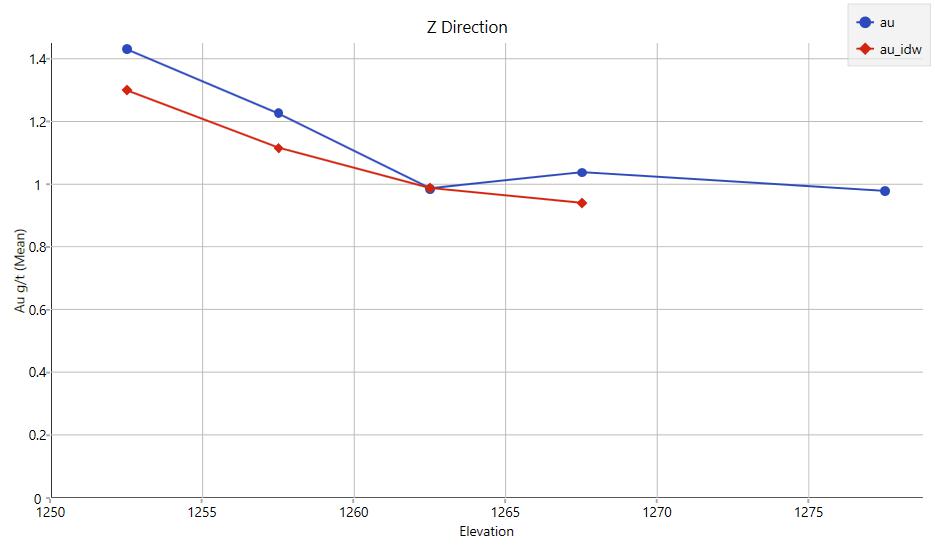 |
| Figure 11.29 | Swath Plot for Dam 3 (Top left – X, Top right – Y, Bottom – Z) |
| Project No PS229049 | WSP |
| How Mine | March 2026 |
| S-K 1300 Technical Report Summary | Page 74 |
| Namib Minerals |
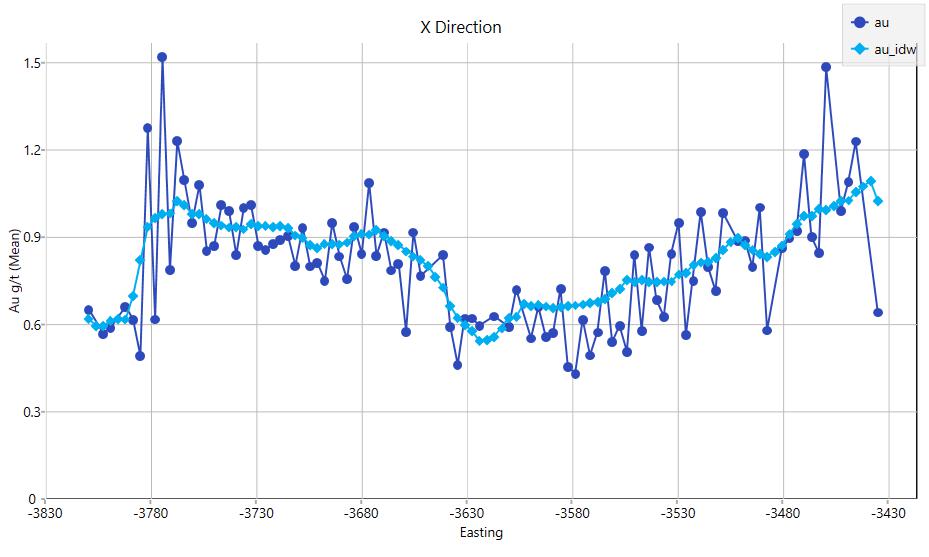 | 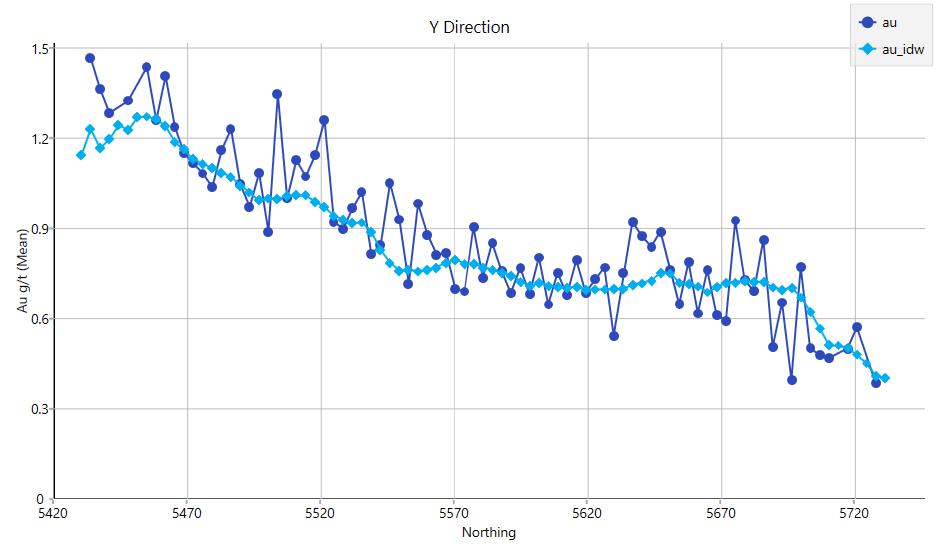 |
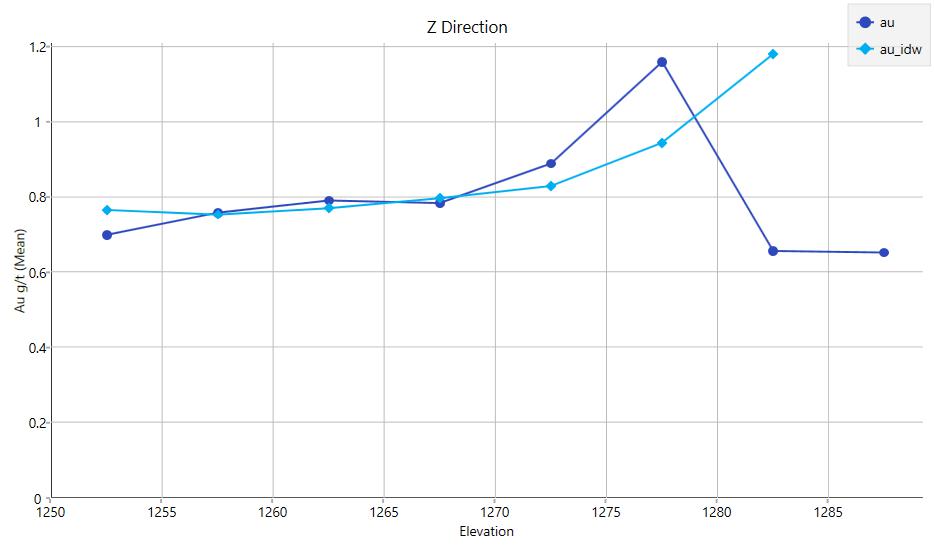 |
| Figure 11.30 | Swath Plot for Dam 4 (Top left – X, Top right – Y, Bottom – Z) |
Swath plots show a good local conformance between block estimates and sample data. The results indicate a reasonable correlation between average sample grades and estimated block values, with minor local deviations in the Z direction and slight smoothing of extreme-grade values.
Block model tonnes and grade were verified by WSP using Vulcan’s “Advanced Grade/Tonne Report” which showed an alignment between the reported tonnes and grade with the models provided to WSP.
Based on the comparison with the officially reported Mineral Resources for the Dam area, WSP found no issues in the estimation and reporting of the Dam3_4.bmf block model.
| 11.10 | Mineral Resources classification |
Classification of the Mineral Resource has been considered based on the following definitions from the SEC S-K 1300.
Measured Mineral Resource – highest confidence category which requires conclusive geological evidence to test and confirm geological and grade continuity. A Measured Mineral Resource is suitable for converting into a Proven Mineral Reserve if other modifying factors are met.
Indicated Mineral Resource – has a lower confidence level than measured but still strong enough for mine planning. Must be supported by adequate geological evidence to establish geological and grade continuity with reasonable certainty
Indicated Mineral Resources may be converted to Probable Mineral Reserves.
Inferred Mineral Resource – is based on limited geological evidence and sampling. Geological evidence is sufficient to imply (but not confirm) continuity and cannot be used for reserve estimation.
At How, WSP applied resource classification based on the following criteria:
| — | Distance to diamond drill holes |
| — | Confidence in geological interpretation |
| — | Data quality |
| Project No PS229049 | WSP |
| How Mine | March 2026 |
| S-K 1300 Technical Report Summary | Page 75 |
| Namib Minerals |
All areas of mineralisation which displayed strong geological continuity and understanding and are informed by diamond drill spacing better than 15 x 15m are considered to have sufficient confidence in the grade continuity between intercepts to apply Measured Resource classification.
All areas of mineralisation which displayed good geological continuity and understanding and are informed by diamond drill spacing better than 25 x 25m are considered to have sufficient confidence in the grade continuity between intercepts to apply Indicated Resource classification.
All areas of mineralisation which displayed reasonable geological continuity and understanding and are informed by diamond drill spacing greater than 25 x 25m, or areas which are informed by sludge and channel sampling only are considered to have sufficient confidence in the grade continuity between intercepts to apply Inferred Resource classification.
Classification wireframes were delineated in plan sections and applied to the model to ensure a smoothed classification across the deposit. The current classification status reflects the level of understanding of geological continuity and mineralisation at this stage of the project and is considered an appropriate classification. A long section view of classification is shown in Figure 11.31.
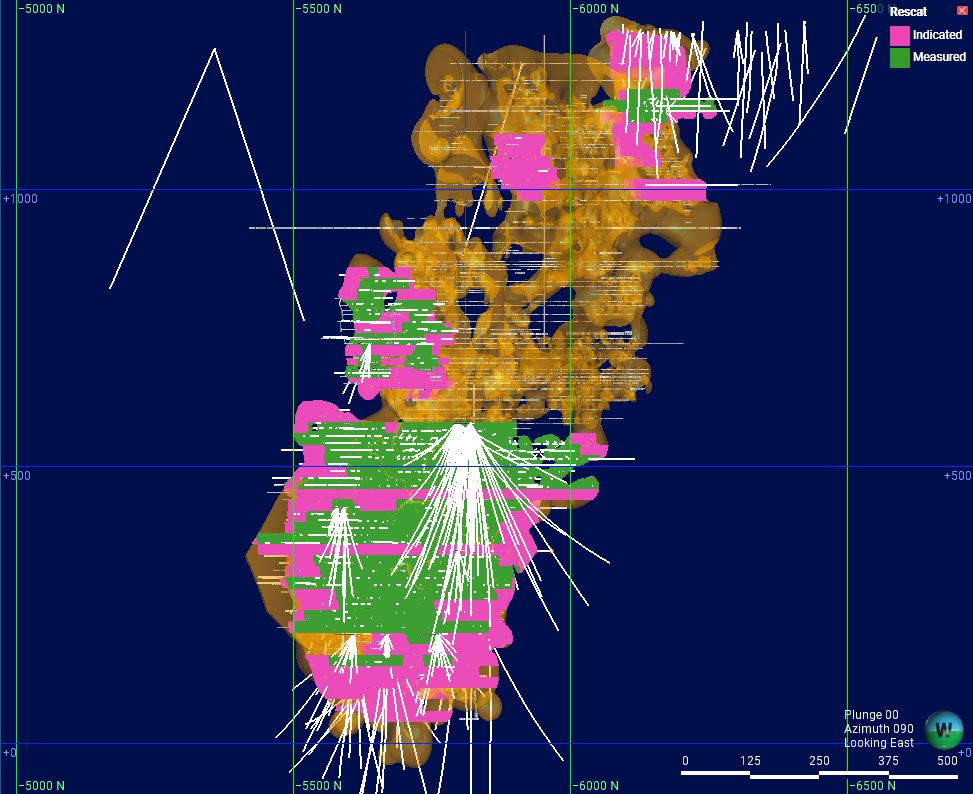
| Figure 11.31 | Long section view looking East showing Measured (green) and Indicated (pink) blocks and diamond drill hole traces in white. Material outside of these areas but within the orange estimation domain are classified Inferred. |
| Project No PS229049 | WSP |
| How Mine | March 2026 |
| S-K 1300 Technical Report Summary | Page 76 |
| Namib Minerals |
| 11.11 | Cut-off grade, price, and justification |
WSP initially calculated the break-even cut-off (BECOG) and the marginal cut-off (MCOG) values based on a Mineral Reserve gold price of US$3,272 per ounce. This was based on average of the trailing 2-year average gold price (CY2024 and CY2025) and the forecast 2026 gold price.
WSP was provided the latest pay limit (and cut-off) worksheet from December 2025. WSP reviewed the input costs data against the latest HGM supplied cost estimates and updated the gold prices to obtain the BECOG of 0.96 g/t gold (0.75 g/t pay limit) shown below in Table 11.11 and the MCOG of 0.6 g/t gold (0.35 g/t pay limit) shown below in Table 11.12.
For the Mineral Resource cut-off specific estimates WSP included a premium of 10% resulting in a gold price of US$3,600 per ounce.
The MCOG, the basis for the Mineral Resource, was then recalculated utilising the adjusted gold price of $US3,600.
Please note that as silver is not included in the block model, and contributes very minor revenues to the mine overall, WSP chose to remove silver revenue from both the COG calculations and the economic analysis.
The adjusted MCOG for both the underground and tailings is shown in Table 11.12.
Table 11-11 BECOG Calculation
| MINING BECOG Calculation | |
| Cost/Tonne Milled (cost of production) | 79.18 |
| Gold Price (US$ per oz) | 3,272 |
| Required Recovery (Pay Limit) g/t | 0.75 |
| Residue (0.23g/t) | 0.23 |
| APF (102.1%) | 1.02 |
| Final BECOG (g/t) | 0.96 |
Table 11-12 MCOG Calculation
| MINING MCOG Calculation | |
| Cost/Tonne Milled ($ per ton) | 36.86 |
| Gold Price (US$ per oz) | 3,272 |
| Pay Limit (g/t) | 0.35 |
| Residue | 0.23 |
| Final Paylimit (g/t) | 0.60 |
| Project No PS229049 | WSP |
| How Mine | March 2026 |
| S-K 1300 Technical Report Summary | Page 77 |
| Namib Minerals |
Table 11-13 December 2025 Mineral Resource conversion parameters
| Parameter | Mineral Resources (ROM) | Tailings (Sands) |
| MCOG (g/t) | 0.55 | 0.64 |
| Plant Residue Value (g/t) | 0.23 | 0.46 |
| Direct Operating Cost (C1) (US$ per ton) | 36.86 | 20.54 |
| Specific Gravity (tons per cubic metre) | 2.80 | 1.60 |
| Gold Price +10% (US$ per oz) | 3,600 | 3,600 |
| Silver Price | NA | NA |
| Silver Price +10% | NA | NA |
Notes: Applied COGs are based on a marginal cost analysis assuming direct operating costs only. No Silver credits are applied.
| 11.12 | Reasonable prospects for eventual economic extraction |
Stope optimisation was conducted using Datamine’s Mineable Shape Optimiser (MSO) software to determine the extent of the Mineral Resource with ‘reasonable prospects for economic extraction (RPEE)’ by underground mining methods. It should be noted that the optimisation results were used exclusively to assess the reasonable prospects of eventual economic extraction by underground mining methods and do not represent an attempt to estimate mineral reserves.
Model blocks contained within the conceptual MSO shapes shown in Figure 11.32 are considered to meet reasonable prospects for eventual economic extraction. Using the stope optimisation parameters listed in Table 11.14, a break-even cutoff grade of 0.6g/t Au was calculated. The preliminary MSO shapes were reviewed for the ability to be safely extracted including the proximity to blasted ground, proximity to existing rib and sill pillars and their proximity to mined voids. Any preliminary MSO shapes that could not be expected to be reasonably extracted safely were considered sterilised and removed from the final Mineral Resource inventory.
| Project No PS229049 | WSP |
| How Mine | March 2026 |
| S-K 1300 Technical Report Summary | Page 78 |
| Namib Minerals |
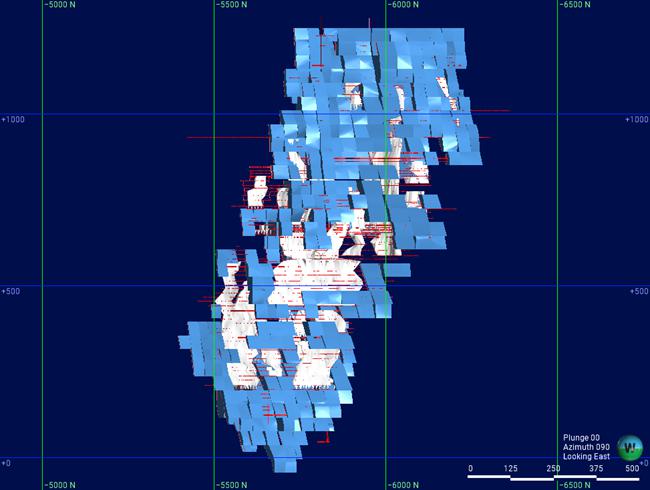
Figure 11.32 Long section view looking East showing RPEEE stopes in blue with existing stopped out areas in white
Table 11-14 Stope optimisation parameters for How Mineral Resource
| Parameter | Assumptions used in the Optimisation |
| Gold Price (USD/oz) | $3,600 |
| Total Production Cost (USD/t) | $79.18 |
| Metallurgical Recovery (%) | 89% |
| TCRC of Au (USD/oz) | $0.03 |
| Payability (%) | 84.5% |
| Royalties (%) | 5% |
| Cut-off Grade | 0.6 g/t (rounded up) |
| Minimum Mining Width | 3.5m |
| Project No PS229049 | WSP |
| How Mine | March 2026 |
| S-K 1300 Technical Report Summary | Page 79 |
| Namib Minerals |
| 11.13 | Mineral Resources statement |
The Mineral Resource for the How Gold Project as of the 31st December 2025 is provided in Table 11.15.
To determine the quantities of material offering reasonable prospects of eventual economic extraction by an underground mining method, WSP established a reasonable cut-off grade using a gold price of USD$3,600/oz and an overall metallurgical recovery of 89%.
The mineral resource is reported within Mineable Stope Optimiser shapes generated at a cut-off grade 0.6 g/t Au and is inclusive of material below 0.6 g/t Au within these shapes.
Table 11-15 How Gold Project, Mineral Resource Estimate, exclusive of Mineral Reserves – 31 December 2025
| Classification | Tonnes (Mt) | Grade (g/t) | Ounces (koz) |
| Measured | 13.7 | 1.32 | 583 |
| Indicated | 10.2 | 1.41 | 463 |
| (M+I) | 23.9 | 1.36 | 1,046 |
| Inferred | 31.0 | 2.18 | 2,176 |
| — | Mineral Resources are not Mineral Reserves and have no demonstrated economic viability |
| — | The Mineral Resource estimate was prepared by Kate Kitchen, MAIG of WSP who is a Qualified Person as defined by S-K 1300. |
| — | Totals may not add up due to rounding |
| — | Resources are reported within Mineable Stope Optimiser shapes generated at a cut-off grade of 0.6 g/t Au and is inclusive of material below 0.6 g/t Au within those shapes. |
The basis of the Property’s Mineral Resources estimate and how it is generated are summarised below. The Mineral Resources estimate for the Property is reported herein in accordance with the requirements detailed in S-K 1300. For estimating the Mineral Resources, the following definition of Mineral Resource as set forth in S-K 1300 is applied:
“Mineral resource is a concentration or occurrence of material of economic interest in or on the Earth’s crust in such form, grade or quality, and quantity that there are reasonable prospects for economic extraction. A mineral resource is a reasonable estimate of mineralisation, taking into account relevant factors such as cut-off grade, likely mining dimensions, location or continuity, that, with the assumed and justifiable technical and economic conditions, is likely to, in whole or in part, become economically extractable. It is not merely an inventory of all mineralisation drilled or sampled.”
The Mineral Resources estimate (exclusive of Mineral Reserves) for the Property is presented in Table 11.16, Table 11.17, and Table 11.18. Mineral Resources are reported on an in-situ basis with an effective date of 31 December 2025.
Table 11.16 presents the underground Measured and Indicated Mineral Resources (exclusive of Mineral Reserves) reported as at 31 December 2025.
Table 11-16 HGM underground Measured and Indicated Mineral Resources estimate as at 31 December 2025
| Category | Tonnage (Mt) | Au Grade (g/t) | Au Metal (koz) |
| Underground | |||
| Measured Resources | 13.7 | 1.32 | 583 |
| Indicated Resources | 10.2 | 1.41 | 463 |
| Grand Total | 23.9 | 1.36 | 1,046 |
Notes: Mt = Million tonnes; Au Grade g/t = gold grams per tonne; koz = thousand ounces.
Table 11.17 presents the underground Inferred Mineral Resources (exclusive of Mineral Reserves) reported as at 31 December 2025.
| Project No PS229049 | WSP |
| How Mine | March 2026 |
| S-K 1300 Technical Report Summary | Page 80 |
| Namib Minerals |
Table 11-17 HGM underground Inferred Mineral Resources estimate as at 31 December 2023
| Category | Tonnage (Mt) | Au Grade (g/t) | Au Metal (koz) |
| Underground | |||
| Inferred Resources | 31.0 | 2.18 | 2,176 |
| Grand Total | 31.0 | 2.18 | 2,176 |
Notes: Mt = Million tonnes; Au Grade g/t = gold grams per tonne; koz = thousand ounces.
Table 11.18 presents the sands (tailings) Inferred Mineral Resources (exclusive of Mineral Reserves) reported as at 31 December 2025.
Table 11-18 HGM sands (tailings) Inferred Mineral Resources estimate as at 31 December 2025
| Category | Tonnage (Mt) | Au Grade (g/t) | Au Metal (koz) |
| Sands (Tailings) | |||
| Inferred Resources | 12.0 | 0.59 | 220 |
| Grand Total | 12.0 | 0.59 | 220 |
Notes: Mt = Million tonnes; Au Grade g/t = gold grams per tonne; koz = thousand ounces.
The Mineral Resources presented in this Section are not Mineral Reserves, and do not reflect demonstrated economic viability. The reported Inferred Mineral Resources are considered too speculative geologically to have the economic considerations applied to them that would enable them to be categorised as Mineral Reserves. There is no certainty that all or any part of this Mineral Resource will be converted into Mineral Reserve.
All figures are rounded to reflect the relative accuracy of the estimates and totals may not add correctly.
Based on the geological results presented in this TRS, it is the QP’s opinion that the Mineral Resources have RPEE.
| 11.14 | Uncertainty in the estimates of Inferred, Indicated, and Measured Mineral Resources |
The QP is satisfied that the stated Mineral Resources classification reflects the appropriate level of confidence and considers all factors relevant to the deposit. The application of resource categories appropriately considers the relevant factors used in the classification process.
Some examples of specific factors that can influence the risk and uncertainty of the Mineral Resources estimates that are considered in the resource classification include:
| — | Interpretation of the mineralisation boundary. |
| — | Drill hole spacing and adequacy in defining geology, mineralisation, structure, and grade. |
| — | Quality of samples, assays, and geological information. |
| — | The Mineral Resource has addressed RPEE, and considers mining, metallurgical, and environmental factors. |
The Mineral Resource estimate has been estimated to two decimal places for gold grade, and to the nearest tonne for tonnage, however has been reported to two decimal places for gold grade, to the nearest thousand ounce for metal content and to the nearest thousand tonne for tonnage when reported in summary tables in this report.
Mineral Resources confidence is also assessed via internal peer reviews conducted at key stages of the Mineral Resources estimation process.
| Project No PS229049 | WSP |
| How Mine | March 2026 |
| S-K 1300 Technical Report Summary | Page 81 |
| Namib Minerals |
The Mineral Resource presented is not a Mineral Reserve, and does not reflect demonstrated economic viability. The level of geological uncertainty associated with the reported Inferred Mineral Resources is considered too speculative to apply relevant economic, and technical factors to have the economic considerations applied that would enable these to be categorised as Mineral Reserves. There is no certainty that all or any part of the Inferred Mineral Resources will be converted into Mineral Reserves. All figures are rounded to reflect the relative accuracy of the estimates and totals may not sum exactly as a consequence.
| 11.15 | QP’s opinion on factors likely to influence the prospect of economic extraction |
The main factors likely to influence the prospect of economic extraction include:
| — | Orebody definition. |
| — | Assigned dry Bulk Density. |
| — | Commodity pricing. |
| — | Interpretations of additional fault geometries, particularly deeper in the mine where less drilling currently exists. |
The estimates of Mineral Resources may be materially affected by environmental, permitting, legal, title, socio-political, marketing, or other relevant issues including risks set forth in this TRS.
In the QP’s opinion, all of these factors are adequately considered for the Mineral Resource reported. Based on the body of technical studies completed across the Property, it is the QP’s opinion that the Mineral Resource has RPEE.
In the QP’s opinion, all issues relating to all relevant technical and economic factors likely to influence the prospects for economic extraction, can be resolved with the recommendations for further work outlined in Section 23.1.
| Project No PS229049 | WSP |
| How Mine | March 2026 |
| S-K 1300 Technical Report Summary | Page 82 |
| Namib Minerals |
| 12 | Mineral Reserve Estimate |
| 12.1 | Key inputs, assumptions, parameters, and methods |
How Gold Mine (HGM) supplied the following electronic data:
| — | Previous (CY2024) Mineral Reserve stope solids. |
| — | Previous (CY2024) Mineral Resource stope solids. |
| — | As-built development solids as at December 2025. |
| — | Void solids for stoping depletion purposes as at December 2025. |
| — | Additional stoping solids showing stoping inclusions since the last MRE in CY2024. |
| — | The current life of mine plan mining schedule, in Microsoft Excel, as at September CY2025. |
| — | The cut-off grade (and pay calculator) worksheet that allows calculation of the break even and marginal cut off grades, updated for CY2025. |
| — | The current CY2026 life of mine plan dynamic financial model. |
In addition to the WSP generated block model this data pack contains all required inputs for the updated CY2025 Mineral Reserve estimate.
To begin WSP reviewed the macroeconomic inputs used for the previous MRE (CY2024), and the current HGM budget forecast, and assessed the values against forecast metal price data from S&P Global.
Based on this work WSP considers a gold price of US$3,272.00 to be appropriate for the CY2025 MRE, based on the averaged gold price from CY2024, CY2025, and the forecast CY2026 gold price.
In continuance of previous practice WSP considers that a 10% premium on this price, totally US$3600 per ounce to be appropriate for the Mineral Resource estimate.
Key assumptions for Mineral Reserve estimation are provided in Table 12.1.
Table 12-1 Estimation parameters
| Parameter | US$/t | Comments |
| Total production costs | 79.18 | Supplied by site and reviewed by WSP. Used for the COG calculations. Please note that the economic analysis utilises discrete calculated monthly production costs. Inclusive of sustaining and indirect costs. |
| Total variable costs | 36.86 | Supplied by site and reviewed by WSP. Utilised for marginal cut-off calculations. Inclusive of sustaining costs. |
| Total fixed costs | 42.32 | Supplied by site and reviewed by WSP. Inclusive of indirect costs. |
| Gold Price | US$3,272/oz | WSP considers a gold price of US$3,272.00 to be appropriate for the CY2025 MRE, based on the averaged gold price from CY2024, CY2025, and the forecast CY2026 gold price. |
| Silver Price | NA | WSP has chosen not to include silver revenue due to the lack of visibility in the block model and the minor role the previous silver estimates contributed to the economic analysis. |
| Project No PS229049 | WSP |
| How Mine | March 2026 |
| S-K 1300 Technical Report Summary | Page 83 |
| Namib Minerals |
| 12.2 | Cut-off grade estimate |
WSP initially calculated the break-even cut-off (BECOG) and the marginal cut-off (MCOG) values based on a Mineral Reserve gold price of US$3,272 per ounce. This was based on average of the trailing 2-year average gold price (CY2024 and CY2025) and the forecast 2026 gold price.
WSP was provided the latest pay limit (and cut-off) worksheet from December 2025. WSP reviewed the input costs data against the latest HGM supplied cost estimates and updated the gold prices to obtain the BECOG of 0.96 g/t gold (0.75 g/t pay limit) shown below in Table 12.2 and the MCOG of 0.6 g/t gold (0.35 g/t pay limit) shown below in Table 12.3.
The MCOG, the basis for the Mineral Resource, was then recalculated utilising the adjusted gold price of $US3,600.
Please note that as silver is not included in the block model, and contributes very minor revenues to the mine overall, WSP chose to remove silver revenue from both the COG calculations and the economic analysis.
Table 12-2 BECOG Calculation
| MINING BECOG Calculation | |
| Cost/Tonne Milled (cost of production) | 79.18 |
| Gold Price (US$ per oz) | 3,272 |
| Required Recovery (Pay Limit) g/t | 0.75 |
| Residue (0.23g/t) | 0.23 |
| APF (102.1%) | 1.02 |
| Final BECOG (g/t) | 0.96 |
Table 12-3 MCOG Calculation
| MINING MCOG Calculation | |
| Cost/Tonne Milled ($ per ton) | 36.86 |
| Gold Price (US$ per oz) | 3,272 |
| Pay Limit (g/t) | 0.35 |
| Residue | 0.23 |
| Final Paylimit (g/t) | 0.60 |
| Project No PS229049 | WSP |
| How Mine | March 2026 |
| S-K 1300 Technical Report Summary | Page 84 |
| Namib Minerals |
Table 12.4 summarises the COG calculations and other key inputs.
Table 12-4 Additional key parameters
| Parameter | Mineral Reserves (ROM) |
Comment |
| Pay-Limit Grade (BECOG Au g/t) | 0.75 | Costs supplied and reviewed by WSP. Pricing represents the average 2-year trailing average and current CY2026 forecast price totalling US$3,272. |
| Cut-off Grade (BECOG Au g/t) | 0.96 | Costs supplied and reviewed by WSP. Pricing represents the average 2-year trailing average and current CY2026 forecast price totalling US$3,272. To calculate the COG from the pay limit the residue (0.23 g/t lost) and the APF is applied. |
| Pay-Limit Grade (MCOG Au g/t) | 0.35 | As for the BECOG pay limit however only the variable mining and processing costs are applied in addition to transport, sales and royalties. The same calculated US$3,272 gold price is applied. |
| Cut-off Grade (MCOG Au g/t) | 0.60 | As for the BECOG however only the 0.23 g/t residue is applied, not the APF. |
| Exchange Rate | 1:25.5 USD/ZiG | Revenue paid 70% USD and 30% ZiG local currency. Local inflation rate running at 4.1% (Jan 2026). |
| Tonnage for Pay-Limit (t) | 58,050 | Estimated throughput for fixed and variable cost components. |
| Dry In Situ Density (t/m3) | 2.8 | Average estimation to one decimal place. |
| Assay Plan Factor (APF) | 102.1% | 3-year trailing monthly average. No historical average MCF estimated for Sands treatment. |
| Block Factor (BF) | 98% | 3-year trailing monthly average. No historical average MCF estimated for Sands treatment. |
Notes: Metal content (oz) is in Troy ounce unit and the conversion is one troy ounce equal to 31.10348 g. Ore tonnages are reported on a dry basis. Recent inspection in February 2026 indicates that the mine is relatively dry. Density estimates are applied at one significant decimal place. WSP recommends estimating average densities either by interpolation within the resource model by lithology or by reconciliation to derive an average dry density estimate to two significant decimal places.
| 12.3 | Metallurgical and processing recoveries |
HGM advised that a metallurgical recovery of 89.0% is applicable based on historical and planned performance. WSP has used this figure as it correlates with the historical data provided, and is reasonable, however WSP has not conducted any metallurgical test work to verify the metallurgical estimate.
| 12.4 | Modifying factors |
The conventional methodology applied to estimate dilution and ore loss is as follows:
| — | The raw diluted tonnage and grade are reported within the stope and development wireframes from the Mineral Resource model. |
| — | Mineral Resource tonnage and grade by pay limit cut-off grade (0.6 g/t Au) are reported within the same designs, excluding dilution. |
| — | The Mineral Reserve Block Estimates are then calculated by assuming the same diluted tonnage and by multiplying the diluted Reserve Estimate grade by the APF (102.1%) and BF (98.0%), a combined factor (MCF) of 100.1%. |
| — | Final stope block grades are checked to ensure it exceeds the 0.96 g/t pay limit in order to qualify for inclusion as Mineral Reserves. Stopes below the BECOG of 0.96 g/t and above the MCOG of 0.6 /t are included where hoisting and/or milling capacity exists within the Mineral Reserve only life of mine duration. These stopes are also considered a Mineral Reserve where they do not extend the mine life and thus incur the fixed costs in addition to their variable cost. |
| Project No PS229049 | WSP |
| How Mine | March 2026 |
| S-K 1300 Technical Report Summary | Page 85 |
| Namib Minerals |
The calculation of the mine call tonnage-grade factors is described as follows:
| — | An Assay Plan Factor (APF) of 102.1% was estimated as an average over the last three years of operation (January 2023 – December 2025). This factor is the equivalent of a MCF, based on the gold content and not grade per se. It is defined as the relationship between gold accounted for (bullion plus residue at the plant) versus gold “called for” by the mine’s measurement and evaluation method. This factor is also incorporated into the pay limit calculation. It is calculated as follows: |
APF = Mineral
content accounted for from ore treated (recovery + residue) x 100%
Mineral content called for based on current sampling
| — | A Block Factor (BF) of 98.0% was estimated as an average over the last three years of operation (January 2023-December 2025, for monthly averages within +/- 10% range). It is defined as the ratio of the contained gold of the ore broken from a Mineral Reserve block as indicated by current sampling results versus the estimated Mineral Reserve block gold content. |
BF = Current
sampling contents x 100%
Estimated block contents
| — | An overall Block Call Factor (BCF) has been estimated as a multiple of the APF and BF where: |
BCF = Block Factor x Assay Plan Factor x 100%
| — | This gives rise to an overall call factor of 100.1% (98.0% x 102.1%) that was applied for estimation of the 31 December 2025 Mineral Reserve. |
Currently the modifying factors are calculated for the depleted material (MR + MII + pillars recovered), the break (broken ore in development and stoping), the mill feed (hoist plus stockpiles) and the reconciled mill production, whereby:
APF = Hoist
plus Stockpile Feed (recovery + residue) x 100%
Reconciled Mill Feed
BF = Break
x 100%
Depleted Inventory (MR + MII + pillars recovered)
Additionally, a practical stoping extraction recovery of 90% has been used for all stopes excepting any stopes adjoining a sill or significant void. These stopes have individually reduced recoveries (in the electronic mining schedule) ranging from 5% to 60%.
A practical 97% surface stockpile recovery figure has also been utilised for the Dam #3 and Dam #4 sands Mineral Reserve.
| 12.5 | Mineral Reserve classification |
| 12.5.1 | Proved Mineral Reserves |
A Proved Mineral Reserve block is derived from the Measured Mineral Resource with the application of cut-offs of 0.96 g/t Au and 0.6 g/t where applicable, and the applications of the relevant modifying factors.
Dilution is applied as a 0.5 m failure envelope on the hangingwall and footwall around Measured Mineral Resource, by means of an expanded stope wireframe.
Sill, crown, and cone pillar tonnages are removed by stope block but retained in the sub-category of Measured and Indicated Mineral Resources.
Rib pillar tonnages are removed from the stope block and not classified as Mineral Reserves, since there is no intention to recover these pillars.
| Project No PS229049 | WSP |
| How Mine | March 2026 |
| S-K 1300 Technical Report Summary | Page 86 |
| Namib Minerals |
| 12.5.2 | Probable Mineral Reserves |
A Probable Mineral Reserve block is derived from the Indicated Mineral Resource with the application of cut-offs of 0.96 g/t Au and 0.6 g/t where applicable, and the applications of the relevant modifying factors.
Dilution is applied as a 0.5 m failure envelope on the hangingwall and footwall around Indicated Mineral Resource, by means of an expanded stope wireframe.
Sill, crown, and cone pillar tonnages are removed by stope block but retained in the sub-category of Measured and Indicated Mineral Resources.
Rib pillar tonnages are removed from the stope block and not classified as Mineral Reserves, since there is no intention to recover these pillars.
| 12.6 | Mineral Reserve estimate |
| 12.6.1 | Mineral Reserve statement |
The Mineral Reserves have been defined, classified and reported according to the guiding principles and minimum standards set out in S-K 1300.
The WSP QPs are satisfied that there has been sufficient standard of evaluation to support estimation of a Mineral Reserve that has been demonstrated to be technically and economically viable.
This is based on the extractable (90% recovered) portion adjusted for the average MCF applied to grade (100.1%), reflecting both plan dilution and positive reconciliation as a 3-year trailing average excluding outliers (+10%) as at end December 2025. Mineral Reserves are reported on a plant feed basis, inclusive of dilution and ore loss modifying factors, assuming a gold metallurgical recovery of 89.0%.
The Mineral Reserve estimate is based on Proved and Probable material only, delineated by Datamine’s MSO software, that has been deemed to be economically viable through industry accepted mine planning practices. The economic basis for the Mineral Reserve is based on detailed financial modelling of the Mineral Reserve only mine plan.
Please note that the HGM strategic LOM plan is a combination of the Mineral Reserve only mine plan with the addition of Inferred material that has been assessed to be safely and economically extractable within the parameters of the current mine design.
Further Inferred material may be able to be added to the HGM strategic LOM plan once a strategic LOM is completed. Please note that such a study is outside the purview of the requirements to generate this report.
| Project No PS229049 | WSP |
| How Mine | March 2026 |
| S-K 1300 Technical Report Summary | Page 87 |
| Namib Minerals |
Table 12.5 presents the HGM Mineral Reserves estimate as at 31 December 2025.
Table 12-5 Mineral Reserves estimate as at 31 December 2025
| Category | Tonnage (Mt) | Au Grade (g/t) | Au Metal (koz) | % Contribution |
| Underground | ||||
| Proved Reserve | 1.08 | 1.40 | 48 | 47% |
| Probable Reserve | 0.52 | 1.70 | 28 | 27% |
| Total Proved & Probable | 1.60 | 1.50 | 77 | 75% |
| Surface | ||||
| Probable Reserve | 0.89 | 0.89 | 26 | 25% |
| Grand Total | 2.49 | 1.29 | 103 | 100% |
Notes: UG = Underground, SF = Surface Stockpile Dam 3 and 4.
| 12.6.2 | Life of mine strategic plan |
The HGM strategic LOM plan includes the stated Mineral Reserves in addition to the Inferred material as noted below in Table 12-6.
Table 12-6 Inferred Mineral Resources included in the life of mine plan as at 31 December 2025
| Category | Tonnage (Mt) | Au Grade (g/t) | Au Metal (koz) |
| Underground | |||
| Inferred Resources | 4.03 | 1.59 | 206 |
| Grand Total | 4.03 | 1.59 | 206 |
The estimates are rounded to reflect the order of accuracy, to the nearest ten thousand tonnes (10 kt) for tonnage, to two decimal places for grade, and to the nearest thousand ounces (koz) for contained gold. Estimates are prepared carrying relevant decimal place accuracy to derive subtotals and totals that are subsequently rounded. Minor rounding errors may occur as a result.
| Project No PS229049 | WSP |
| How Mine | March 2026 |
| S-K 1300 Technical Report Summary | Page 88 |
| Namib Minerals |
| 12.7 | QP’s opinion on risk factors that may materially affect the Mineral Reserve estimates |
The main factors likely to materially affect the Mineral Reserve estimates include:
| — | Resource definition and variability. |
| — | Gold price and process recovery. |
| — | Unit operating costs. |
| — | Increased ground stress and mining induced stresses with depth with implications for recovery, ore loss and dilution. |
| — | Increased provision for dilution and ore loss as impacted by ground conditions, pillar requirements, mining accuracy and efficiency. |
| — | Increased mining and materials handling costs at depth due to conditions and increased rehandling through the internal shaft system. |
| — | Potentially increased risk to personnel and ground support requirements at depth. |
The estimates of Mineral Reserves may also be materially affected by environmental, permitting, legal, title, socio-political, marketing, or other relevant issues including risks set forth in this TRS.
In the QP’s opinion, all of these factors are adequately considered for the Mineral Reserves reported. Based on the body of technical studies completed across the Property, it is the QP’s opinion that the Mineral Reserves are both technically and economically viable.
| Project No PS229049 | WSP |
| How Mine | March 2026 |
| S-K 1300 Technical Report Summary | Page 89 |
| Namib Minerals |
| 13 | Mining methods |
| 13.1 | Introduction |
The HGM is an underground rail mine in active operation using sub-level open stoping underground techniques, generally as per Figure 13.1, with annual production rate for 2025 of 476 kt for 25,004 contained oz of gold. Two vertical shafts (North and Main Shaft) are used to access the relatively steeply dipping (80°) orebody on approximately 10 – 12m level intervals. The North Shaft hoists ore only (to a depth of 925 m), while the Main Shaft is dedicated to personnel and material movement. An additional internal shaft (16N7 Shaft) extends to 34L and currently supports operations to the 32L loading level.
Sublevels are developed on approximately 10–12 m intervals and mined on retreat by adopting underhand/long-hole open stoping methods using sub-level breaking into a common slot. Broken ore is collected in draw-points or boxes. Cone levels (extraction draw cones) are developed to 8 to 10 m above haulage drives, and sub-levels are developed above the cone drives at approximately 10–12 m intervals. Drilling and blasting are conducted by retreating from a central slot to rib pillars or other demarcated points by downhole (underhand) and uphole (overhand) drilling.
The current mining method has been utilised for many years and WSP has not considered any changes to the mining method for the MRE.
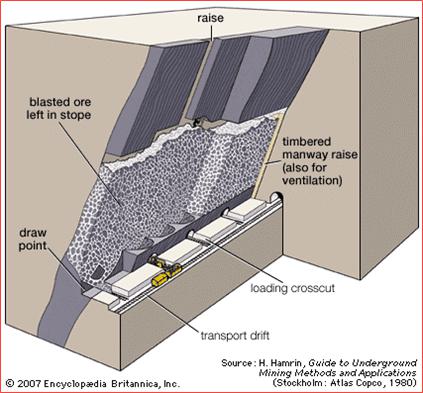
| Figure 13.1 | Figure showing general mining method (Mining – blasthole stoping, ore extraction, drilling | Britannica) |
| Project No PS229049 | WSP |
| How Mine | March 2026 |
| S-K 1300 Technical Report Summary | Page 90 |
| Namib Minerals |
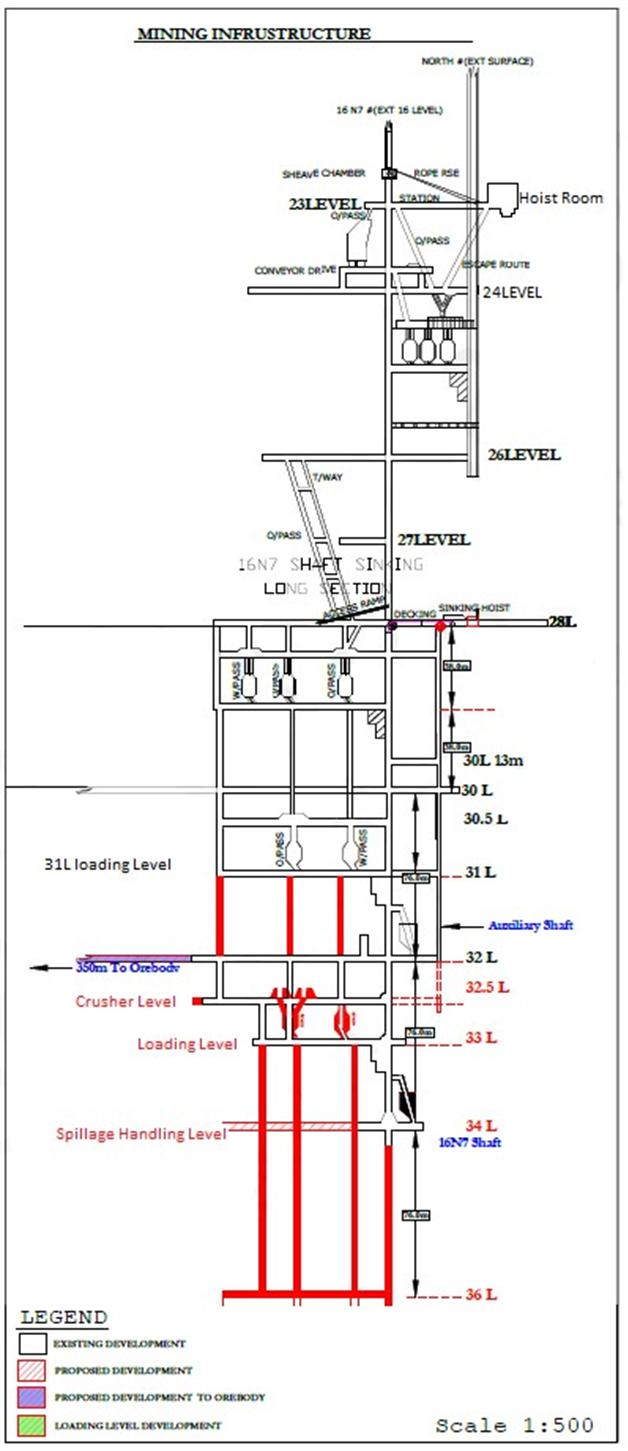
| Figure 13.2 | HGM underground mining infrastructure end 2025 |
| Project No PS229049 | WSP |
| How Mine | March 2026 |
| S-K 1300 Technical Report Summary | Page 91 |
| Namib Minerals |
Table 13-1 HGM shaft collars and depths
| Shaft | Collar (amsl) | Depth (metres below Surface) | Level | Description |
| North Shaft | 1286.7 | 940 | 26L | Main Rock Winder to surface |
| Main Shaft | 721.7 | 565 | 16L | Man riding shaft from surface |
| South Shaft (Raise bore) | 575.7 | 711 | 20L | Abandoned shaft from surface |
| 16N7 | 718.7 | 1244 | 34L | Sub-level shaft with both rock and man riding compartments |
| Auxiliary | 271.5 | 1168 | 34L | Sub-level shaft from 28L for shaft sinking |
| Winze 1 | 271.5 | 1168 | 34L | Sub-level winze from 30L.Used for blocking out to speed sub-level development |
| Winze 2 | 271.5 | 1168 | 34L | Sub-level winze from 30L.Used for blocking out to speed sub-level development |
| 13.2 | Parameters relevant to the design and schedule |
| 13.2.1 | Geotechnical |
The HGM Technical Services Department includes a Geotechnical Engineer that is responsible for geotechnical ground characterization; underground support design; mining layouts geotechnical optimization; geotechnical instrumentation; geotechnical monitoring and numerical modelling for ground stability. In addition to these responsibilities, the geotechnical engineer advises HGM management on ground control and support installation practices, including the ground control management plan (GCMP); ground support quality control; mining sequencing; blast design and blasting practices as they affect strata control. Previously, HGM management was guided by external geotechnical consultants for geotechnical services. The Geotechnical Engineer is still supported by geotechnical consultants however, this support is mainly in the form of auditing and as third-party participants. The most recent independent review of HGM was completed by Vaughan & Esterhuizen in (2024).
The 2024 independent review by Vaughan & Esterhuizen (2024) list several recommendations. While careful consideration should be given to the recommendations that would improve the health and safety of the workforce, for the purposes of this review only four are considered to have potential to materially affect the mining economics by either materially affecting the production schedule or increasing mining cost and HGM’s response is noted below:
| — | Water ingress: Water ingress into the shaft has been managed by proactively identifying sources of water and implementing controlled preventative flow measures to divert water away from the shafts. Surface drainage rehabilitation work has been completed, and weekly monitoring is being carried out. Support work is ongoing, and identified critical sections have since been fully supported using combination of both primary and secondary support elements. |
| — | Update rock properties data from deeper areas of the mine: The latest rock properties data was conducted in 2023. Efforts are underway to submit up-to-date samples in CY2026 for better estimation and increasing confidence in mining outcomes. |
| Project No PS229049 | WSP |
| How Mine | March 2026 |
| S-K 1300 Technical Report Summary | Page 92 |
| Namib Minerals |
| — | Increase draw point spacings below 1400 mbs (meters below surface): Revisions to the draw point pillar design for areas between 1400mbs and 2000mbs were adopted and incorporated into the COP and GCMP. The stability of draw point pillars was validated using numerical modelling. Additional work is currently ongoing to evaluate the impact on extraction ratios. |
| — | A ground control management plan (GCMP) and support standards are to be drafted: The Code of Practice and Ground Control Management Plan documents were developed to align operational ground control practices with the current geotechnical model and mining geometries and are currently in use. As noted by WSP earlier in section 9.3 WSP has not reviewed the GCMP but has reviewed the Code of Practice. |
| 13.2.2 | Hydrogeological |
Hydrogeological consulting company, ZIVA was engaged in August 2024 for Hydrogeological studies and ground water surveys within the mining lease (ML 28). Their findings were consistent what the mine experiences underground where water is introduced into the mine for drilling purposes and there is minimum ground water found within the mine excavations.. Recent inspection in February 2026 confirms that the mine is relatively dry.
| 13.2.2.1 | Underground water supply |
The Mine has two water sources from which it draws service water, namely the Chimedza Dam and the How Mine Dam. Water is pumped from these sources onto three surface tanks (Jurassic Park, Main Shaft, and North Shaft) for surge capacity. The underground mining operations receive water from the Main Shaft tank. Water is delivered by way of gravity feed to underground dams in sequence on the 4L, 8L, and 14L.
| 13.2.2.2 | Underground dewatering |
The 20, 23, 26, 28, and 30 Levels are equipped with settling dams that collect muddy water from the work areas, settle the mud and pump to the nearest dam above that level. Stage pumping proceeds up to the 14 Level settling dam where it is recycled by transfer to the service water supply circuit. Periodically, the underground water tested for contamination beyond the prescribed and the water stage pumped to surface where required. In this manner, mine dewatering requirements are maintained at a very low level.
Concurrently, fresh water from the surface is fed to the 4 Level dam. The contaminated water from the underground mining operations is directed to the processing plant for use and transfer to the TSF.
Similarly, the processing plant recycles process water by pumping water back from the TSF for re-use. Water recycling ensures sustainability, since the mine is in a dry region with low rainfall.
| 13.3 | Production parameters |
| 13.3.1 | Production rates |
Current mining practice at the HGM takes advantage of the steep inclination of the orebodies (averaging 80°) and highly competent host rock. This allows the adoption of higher productivity open stoping either by uphole stoping, or underhand via downhole benching techniques from sub-levels established between the main levels.
Current production rate at HGM targets 650 ktpa broken.
| 13.3.2 | Expected mine life |
Mine life is expected to extend to 2029 (Proven and Probable only). Mine life inclusive of Inferred material could extend to 2034 at an average mining rate of approximately 600ktpa.
Considering the total mine extractable inventory comprising Proved and Probable Reserve and MII Resource classified extractable inventory, a total Mine Life of 4 years has been forecast. Mineral Reserves will be upgraded on an annual basis until current Mineral Resources are depleted.
| Project No PS229049 | WSP |
| How Mine | March 2026 |
| S-K 1300 Technical Report Summary | Page 93 |
| Namib Minerals |
| 13.3.3 | Mining model |
Datamine’s MSO software was used to generate mineable shapes based on the updated block model. The final Mineral Reserve estimate stoping inventory is a combination of:
| — | New MSO shapes, where previously there was no existing Mineral Reserve estimate inventory. |
| — | Updated existing Mineral Reserve estimate shapes (CY2024), where the original shapes were altered for practicality, proximity to voids and due to depletion. |
| — | Existing unaltered original Mineral Reserve estimate shapes (CY2024). |
| — | Please note that where existing shapes were kept in the updated Mineral Reserve estimate they were interrogated by the updated block model to confirm they remained above the updated cut-off. |
| — | Some stope shapes are located near sills and close to existing capital infrastructure. These stopes have had their recovery factors reduced to account for this. |
| — | The MSO created additional stopes below 32L have been scheduled towards the end of the mine life to allow the shaft and associated development to be in place prior to extraction. |
The key parameters for the MSO optimisation process are outlined below in Table 13-2.
Table 13-2 MSO parameters
| MSO Parameters | Value |
| Cut-off Grade | 0.60 g/t |
| Key Value Field | Au_OK |
| Density | As per block model value |
| Maximum Stope Height | 20.0 m |
| Maximum Stope Length | 20.0 m |
| Maximum Stope Width | 20.0 m |
| Minimum Stope Width | 4.0 m |
| Minimum Ore width of Stope | 3.0 m |
| Overbreak-Added (footwall and hangingwall respectively) | 0.5 m (total of 1m overbreak) |
| Inter Stope Minimum Waste Pillar | 10.0 m |
| Minimum Hangingwall Angle | 45 degrees |
| Minimum Footwall Angle | 45 degrees |
| Project No PS229049 | WSP |
| How Mine | March 2026 |
| S-K 1300 Technical Report Summary | Page 94 |
| Namib Minerals |
The resulting optimised MSO stoping inventory is shown below in Figure 13.3 and Figure 13.4 shows the MRE from CY2024 for comparison.
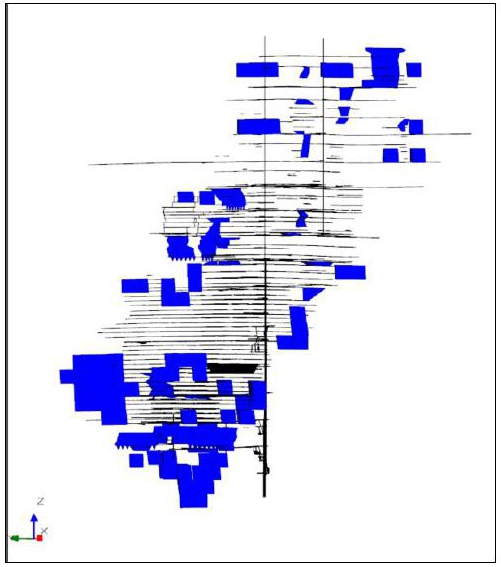
| Figure 13.3 | Updated CY2025 MRE MSO inventory looking east |
| Project No PS229049 | WSP |
| How Mine | March 2026 |
| S-K 1300 Technical Report Summary | Page 95 |
| Namib Minerals |
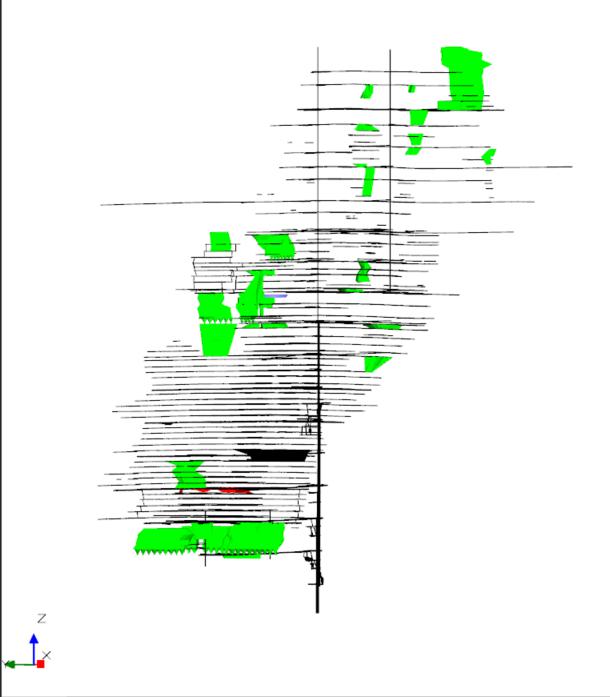
| Figure 13.4 | Previous CY2024 MRE stoping inventory looking east |
Once the stoping inventory was delineated WSP updated the mine design for lateral and vertical development required to extract all stopes above the cut-off grade. Datamine’s Studio UG software was used to create the updated mine design, updated in accordance with the current HGM mine design parameters.
Development drives through the stope shapes were depleted but not reported in the tonnages, this is in keeping with current HGM site practice
Please note that the existing mining schedule for the current HGM life of mine plan exists as an Excel based schedule only. Therefore, the client supplied development metres reported per period and per level has additional allowances, above the electronic development design strings, to allow stope extraction to take place such as allowances for stub and slot drives.
This is understood by WSP, and the decision was made to keep the client reported development metres for appropriate levels, in addition to the WSP updated development strings, as they exceed the updated electronic development total. While this may be considered slightly conservative WSP feels it is appropriate for the level of study and the requirements of the SK-1300 reporting standard.
| Project No PS229049 | WSP |
| How Mine | March 2026 |
| S-K 1300 Technical Report Summary | Page 96 |
| Namib Minerals |
Figure 13.5 and Figure 13.6 show the updated development and total mine design respectively.
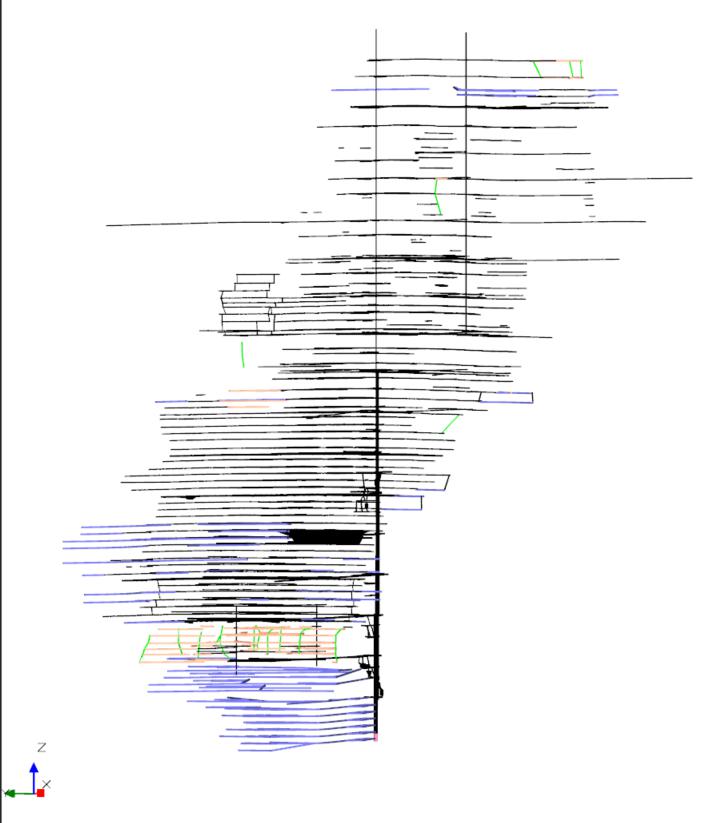
| Figure 13.5 | Updated lateral and vertical development looking east |
| Project No PS229049 | WSP |
| How Mine | March 2026 |
| S-K 1300 Technical Report Summary | Page 97 |
| Namib Minerals |
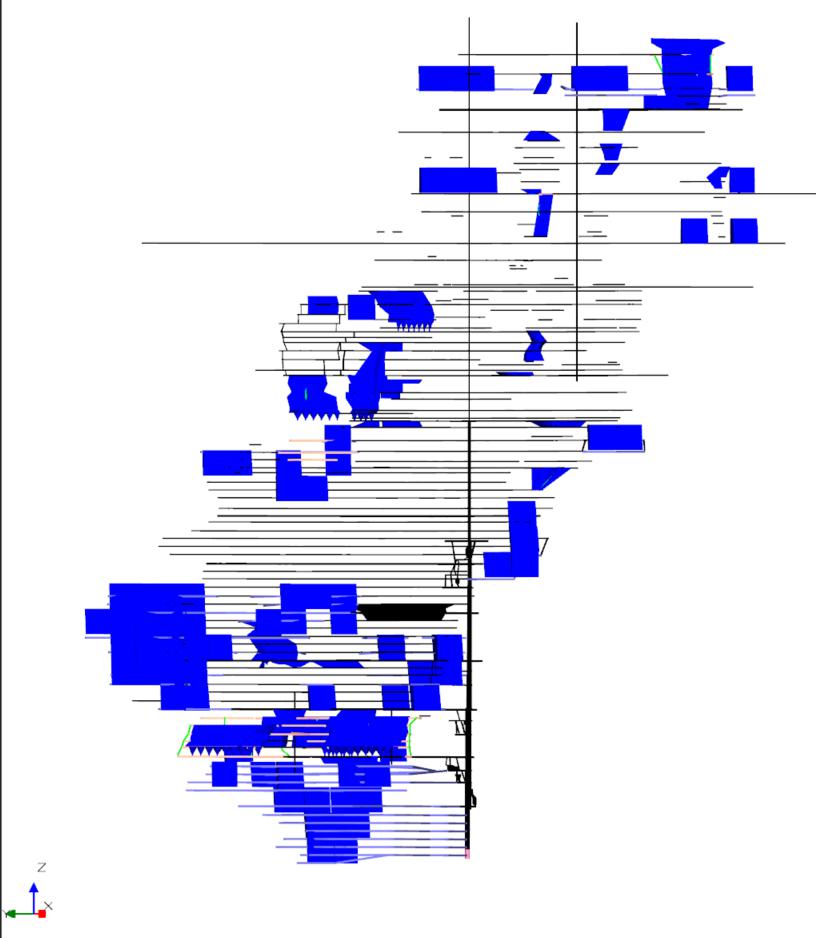
| Figure 13.6 | CY2025 MRE updated mine design looking east |
| 13.4 | Mining fleet, machinery, and personnel requirements |
| 13.4.1 | Mining fleet and machinery |
HGM is a rail mine that utilises rechargeable electric battery powered locomotives and 5 t Granby style side tipping cars. Batteries are lead acid and upgraded recently on the 30 Level to rechargeable lithium batteries installed to a 10 t locomotive to allow haulage of 7 t capacity rail cars and operation of larger 1-2 t capacity, pneumatically powered rocker-shovels.
Ore and waste are mucked from stope drawpoints and development headings using pneumatically powered rocker-shovels. Sublevels are mucked using electric or pneumatic powered hoists and scrapers or by means of shovel and wheelbarrow.
Conventional hand-held techniques utilising jacklegs are employed for development and some stoping.
| Project No PS229049 | WSP |
| How Mine | March 2026 |
| S-K 1300 Technical Report Summary | Page 98 |
| Namib Minerals |
Larger capacity pneumatic rock drills, “bar and arm” style, are used for long hole drilling of stopes in a fan pattern. Holes are drilled up to 20 m at 57 mm diameter at 1.5 m ring spacings and 2.0 m drill hole toe spacings. Electric and non-electric detonators are used in combination with packaged explosive and ANFO.
| 13.4.2 | Personnel |
The mine and process plant has 1,023 employees of which 111 are managerial employees, budgeted for a targeted maximum throughput of 650 ktpa.
| 13.5 | Scheduling process |
Datamine’s Task Scheduler (DTS) software was used to create the underground mining schedule as shown below in Figure 13.7.
Inputs to the schedule consist of the updated CY2025 MRE stoping inventory and the updated electronic development strings. Activities occur in a logical sequence, determined by the mining method, and are sequenced by linking strings in the Datamine UG software prior to the creation of the mining schedule in DTS.
This process is well understood and is part of modern mine planning processes.
| 13.6 | Mining schedule |
The mining schedule was levelled by total annual extracted ore (maximum 650kt per annum) and lateral development metres (maximum 10,800m per year) as per the current HGM operating limitations.
It has been assumed that HGM has the appropriate underground resources, including both labour and mobile equipment, to sustain these planned thresholds.
Please note that for the Mineral Reserve only mining schedule the maximum rate of 650ktpa was unable to be met even with the inclusion of marginal stopes. The current extraction limit is only able to be realised utilising Inferred material in the LOMP.
Dilution estimates were incorporated earlier in the stope optimiser process.
The extraction recovery modification factor of 90% was applied in the DTS schedule.
| Project No PS229049 | WSP |
| How Mine | March 2026 |
| S-K 1300 Technical Report Summary | Page 99 |
| Namib Minerals |
Figure 13.7 shows an example of the DTS Mineral Reserve electronic LOM schedule. Table 13.3 CY2025 Proven and Probable Mineral Reserve estimate. Figure 13.8 shows the annual ore tonnages and grades for the LOM Mineral reserve estimate.
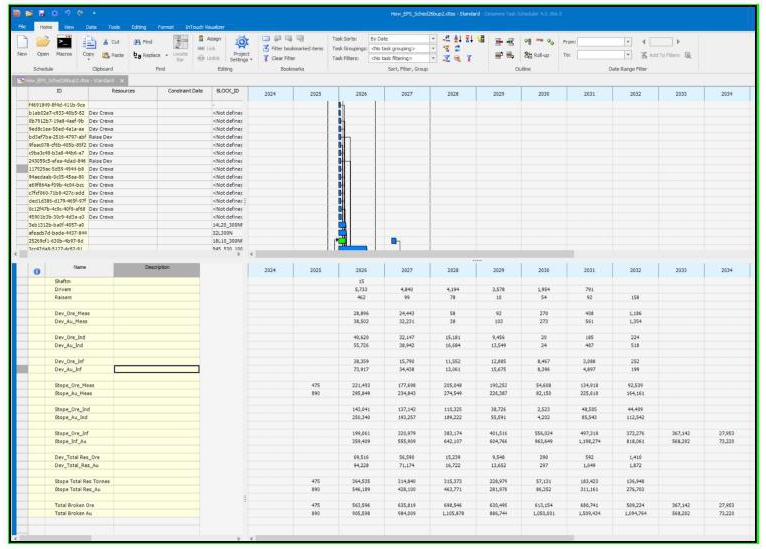
| Figure 13.7 | DTS mining schedule |
Table 13-3 CY2025 MRE (Proven and Probable only)
| HGM MINE PRODUCTION FOR FY 2026 TO 2029 (Proven and Probable Only) | ||||||
| Units | CY2026 | CY2027 | CY2028 | CY2029 | TOTAL | |
| Total Development | m | 8,815 | 10,800 | 10,800 | 10,800 | 41,215 |
| Capital Development | m | 881 | 1,200 | 1,200 | 1,200 | 4,481 |
| Total waste broken (Capital) | t | 9,696 | 12,000 | 12,000 | 12,000 | 45,696 |
| Tonnage broken | t | 296,126 | 508,524 | 517,308 | 324,966 | 1,646,924 |
| Metres drilled - Jack Hammer | t | 161,369 | 279,732 | 284,681 | 176,319 | 902,100 |
| Metres drilled - Long H | m | 182,892 | 186,226 | 186,743 | 185,279 | 741,140 |
| Tonnage hoisted (Waste) | t | 9,696 | 12,000 | 12,000 | 12,000 | 45,696 |
| Tonnage hoisted (Ore) | t | 286,430 | 496,524 | 505,308 | 312,966 | 1,601,228 |
| Tonnage hoisted | t | 296,126 | 508,524 | 517,308 | 324,966 | 1,646,924 |
| Ore Milled - ROM | t | 286,430 | 496,524 | 505,308 | 312,966 | 1,601,228 |
| Head Grade - ROM | g/t | 1.54 | 1.35 | 1.72 | 1.32 | 1.50 |
| Mineral Reserve Ounces | oz | 14,157 | 21,553 | 27,966 | 13,302 | 77,971 |
| Project No PS229049 | WSP |
| How Mine | March 2026 |
| S-K 1300 Technical Report Summary | Page 100 |
| Namib Minerals |
| HGM MINE PRODUCTION FOR FY 2026 TO 2029 (Proven and Probable Only) | ||||||
| Units | CY2026 | CY2027 | CY2028 | CY2029 | TOTAL | |
| TOTAL TONNES MILLED | t | 286,430 | 496,524 | 505,308 | 312,966 | 1,601,228 |
| ROM - Residues | g/t | 0.23 | 0.23 | 0.23 | 0.23 | 0.23 |
| Satellite - Residues | g/t | |||||
| MET.Recovery ROM | % | 89.00 | 89.00 | 89.00 | 89.00 | 89.0 |
| MET.Recovery Satellite | % | |||||
| GOLD PROD - ROM | oz | 12,600 | 19,182 | 24,890 | 11,838 | 68,509 |
| GOLD PROD - Satellite | oz | |||||
| TOTAL GOLD PRODUCED | oz | 12,600 | 19,182 | 24,890 | 11,838 | 68,509 |
| TOTAL GOLD PRODUCED | kg | 392 | 597 | 774 | 368 | 2,131 |
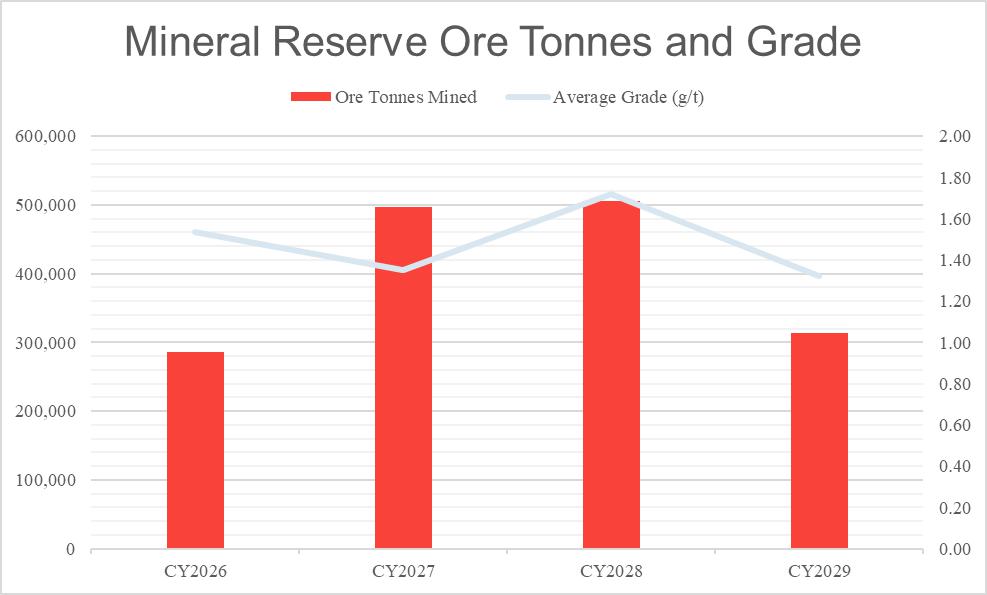
| Figure 13.8 | Total ore tonnes and average gold grade (g/t) - Proven and Probable only |
| Project No PS229049 | WSP |
| How Mine | March 2026 |
| S-K 1300 Technical Report Summary | Page 101 |
| Namib Minerals |
Table 13-4 below shows the larger strategic LOMP that includes Inferred material. As discussed earlier the included Inferred material has been selected and included in the strategic LOMP where it is safe and economic to do so, is extractable by current mining practices, and is located nearby to current workings. Additionally, a full strategic mine plan update is recommended to determine what additional Inferred material may be included. WSP notes that the majority of the included Inferred material, some of which is already being extracted, has previously been assessed via sludge hole sampling, the results of which were not utilised in assessing resource classification in the block model update as is consistent with accepted industry practice. This being the case it is also correct to state that, historically, HGM has a high resource conversion rate from their sludge sampling.
Table 13-4 HGM mine strategic life of mine plan (Proven, Probable and Inferred)
| HGM MINE PRODUCTION FOR FY 2026 TO 2034 (Proven, Probable and Inferred) | |||||||||||
| Units | CY2026 | CY2027 | CY2028 | CY2029 | CY2030 | CY2031 | CY2032 | CY2033 | CY2034 | TOTAL | |
| Tonnage broken | kt | 581 | 644 | 644 | 644 | 644 | 644 | 644 | 644 | 536 | 5,628 |
| Metres drilled - Long H | km | 166 | 184 | 184 | 184 | 184 | 184 | 184 | 184 | 153 | 1,608 |
| Tonnage hoisted (Ore) | kt | 581 | 644 | 644 | 644 | 644 | 644 | 644 | 644 | 536 | 5,628 |
| Tonnage hoisted | kt | 581 | 644 | 644 | 644 | 644 | 644 | 644 | 644 | 536 | 5,628 |
| Ore Milled - ROM | kt | 581 | 644 | 644 | 644 | 644 | 644 | 644 | 644 | 536 | 5,628 |
| Head Grade - ROM | g/t | 1.46 | 1.36 | 1.65 | 1.35 | 1.51 | 1.51 | 1.51 | 1.81 | 2.00 | 1.57 |
| TOTAL TONNES MILLED |
kt | 581 | 644 | 644 | 644 | 644 | 644 | 644 | 644 | 536 | 5,628 |
| ROM - Residues | g/t | 0.16 | 0.15 | 0.18 | 0.15 | 0.17 | 0.17 | 0.17 | 0.20 | 0.22 | 0.17 |
| MET.Recovery ROM | % | 89.0 | 89.0 | 89.0 | 89.0 | 89.0 | 89.0 | 89.0 | 89.0 | 89.0 | 89.0 |
| GOLD PROD - ROM | koz | 24.27 | 25.03 | 30.38 | 24.94 | 27.78 | 27.78 | 27.78 | 33.37 | 30.73 | 252 |
| TOTAL GOLD PRODUCED | koz | 24.27 | 25.03 | 30.38 | 24.94 | 27.78 | 27.78 | 27.78 | 33.37 | 30.73 | 252 |
| TOTAL GOLD PRODUCED | t | 0.75 | 0.78 | 0.94 | 0.78 | 0.86 | 0.86 | 0.86 | 1.04 | 0.96 | 7.84 |
| Project No PS229049 | WSP |
| How Mine | March 2026 |
| S-K 1300 Technical Report Summary | Page 102 |
| Namib Minerals |
| 14 | Processing and recovery methods |
| 14.1 | Processing methodologies and flowsheets |
Metallurgical operations at HGM are carried out in a Run of Mine (ROM) to handle a throughput of 40,500 tpm shown in Figure 14.1.
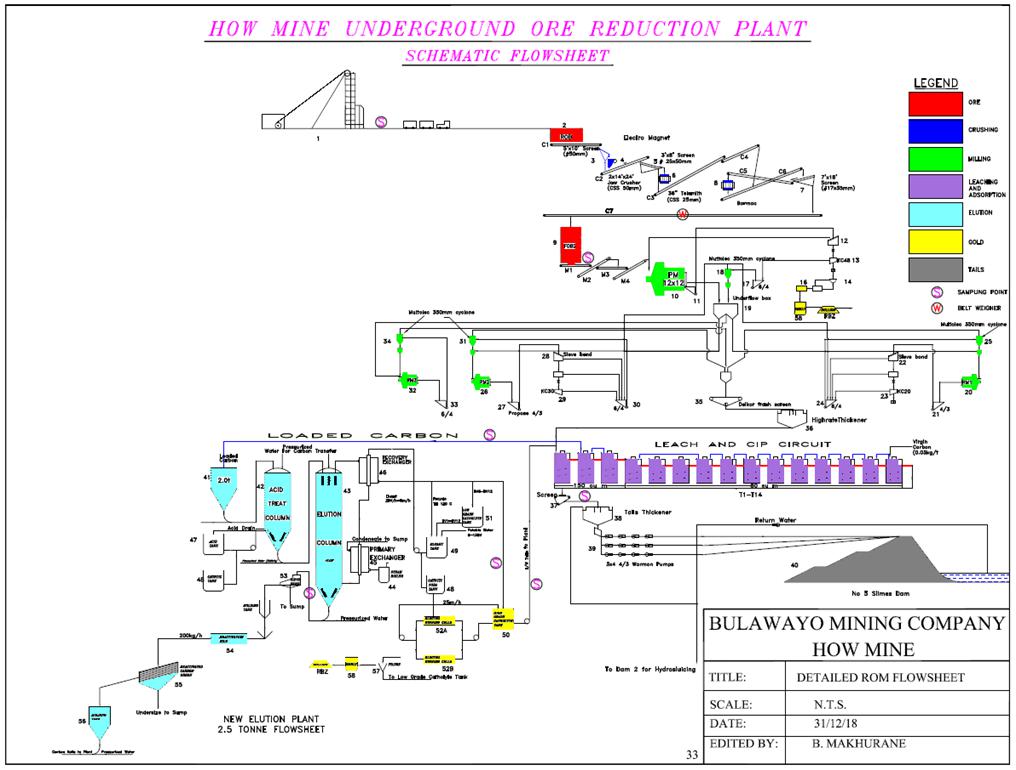
| Figure 14.1 | HGM processing flowsheet (KDM 2018) |
| 14.2 | Processing plant throughput and characteristics |
| 14.2.1 | Run of Mine crushing plant |
Hoisted ore from North Shaft is transported to a Rough-Ore-Bin (ROB) with a capacity of 100 tonnes, then fed into a crushing plant for size reduction. There are two circuits: the old circuit, with three stages (primary and secondary as open circuits, tertiary as closed), and the new circuit, with two stages (primary open, secondary closed). Final product is stored in Fine-Ore-Bins (FOBs) with a combined capacity of 700 tonnes. Three vibro-feeders draw ore from the ROB onto a conveyor feeding a Single Deck Vibrating Screen with 50 mm grizzly bars. Oversize goes to a Jaw Crusher (closed size setting 50 mm for old circuit, 100 mm for new).
| Project No PS229049 | WSP |
| How Mine | March 2026 |
| S-K 1300 Technical Report Summary | Page 103 |
| Namib Minerals |
At the secondary stage, ore is screened at a double deck Vibrating Screen. For the new circuit, oversize from the top deck goes to the HP300 crusher, while oversize from the bottom deck is conveyed to a tertiary screen. For the old circuit, oversize goes to a gyratory secondary crusher. At the tertiary stage, ore is crushed by a Barmac 9600 crusher in a closed circuit with a Vibro-King Screen. Undersize is final product, fed to FOBs, and oversize is conveyed back to the Barmac crusher for further crushing.
| 14.2.2 | Grinding and gravity concentration plant |
Crushed ore is ground in two stages to achieve 80% passing 75 μm. From the Fine Ore Bin, ore passes over a Ramsey weightometer and auto-sampler, then transfers via four conveyors to a 12’ x 12’ (1230 Hp) Marcy overflow ball mill for primary grinding. The mill operates in closed circuit with a VD9 scalping screen with a 5 mm aperture size. Screen undersize goes into a 48-inch Knelson gravity concentrator, while oversize flows back into the mill.
| 14.2.3 | Run of Mine CIP plant |
In the leach plant, cyclone overflow is thickened from 25% to 45–50% solids using Hi-Rate Thickeners with flocculant assistance. Cyanide and hydrogen peroxide are added to the thickener underflow before transferring pulp to the CIP plant. The CIP plant consists of eighteen mechanically agitated tanks, each with specific parameters for pulp conditioning. A cyanide solution dosing system maintains cyanide concentration throughout the leach process, using gaseous oxygen from a rented BOC Pressure Swing Absorption (PSA) plant and commercial hydrogen peroxide. Inter-stage screens retain carbon at about 20 g/l in select tanks and recessed-impeller pumps transfer carbon between tanks. Loaded carbon is transferred to elution at the head-end of the CIP plant, while carbon capture screens capture carbon at the tail-end. Tailings slurry is pumped to the TSF using multiple series of pumps.
| 14.2.4 | Elution plant |
Clean loaded carbon undergoes a process before elution: it is soaked in a hydrochloric acid solution for 30 minutes to dissolve inorganic impurities, then drained, and residual acid is neutralized with caustic soda. The AARL system is used for gold stripping: loaded carbon is treated with a caustic cyanide solution at 120°C and 2 bars, followed by hot potable water to wash eluted gold into holding tanks. The effluent circulates through electro winning cells, each with stainless-steel cathodes and strips, operating at 4 volts and 400 amps DC for 18 hours. Spent electrolyte is returned to the leach circuit. Eluted carbon is re-activated at 700°C, screened for fines removal, and returned to the CIP bottom tank.
| 14.2.5 | Clean-up and smelting |
Gold deposited on the stainless-steel cathodes is removed using a high-pressure water cleaner and collected in a settling tank. Excess water is removed, and the sludge is treated with hydrochloric acid to digest base metals. Residual sludge is rinsed, filtered, weighed, fluxed, and charged into a diesel-fired furnace crucible with borax, sodium nitrate, and fluorspar. Temperatures exceeding 1,500°C are used, and the molten charge is poured into cast iron moulds to produce bullion ingots. Slag is removed from the ingots, which are then cleaned, drilled for assay samples, and weighed. Bullion fineness is ensured to be at least 85% gold and 15% silver.
| 14.3 | Product sampling |
| 14.3.1 | Mill feed |
Samples are collected at an incremental frequency of half-hour by a Multotec hammer sampler positioned on the conveyor belt feeding the mills (Table 14.1). At two hours interval, two samples A and B are produced; being two hourly composite samples is riffled to make a 2 kg fraction for assay, with the balance used for making up an 8-hour composite sample. Similarly, during reduction of the shift composite sample, a 24-hour composite sample is generated to give a total 22 samples.
| Project No PS229049 | WSP |
| How Mine | March 2026 |
| S-K 1300 Technical Report Summary | Page 104 |
| Namib Minerals |
Table 14-1 Mill feed sampling specifications
| Parameter | Description |
| Position of Sampling Equipment | Mill Feed Conveyor |
| Top size of particles | 17 mm |
| Execution | Hammer Sampler |
| Frequency | 30 minutes |
| Sample handling | 10 kg bulk riffled down to 2 kg lab sample |
| Number of samples collected per shift | 5 |
| Duration of a shift | 8 hours |
| 14.3.2 | Feed tonnage |
Feed tonnage is measured on two points in the plant. In the mill area, tonnage throughput is determined from a mill weightometer on the primary feed conveyor. In the CIP area, tonnage throughput is determined by tonnage-box measurements of the header tank feed stream (refer to Table 14.2).
Table 14-2 Feed tonnage sampling specifications
| Location Name | Weightometer Tonnage | Box 2 Tonnage |
| Position | Primary Mill feed conveyor | CIP header tank feed |
| Method/equipment | Mill weightometer | Tonnage-box |
| 14.3.3 | Residues |
Tailings residues and recovery are estimated from sampling at 30-minute intervals by means of a manual sample cutter from the final tailings discharge tank 18 with assays completed at the on-site mine assay laboratory (Table 14.3).
Table 14-3 Residues sampling specifications
| Position of Sampling Equipment | Tank 18 Discharge Box |
| Execution | Manual Sample Cutter |
| Frequency of sampling | 30 minutes |
| Analysis site | Mine Assay Laboratory |
| Project No PS229049 | WSP |
| How Mine | March 2026 |
| S-K 1300 Technical Report Summary | Page 105 |
| Namib Minerals |
| 14.4 | Metallurgical recovery |
WSP conducted a review of historical metallurgical recoveries. Based on the historical data, and planned processing upgrades communicated by Namib, WSP believes a metallurgical recovery of 89% is reasonable. The recovery relationship is determined by both the head grade and grind size and this relationship is non-linear. WSP notes that while the head grade is forecast to lower from current levels over the coming years before increasing again towards to the end of the current LOM strategic plan, improved grind size and consistency will assist in alleviating any losses. Namib has advised that planned improvements to grind quality are expected as part of the planned upgrades to the processing plant that are currently underway. Please refer to Table 14-4 for the historical data provided.
Table 14-4 Historical metallurgical recovery data
| Year | Tonnage milled (t) | Grade (g/t) | Recovery (%) | Gold (kg) | Average tpm (kt) | Tails (g/t) | Grinds (%) |
| 2016 | 341,430 | 5.02 | 91.2 | 1561 | 28.5 | 0.44 | 69.7 |
| 2017 | 299,611 | 4.52 | 90.5 | 1226 | 25.0 | 0.43 | 67.5 |
| 2018 | 329,894 | 4.16 | 90.1 | 1236 | 27.5 | 0.41 | 68.0 |
| 2019 | 320,486 | 2.89 | 86.3 | 800 | 26.7 | 0.4 | 61.4 |
| 2020 | 287,447 | 2.41 | 85.6 | 594 | 24.0 | 0.35 | 66.1 |
| 2021 | 363,550 | 2.91 | 89.2 | 945 | 30.3 | 0.32 | 71.5 |
| 2022 | 379,472 | 2.45 | 89.7 | 833 | 31.6 | 0.25 | 69.0 |
| 2023 | 450,343 | 2.6 | 89.6 | 1049 | 37.5 | 0.27 | 72.4 |
| 2024 | 473,034 | 2.66 | 90.4 | 1139 | 39.4 | 0.25 | 73.4 |
| 2025 | 475,658 | 1.84 | 88.7 | 778 | 39.6 | 0.21 | 72.6 |
| 14.5 | Product stockyard |
HGM has Surface Sands stockpile namely Dam 3 and Dam 4. It is reported as Probable Category in which estimation is supported based on auguring exercise conducted by a contractor during the 3rd Quarter of 2021. Volumetric Survey is carried out by the Survey Team for the estimation of the volume and tonnage conversion.
| Project No PS229049 | WSP |
| How Mine | March 2026 |
| S-K 1300 Technical Report Summary | Page 106 |
| Namib Minerals |
| 14.6 | Energy and water process materials requirements |
| 14.6.1 | Mine power plant |
Electricity is supplied from the national grid through Springs and Criterion lines, operated by Zimbabwe Electricity Supply Authority (ZESA). The mine receives power at 33 kV from Zimbabwe Electricity Transmission and Distribution Company (ZETDC) via two lines: one from Springs substation and another from Criterion substation. The mine has nine points metered by ZETDC, with supply stepped down to various voltages for different purposes. Underground operations and the high-density village are supplied at 2.2 kV, further stepped down to 380V and 220V for domestic use.
Distribution to underground mining operations feeds various substations, with heavy equipment supplied at 550V, and further transformed for pumping and lighting. The processing plant is fed at multiple voltage levels, with plans to upgrade Springs power supply to accommodate expansion. The mine also has a compressed air generation plant, delivering compressed air to the processing plant and underground operations through various supply lines, with peak demand at approximately 13,500 CFM.
| 14.6.2 | Mine water management system |
The Mine utilises water from Chimedza Dam and How Mine Dam, pumping it onto surface tanks for surge capacity. Underground mining operations receive water from the Main Shaft tank, delivered via gravity feed to dams on various levels. Settling dams collect muddy water from work areas, with pumping facilitating recycling up to the 14 Level dam. Contaminated water is directed to the processing plant for use and transfer to the Tailings Storage Facility (TSF). The processing plant recycles process water from the TSF for re-use, ensuring sustainability in a dry region with low rainfall. Plans for expansion include upgrading the water reticulation system by constructing HDPE-lined reservoirs and drilling boreholes for additional water supply.
| 14.7 | QP’s opinion |
The existing process facility at How Mine has a record of successful operation/ Process recoveries consistent with previous experience are anticipated at levels consistent with the recent 3-year average of 89.0%.
Risks to future plant throughput and recovery include:
| — | Currently planned plant construction and refurbishment activities proceed in accordance with schedule. |
| — | Planned maintenance and refurbishment are identified and attended to ahead of time. |
The plant is relatively more complex in layout as additions and upgrades have been implemented over the course of many years in an area that is relatively constrained. Efforts should be made to rationalise and streamline the plant layout over time.
Opportunities may exist to improve recoveries given that residue levels of 0.23 g/t are relatively high by industry standards for conventional gravity recovery and CIP/CIL plants. A review of average grind size and metallurgical characteristics of the ore types may prove beneficial.
Security of the facility and safeguarding from both internal and external threats will be ongoing, particularly in an environment where gold prices are rising.
| Project No PS229049 | WSP |
| How Mine | March 2026 |
| S-K 1300 Technical Report Summary | Page 107 |
| Namib Minerals |
| 15 | Infrastructure |
| 15.1 | Rail access |
Rail access is available at Bulawayo within 31 km northwest of MGM by road (42 minutes) and with a separate line passing through Esigodini 17 km due east and 30 km by road (41 minutes). This is a general freight train service in Zimbabwe that caters to the Mining, Energy, Industrial, and Manufacturing sectors. The NRZ rail network map is presented in Figure 15.1.
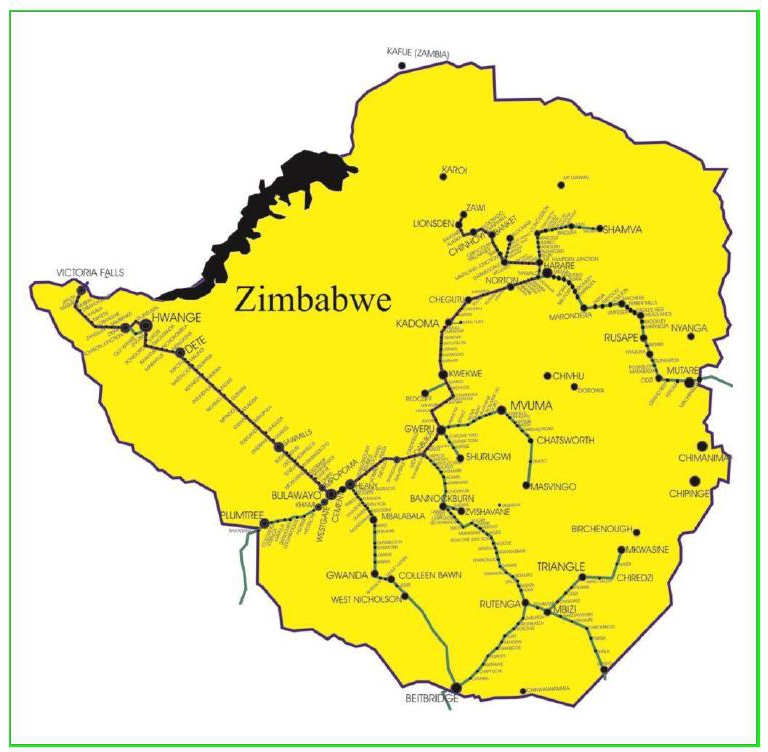
| Figure 15.1 | NRZ rail network schematic (NRZ 2024c) |
Commercial corridors and trade routes exist in the following areas:
| — | Zimbabwe-South Africa: Beitbridge, on the Zimbabwe-South African border and along the trade route to Durban, has an import-export ecosystem dominated by import-export clearance firms. |
| — | Zimbabwe-Mozambique: Mutare, on the border with Mozambique along the trade route to Beira port, is dominated by the wood, timber, and allied industries. |
| Project No PS229049 | WSP |
| How Mine | March 2026 |
| S-K 1300 Technical Report Summary | Page 108 |
| Namib Minerals |
| — | Victoria Falls: The Victoria Falls special economic zone has been designated as an International Financial Services enter which caters to customers outside Zimbabwe. The town of Victoria Falls is home to a foreign exchange-denominated stock exchange and boasts of a tourism-financial services ecosystem. It also has several tourist attractions including Victoria Falls and game parks. |
(United States International Trade Administration, 3 June 2024, https://www.trade.gov/country-commercial-guides/zimbabwe-market-overview).
| 15.2 | Port access |
Zimbabwe is a land-locked country with key road and rail routes through to ports in Durban in South Africa and Beira in Mozambique.
| 15.3 | Roads |
The HGM is accessed via a tarred road that is in fair condition.
| 15.4 | Camp |
Staff are largely housed on-site in a family accommodation area, while a few members are bussed in from Bulawayo daily.
| 15.5 | Tailings |
Pulp from tank 14 is fed into a tailings pump system. The system comprises of three identical pumping banks in parallel, each bank being a four-stage series pump arrangement that utilises 4/3D pumps. The system transfers tailings slurry through a dynamic head of 101 m to a disposal site (Dam 5) 2 km away from the plant. Dam 5 water is pumped back for reuse in the process plant.
| 15.6 | Potable water and wastewater |
Water used in the operations is obtained from a dam on the Gabalozi River (on mine site) and Chimedza dam (some 7 km west of the mine location). Drinking water is provided from a line supplying the city of Bulawayo.
Fresh water from surface is fed to the 4 Level dam.
The processing plant recycles process water by pumping water back from the TSF for re-use. Water recycling ensures sustainability, since the HGM is located in a generally dry region with low rainfall (Metallon Operations Reports).
| Project No PS229049 | WSP |
| How Mine | March 2026 |
| S-K 1300 Technical Report Summary | Page 109 |
| Namib Minerals |
| 15.7 | Accommodation and offices |
At the HGM, there are 834 employees but only 769 housing units, leaving a shortfall of 65 units for each employee to have their own allocated accommodation. The types of housing units vary, ranging from single-roomed to 6-roomed houses in the High-Density Village, and 3 to 4-bedroom houses in the Low-Density Village. Some middle management employees are accommodated in guest houses on site or in houses in the Low-Density area of Bulawayo. To improve occupational health and safety, there is a proposal to construct individual toilets and bathrooms per unit to replace the communal system currently in place for single-roomed houses. The mine receives a consistent water supply from the Bulawayo City Council, supplemented by boreholes to reduce the likelihood of water shortages in the foreseeable future.
| 15.8 | Non-process infrastructure |
No data provided for Non-process Infrastructure (NPI).
| 15.9 | Information and communications technology systems |
No data provided for Information and Communications Technology (ICT) systems.
| 15.10 | Other support facilities and utilities |
The HGM operates a local clinic that serves both mine workers and the surrounding community, addressing minor health issues and providing maternity care. To improve healthcare quality, a medical doctor visits weekly, alongside permanent, highly qualified nurses and support staff. Regular medical surveillance and check-ups are conducted to monitor worker health and ensure their wellbeing.
| 16 | Market studies |
| 16.1 | Nature and material terms of agency relationships |
The HGM is 100% owned by BMC Limited which in turn is owned by Namib Minerals, with no agency relationships applicable.
| Project No PS229049 | WSP |
| How Mine | March 2026 |
| S-K 1300 Technical Report Summary | Page 110 |
| Namib Minerals |
| 16.2 | Results of relevant market studies |
No recent formal market studies have been completed. Gold and silver are sold according to open market prices as mandated by the Zimbabwean government. Analysis is based on historical pricing using a 3-year trailing average, combined with industry forecasts for exchange rate and inflation.
| 16.3 | Commodity price projections |
Pricing assumptions for gold and silver are based on historical spot pricing in an open market for precious metals, government mandated terms for payment, foreign exchange, and inflation recent history. The LOM plan and pay limit (COG) assessment has assumed a gold price of US$3,272/oz and silver price of US$38.5/oz while the project cashflow analysis has assumed a gold price of US$3,272/oz and excluded silver byproduct as a material revenue source.
The price assumptions are reasonable given spot pricing of US$5,189/oz (Feb 2026). The assumed gold price is materially lower than the average realised price (past 12 months). The spot price for silver is currently US$89/oz whilst, again providing significant headroom above reserve and resource assumptions.
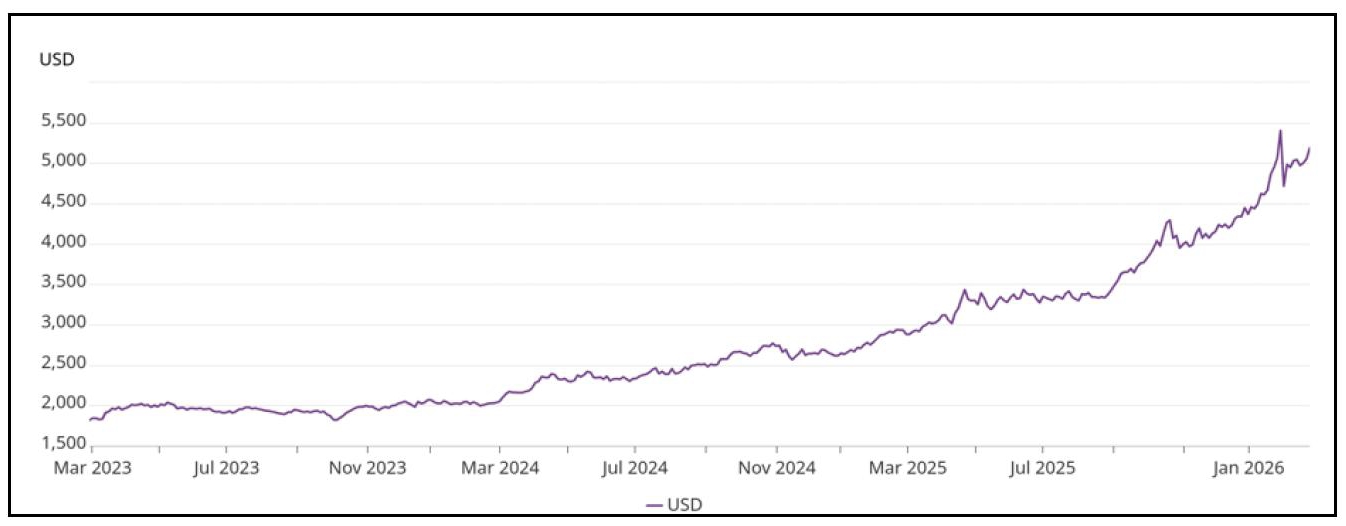
| Figure 16.1 | Historical (blue) gold spot price US$/oz (World Gold Council Feb 26) |
Gold proceeds are paid 75% in USD and 25% in local currency with effect from February 2023 (previously 60% USD and 40% in local currency). Sale of gold under these terms has been mandated by the Zimbabwean Government since the start of 2020. The impact of Government controls on gold and silver sales with respect to foreign currency retentions have been considered for the LOM plan.
The local currency component of revenue has been employed for in country expenses, however, this value is subject to inflation (4.1%, January 2026, Table 16.1) and exchange rate risk (Figure 16.2). Under these circumstances prompt expenditure of local currency is warranted.
| Project No PS229049 | WSP |
| How Mine | March 2026 |
| S-K 1300 Technical Report Summary | Page 111 |
| Namib Minerals |
Table 16-1 Zimbabwean inflation rate and economic indicators (Trading Economics, 13 February 2026)
| Indicator | Last | Previous | Highest | Lowest | Units | Date |
| Currency (ZWL per USD) | 25.56 | 25.56 | 28.68 | n/a | ZWL | Feb-2026 |
| Stock Market (ZSE All Share Index) | 360.19 | 359.26 | 365.11 | 185.68 | Points | Feb-2026 |
| GDP Annual Growth Rate | 2.0 | 5.4 | 22.57 | -17.2 | percent | Dec-2024 |
| Unemployment Rate | 8.6 | 8.8 | 10.8 | 4.4 | percent | Dec-2024 |
| Inflation Rate (CPI) | 4.1 | 15.0 | 786 | -7.5 | percent | Jan-2026 |
| Interest Rate (Policy) | 35 | 35 | 200 | 15 | percent | Jan-2026 |
| Balance of Trade | 90.5 | 28.7 | 293 | -3958 | USD Million | Nov-2025 |
| Current Account Balance | 501 | 134 | 920 | -2750 | USD Million | Dec-2024 |
| Current Account to GDP | 1.5 | 0.4 | 4.1 | -19.3 | percent of GDP | Dec-2024 |
| Government Debt to GDP | 87 | 92.6 | 248 | 48.44 | percent of GDP | Dec-2024 |
| Government Budget Balance | -1.2 | -6.4 | 2.0 | -11.2 | percent of GDP | Dec-2024 |
| Corporate Tax Rate | 24.72 | 24.72 | 30.9 | 24 | percent | Dec-2025 |
| Personal Income Tax Rate | 41.2 | 41.2 | 51.5 | 36.05 | percent | Dec-2025 |
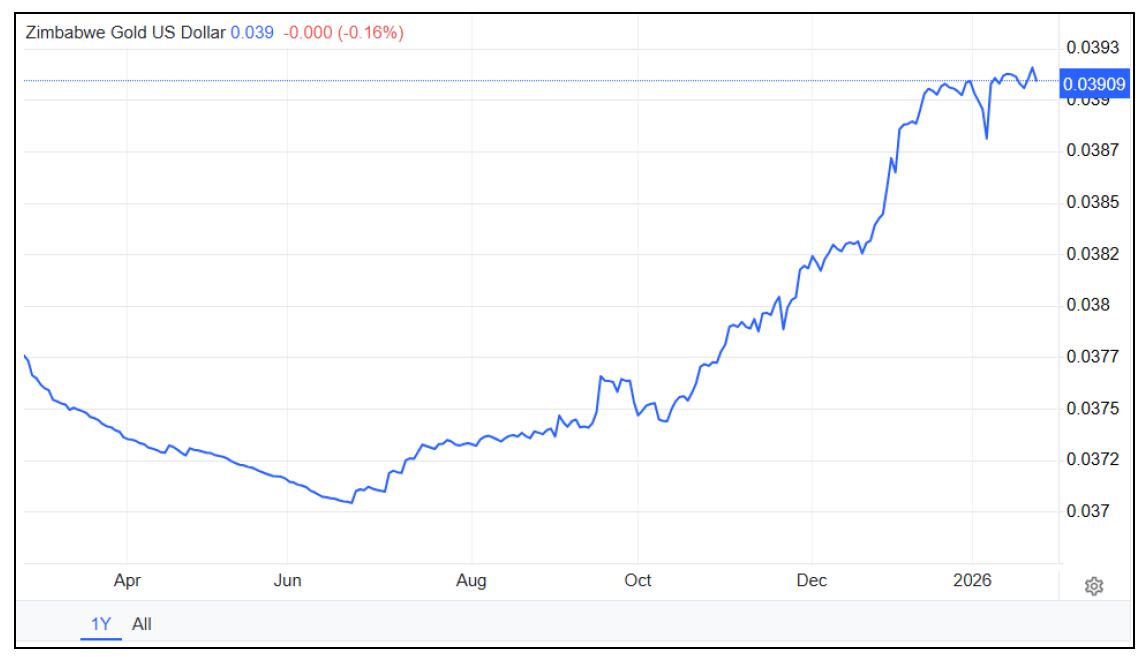
| Figure 16.2 | Zimbabwean gold currency exchange rate ZiG/USD (Trading Economics, 24 February 2026) |
| Project No PS229049 | WSP |
| How Mine | March 2026 |
| S-K 1300 Technical Report Summary | Page 112 |
| Namib Minerals |
| 16.4 | Mining and processing |
Mining and processing at HGM are conducted on an owner operator basis.
| 16.5 | Product transport and handling |
A gold and silver doré is produced for sale to the Zimbabwean government nominated agent, Fidelity. Gold generally averages 87% by weight. The product is transported by a private professional security company. Fawcetts Security, via armoured car to airport, then airlifted to Harare. Then transported by armoured car to Fidelity, a government owned refining facility via the Motapa Investment Fund (sovereign fund). Gold and silver is valued at spot pricing on the day of receipt of the doré with Fidelity stipulating allowances for refining charges (US$21/oz Au) and government royalty (5%).
| 16.6 | Hedging arrangements |
No hedging arrangements are currently in place.
| 16.7 | Forward sales contracts |
No forward sales contracts are currently in place.
| 16.8 | Contracts with affiliated parties |
No contracts with affiliated parties are currently in place with respect to gold sales.
| Project No PS229049 | WSP |
| How Mine | March 2026 |
| S-K 1300 Technical Report Summary | Page 113 |
| Namib Minerals |
| 17 | Environmental studies, permitting and plans, negotiations, or agreements with local individuals or groups |
| 17.1 | Introduction |
The following sections detail the environmental studies, permitting, plans, negotiations, or agreements with local individuals or groups and describe the factors pertaining to environmental compliance, permitting, and local individuals or groups, related to the Property.
Environmental studies and impact assessments are covered under Section 17.5 of this TRS and acknowledge that the HGM has been in operation since 1941. While baseline studies do not exist, the responsibility and requirements for management, monitoring and remediation are described as part of the Environmental Management Plan (EMP). Prior to 2025, compliance with environmental regulations was covered by an annual government audit and accreditation. This process is still in place for exploration of satellite deposits.
Requirements and plans for waste and tailings disposal, site monitoring, and water management during operations and after mine closure are covered under the 2023 EMP and as summarised under the relevant Sections of this TRS (17.7, 17.8, and 17.9). Mine closure plans have recently been updated by external consultants Enmin Consulting (Private) Limited (Enmin) in June 2024 (Section 17.12).
Project permitting requirements are covered under Section 17.4 of this TRS. The HGM is considered in good standing.
Commitments to ensure local procurement and hiring are covered under Section 17.11.8 of this TRS.
The QP’s opinion on the adequacy of current plans to address any issues related to environmental compliance, permitting, and local individuals or groups is covered under Section 17.14 of this TRS.
| 17.2 | Environmental management and corporate responsibility |
Since the previous report there has been no major environmental incidents recorded. The mine’s Business Excellence Management System was reviewed to strengthen Environmental, Social and Governance (ESG/sustainability) issues. ESG framework and actions towards this are being implemented to ensure a structured approach to sustainable stakeholder engagement and shared value creation. The framework is aligned to international standards namely NASDAQ sustainability guideline 2.0, GRI 14, SDGs and IFRS S1 and S2. The asses has on foot an EMP covering mining and processing operations for the HGM. This plan acknowledges the potential to impact the environment, and provides a management plan to ensure that all aspects and impacts for current and planned operations are captured and managed in an environmentally responsible manner, to assure legal compliance and to demonstrate the BMC Zimbabwe’s commitment to protecting and preserving the environment as guided by the Environmental Management Act Chapter 20:27 of 2002, supporting regulations, as well as the Environmental Management System ISO14001:2015, for which the HGM holds accreditation.
The company is commited to enhancing the positive impacts of all current and planned projects, including employment creation, increased mineral production and profitability of the HGM and opportunity to exercise corporate social responsibility within the surrounding communities.
| Project No PS229049 | WSP |
| How Mine | March 2026 |
| S-K 1300 Technical Report Summary | Page 114 |
| Namib Minerals |
Under the EMP, the following environmental impacts are addressed during operation and decommissioning phases:
| — | Water pollution from plant wastewater, chemical spillages, tailings, domestic sewage, fuel or oil leaks. |
| — | Air pollution from laboratory fumes, generator, smelting, crushing plant, fugitive dust from TSFs, and dusty roads. |
| — | Land pollution from fuel leaks, oil leaks, effluent, tailings, waste rock, hazardous substance spillages, hazardous waste, and general solid waste. |
| — | Natural resource depletion from removal of vegetation, mineral extraction, water, electricity, fuel, and oil usage. |
| — | Land degradation during exploration and mining. |
Roles, responsibilities and authorities are clearly spelt out in order to implement the various environmental plans efficiently and effectively, including the waste management plan, hazardous substance management plan, land management plan, mine closure plan, water management plan, air quality management plan and effluent improvement plan.
BMC Zimbabwe has also prepared a Corporate Social Responsibility Policy dated March 2024, which acknowledges that it is committed to being a responsible corporate citizen by balancing the business priorities with social, economic and environmental responsibilities. Corporate social responsibility is fundamental to the long-term growth and sustainability of BMC Zimbabwe and is therefore viewed as the basis on which it conducts its business. This policy has the following objectives:
| — | To respect, consider and respond to stakeholders’ interests. |
| — | To disseminate information about the company’s activities and decisions for which the company is responsible in a comprehensive and transparent manner. |
| — | Ploughing back to the community by addressing pressing social, economic and environmental challenges in the community. |
| — | Supporting ongoing national and community initiatives. |
| — | Building a positive corporate image, reputation and creating public goodwill for the organization. |
| 17.3 | Property context |
The HGM is located approximately 30 km south-east of the city of Bulawayo in Matabeleland South Province, in the Bulawayo Mining District of Zimbabwe. The Property is at an altitude of approximately 1,250 m amsl.
| Project No PS229049 | WSP |
| How Mine | March 2026 |
| S-K 1300 Technical Report Summary | Page 115 |
| Namib Minerals |
Figure 17.1 shows a site layout map for HGM.
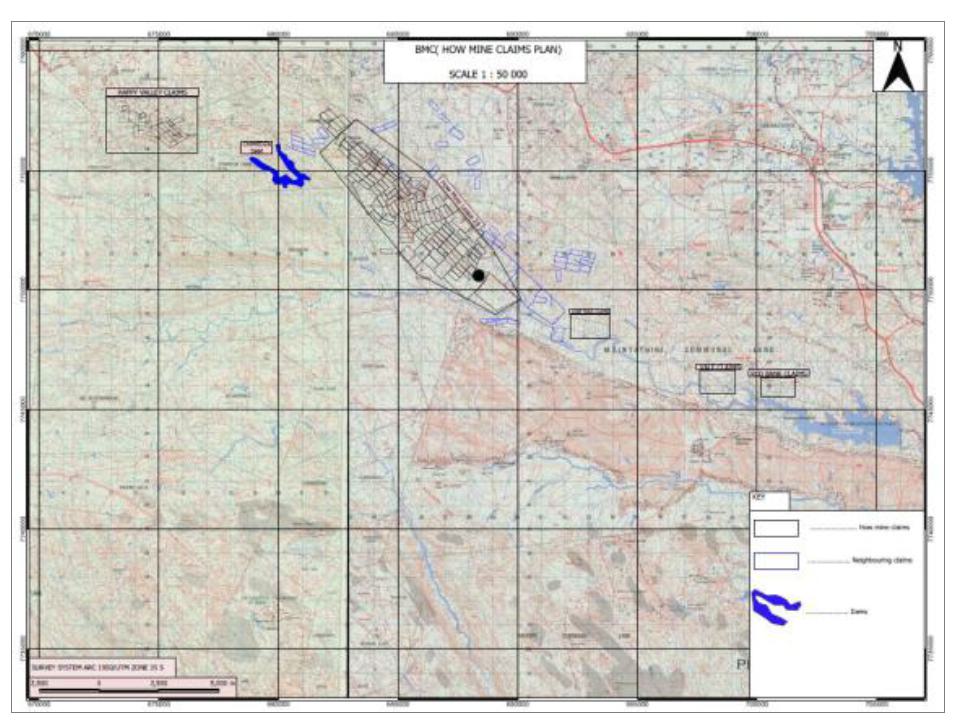
| Figure 17.1 | BMC Zimbabwe ML and other claims |
| 17.4 | Property permitting |
The following permits/licenses expiry details were confirmed :
| — | License for Storage of Explosives, Main Store – Valid 30 June 2026. |
| — | License for Storage of Explosives, Above Mine Distribution Store – Expires 30 June 2026. |
| — | License for Storage of Explosives, Above Mine Store – valid until 30 June 2026. |
| — | Air Emission License (Generator Exhaust) – valid until 31 December 2026. |
| — | Air Emission License (Assay Emission) – valid until 31 December 2026. |
| — | Effluent Disposal License – valid until 31 December 2026. |
| — | Environmental Impact Assessment Certificate (Bulawayo Mining Company) – valid until 26 June 2026. |
| — | Environmental Impact Assessment Certificate (Exploration Project) – valid until 26 June 2026. |
| — | Environmental Impact Assessment Certificate (Bulawayo South Claims – Exploration Mining and processing) – valid until 14 September 2027. |
| — | Environmental Impact Assessment Certificate (Three Castles Mine-Open Pit Mining & Exploration) – valid until 19 October 2025 (renewal applied and paid for). |
| — | ISO 14001 Certificate – valid until 14 September 2027. |
| Project No PS229049 | WSP |
| How Mine | March 2026 |
| S-K 1300 Technical Report Summary | Page 116 |
| Namib Minerals |
| — | ISO 45001 Certificate –valid until 12 June 2028. |
| — | ISO 9001 Certificate – valid until 14 September 2027. |
| — | Solid Waste Disposal License – valid until 31 December 2026. |
| — | Decommissioned Tailings Dam Solid Waste Disposal License – valid until 31 December 2026. |
| — | NORM Radiation monitoring exemption – valid until 31 December 2027. |
| — | Hazardous Substance Storage and Use License – valid until 7 April 2026. |
| — | Hazardous Waste Generation License – valid until 07 May 2026. |
| — | Hazardous Substance Importation License – valid until 31 December 2026. |
| — | Hazardous Substance Transportation License – valid until 07 April 2026. |
| — | Surface Water Permit – valid until 14 April 2029. |
| — | Water Abstraction Permit, 440 megalitres annually from Gabalozi River – Originally issued 29 November 2012 with 5-year expiry, Updated in April 2024 – valid until 14 April 2029. |
| 17.5 | Environmental and Social Impact Assessment |
At the HGM, major environmental concerns include water and land pollution, air pollution, and land degradation. The mine meets Environmental Management Agency standards and holds licenses for hazardous substances use, waste generation, and air emissions. It has a comprehensive Environmental Management Plan (EMP) outlining targets and strategies for environmental protection and compliance.
| 17.5.1 | Biodiversity and natural resources |
A Biodiversity Management Plan was developed in their Environmental Management Plan 2025 to limit the Property’s footprint and activities as well as to avoid placement of infrastructure within watercourse, wetlands or flood lines and sensitive areas.
| 17.5.2 | Managing impacts on water |
At the HGM, water used for gold extraction comes from the Gabalozi River and Chimedza Dam. Pollution from ore treatment includes sulphates and manganese, causing low pH and high levels of Electrical Conductivity and Total Dissolved Solids in the water. To tackle this, effluent is directed to No. 5 Slimes Dam before being reused in the plant. Regular monitoring ensures compliance with environmental rules.
Domestic wastewater is treated at a local plant to reduce Biological and Chemical Oxygen Demand, as well as phosphates, using biological treatment and chlorine disinfection. The treated water is reused for irrigation in tailings dam projects.
| 17.5.3 | Acid and metalliferous drainage |
No data regarding Acid and Metalliferous Drainage (AMD).
| 17.5.4 | Erosion and protection of soils |
At the HGM, land degradation stems mainly from tailings facilities spanning 58 hectares. Remediation includes re-mining and re-vegetation, consolidating all dumps into No. 5 slimes dam for rehabilitation. No. 2 Slimes Dam has been re-mined, with ongoing re-vegetation, while plans are in place for No. 3 and No. 4 Slimes Dams. Re-vegetation efforts continue at No. 5 Slimes Dam until mine closure, supported by a tree nursery for indigenous and exotic species. An invasive species eradication program targets environmental degradation prevention, focusing on lantana camara over approximately 13 hectares around the mine.
| 17.5.5 | Noise and vibration |
At the HGM, monitoring will use industry-standard seismographs to measure ground vibration and air blast simultaneously. Positioned strategically at sensitive receptors, these instruments will assess impacts. Sensitive receptors within 1,000 m but outside 500 m blast zones will be evacuated during initial blasting. Monitoring will focus on air blasts, noise, and ground vibrations to ensure they stay within acceptable levels. Differences in impacts outdoors and inside buildings will be observed.
| Project No PS229049 | WSP |
| How Mine | March 2026 |
| S-K 1300 Technical Report Summary | Page 117 |
| Namib Minerals |
| 17.5.6 | Air quality |
Air pollution at the metallurgical and assay plants mainly comes from dust during crushing. Mitigation includes dust suppression sprays and scrubber boxes. Emission sources like laboratories, generators, and incinerators are regularly sampled and analysed. All stacks fall within the blue zone band.
| 17.5.7 | Local climate impacts |
The HGM is located in a natural farming area of Zimbabwe with an average annual rainfall of 638 mm. The majority, around 80%, falls between November and January, with the highest around 120 mm. Monthly rainfall rarely exceeds 140mm, typical of conventional rainfall from the southern Frontier of the Inter-tropical Convergence Zone (ITCZ). Winter sees overcast conditions due to cold, moist air from the southeast. The gentle terrain and low rainfall minimize environmental erosion, making it suitable for mining. However, low rainfall can lead to dust propagation, requiring artificial dust suppression techniques at the mine.
| 17.5.8 | Greenhouse gas emissions |
The HGM has integrated a Greenhouse Gas Emissions Management Plan into its ESG initiatives and Environmental Management Plan Review for 2025. This plan includes developing a greenhouse gas emissions inventory to evaluate yearly emissions. Ongoing investigations seek ways to reduce emissions, with initiatives implemented to minimize greenhouse gas release into the atmosphere.
| 17.5.9 | Resources use and non-mineral waste |
No resources use and non-mineral waste data or information was provided by BMC Zimbabwe for review.
| 17.5.10 | Regulatory accreditation |
The Environmental Management Agency (EMA) oversees the annual licensing of organizations to ensure compliance with environmental laws and regulations. This process is outlined as follows:
The HGM is required to comply with the Environmental Management Act Chapter 20:27 of 2002 and its regulations, including S.I. 7 of 2007 (Environmental Impact Assessment and Ecosystem Protection) of 2007, S.I. 6 of 2007 (Effluent and Solid Waste Disposal), S.I. 10 of 2007 (Hazardous Waste Management), S.I. 268 of 2018 (Control of Hazardous Substances), S.I. 72 of 2009 (Atmospheric Pollution Control). To comply with these regulations and under EMA guidance, BMC Zimbabwe prepared an EMP (in 2023 [BMC (2023a)], given the mine existed prior to the Environmental Management Act of 2002 which required an Environmental Impact Assessment (EIA). The 2025 EMP (BMC (2023a)) comprises specific management plans such as a Waste Management Plan, Effluent Management Plan, and Resource Utilization Plan. The EMP is reviewed annually and the lates update was done in 2025.
On a quarterly basis, reports are submitted to EMA detailing environmental monitoring and progress on the management plans. The EMA also visits the HGM on a quarterly basis to conduct inspections and advise on environmental compliance and best practice. Based on the environmental monitoring results and being guided by the regulations, BMC Zimbabwe applies for annual environmental licenses comprising licenses for effluent disposal, solid waste disposal, emissions, transportation, storage and use of substances, hazardous waste generation and decommissioned TSF’s. All licenses were in good standing for 2025.
| Project No PS229049 | WSP |
| How Mine | March 2026 |
| S-K 1300 Technical Report Summary | Page 118 |
| Namib Minerals |
In cases where there are new projects and exploration outside the boundary of ML 28, BMC Zimbabwe conducts an Environmental and Social Impact Assessment (ESIA) as guided by SI 7 of 2007. An ESIA application is submitted to EMA for review and approval whereupon an ESIA license is issued to the HGM. These are also monitored by quarterly EMA inspections, and in cases where the HGM fails to comply with the license conditions, the license can be revoked.
| 17.6 | Property standards |
No property standards data or information was provided by Namib Minerals for review.
| 17.7 | Waste and tailings disposal plans |
| 17.7.1 | Waste disposal |
How Mine’s underground waste management adheres to government regulations, including the Mining (Management and Safety) Regulations SI 109 of 1990 and Environmental Management Act 20:27 of 2002. The mine prioritises the ’4Rs’ principle: Reduce, Reuse, Recycle, and Recover. Waste rock from development is minimised and used for backfilling old stopes, while tailings are treated and stored in designated facilities. Currently no waste rock is derived from underground mining. Low grade development ore hoisted to surface is stockpiled adjacent the shaft and sent to the process plant on an opportunistic basis. Metal waste is collected, stored, and recycled to recover value. Water is efficiently managed through recycling and treatment. Explosive waste is handled and disposed of safely, and general waste is segregated and disposed of in designated landfills. Human waste is collected and treated in on-site sewage treatment plants. This comprehensive approach ensures the sustainable management of underground waste at How Mine.
| 17.7.2 | Tailings disposal |
The active TSF Dam 5 is located approximately 2.5 km southeast of the processing plant, and has a footprint of 39 ha (Figure 17.2). Recent photographs of the TSF Dam 5 location from satellite imagery are provided in Figure 17.3. Approximately 10.8 Mt of tailings has been disposed into the TSF over a period of 25 years, after dam commissioning in 1998.
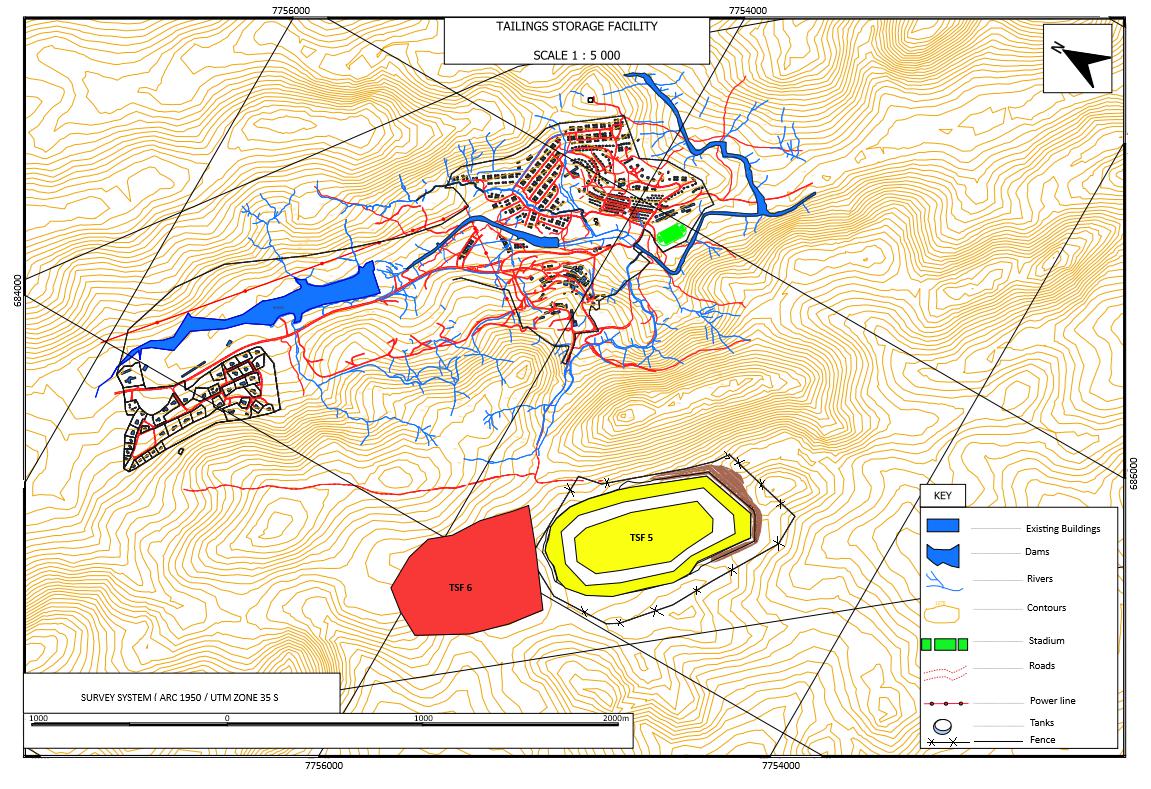
| Figure 17.2 | Site layout for TSF Dam 5 and proposed Dam 6 |
TSF Dam 5 was designed, constructed and operated by Fraser Alexander (Pty) Ltd (Fraser Alexander) until 2019, when operation and groundwater monitoring was taken over by HGM. It is constructed as an upstream paddock design (Figure 17.4) using tailings to construct the walls, a technique commonly applied in Africa.
With a footprint of 39 Ha, the dam is designed to carry 8.9 Mm3 of material, translating to 15 Mt at 1.68 t/m3 dry density. Dam 5 deposition as at December 2025 stood at 10.8 Mt. Remaining design capacity is 2.5 Mm3 volumetric capacity or 4.2 Mt. TSF Dam 5 is licensed on an annual basis, with monitoring on a quarterly basis.
The current available storage exceeds that of both the Mineral reserves only LOM plan and that of the current strategic LOM plan.
Namib has advised that a potential site, with a footprint of 63 Ha, has been identified for a new tailings storage facility, TSF 6, located just northwest of TSF Dam 5. Geotechnical testing is yet to be completed to inform dam designs.
| Project No PS229049 | WSP |
| How Mine | March 2026 |
| S-K 1300 Technical Report Summary | Page 119 |
| Namib Minerals |
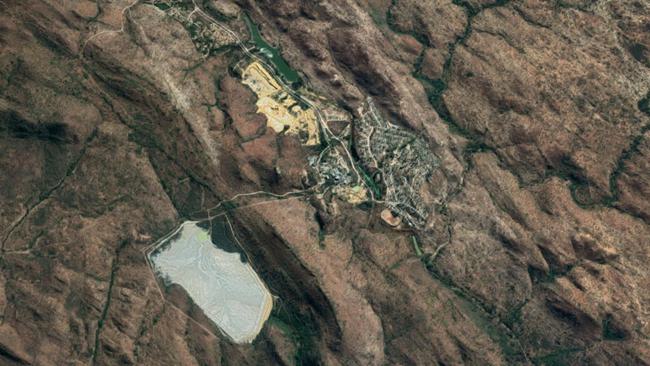
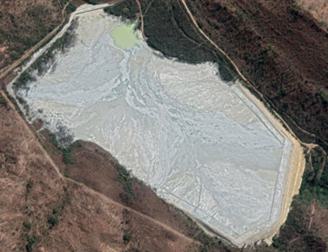 | 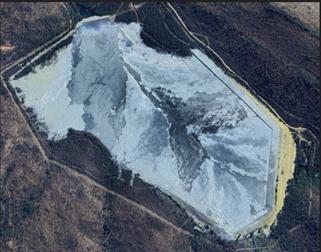 |
| Figure 17.3 | TSF Dam 5 location from satellite imagery |
| Project No PS229049 | WSP |
| How Mine | March 2026 |
| S-K 1300 Technical Report Summary | Page 120 |
| Namib Minerals |
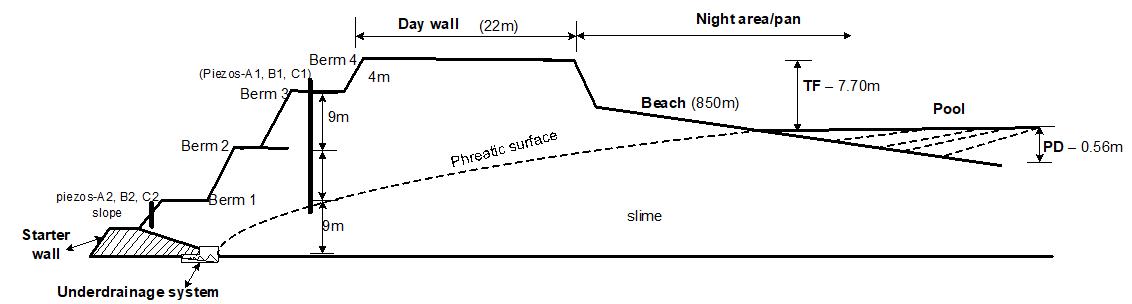
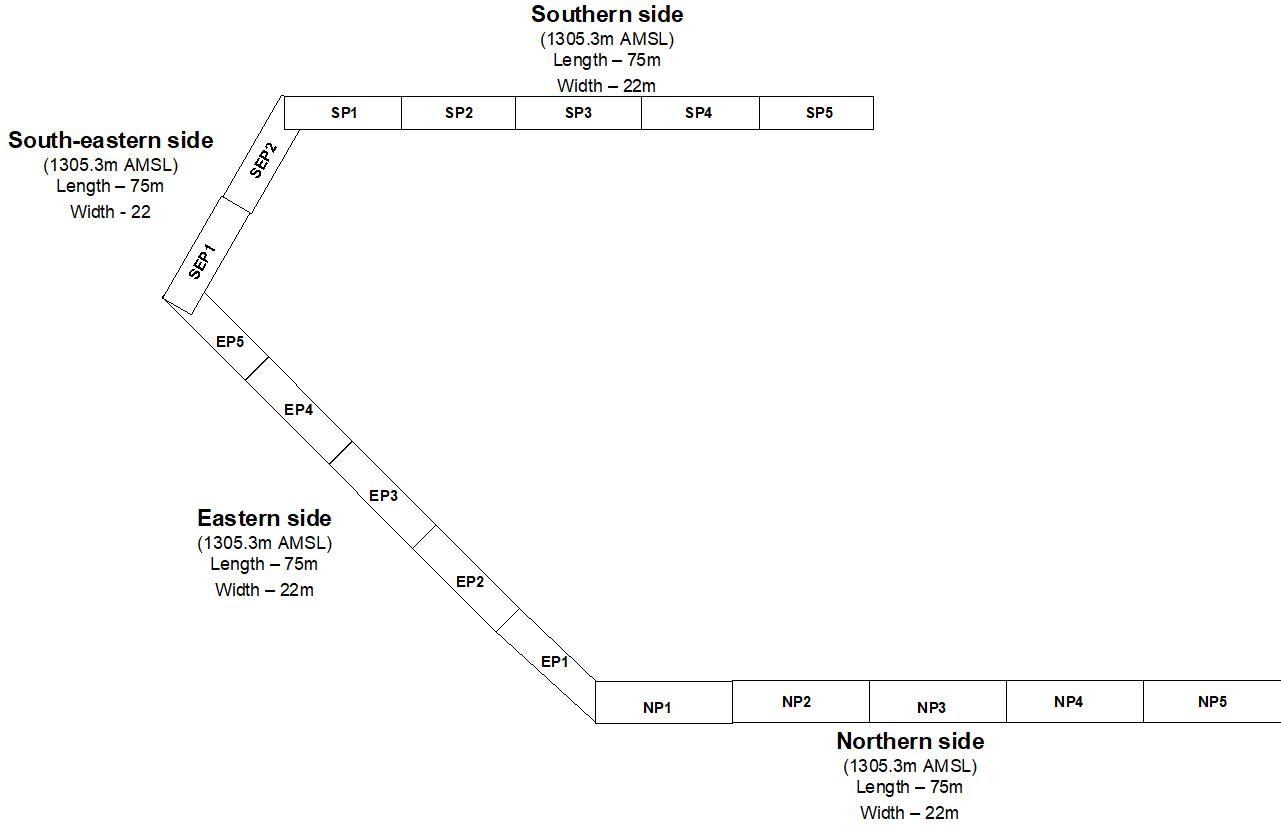
Figure 17.4 Tailings storage facility Dam 5 cross section and plan schematic of construction, December 2023
| 17.8 | Site monitoring |
BMC Zimbabwe undertakes the following site monitoring:
| — | Waste rock disposal. |
| — | Tailings: |
| — | Water inflows and outflows including water in tailings, precipitation, return water recycling, evaporation, seepage losses and interstitial water. |
| — | Dam freeboard monitoring. |
| — | Phreatic surface level monitoring via six piezometers installed on TSF Dam 5. |
| — | Underdrain flow and seepage monitoring. |
| — | General waste. |
| Project No PS229049 | WSP |
| How Mine | March 2026 |
| S-K 1300 Technical Report Summary | Page 121 |
| Namib Minerals |
| — | Sewerage effluent. |
| — | Atmospheric pollution and quality monitoring of all air emission points. |
| — | Water quality monitoring. |
| — | Blast design, implementation and monitoring for fly rock control (if required). |
| 17.9 | Water management |
The EMP covers provisions for water management in terms of pit and underground dewatering; pollution prevention; training and awareness; update of the site wide water balance and groundwater model using dewatering and water quality monitoring data; third party compensation for loss of water supply; monitoring of seepage quality by quarterly sampling of tailings, toe drains and return water dams; containment and emergency response procedures.
Water management also forms part of the mine closure planning detailed under Section 17.12. The mine closure plan covers provisions for modification and repair of site drainage and monitoring of surface water, groundwater, underground mine flooding, the site water balance and tailings dam.
| 17.10 | Stakeholder engagement |
| 17.10.1 | Stakeholder engagement plan |
Stakeholder engagement is conducted by BMC Zimbabwe to understand concerns and values regarding the mine. Key interactions with the environment were identified for consideration during operations and decommissioning. Socio-economic and cultural impacts were assessed through stakeholder consultation using various methods to ensure diverse representation. Anticipated population impacts were evaluated by discussing short and long-term effects with representatives from different stakeholder groups.
| 17.10.2 | Consultation |
Stakeholder consultation at the HGM aims to inform stakeholders about operations, impacts, and environmental plans while collecting their concerns. It assessed direct impacts on communities and sought stakeholders’ perspectives on the mine’s effects. Generally, stakeholders supported the operations, with local leadership mainly concerned about employment opportunities for locals and requested assistance in promoting education for local children.
| 17.11 | Cultural, economic, and social conditions |
| 17.11.1 | Cultural heritage |
The cultural landscape at the HGM reflects its historical roots, dating back to pre-independence Zimbabwe, with workers migrating from neighbouring countries. This has led to a mix of nationalities, each with distinct cultural practices. To manage diversity and prevent conflicts, the mine has appointed chiefs in its eight villages. These nationalities further divide into tribal and ethnic groups, including Tonga, Kalanga, Ndebele, Nyanja, Chewa, and Zezuru, each with unique beliefs. There is also diversity in Christian denominations and African Independent Apostolic churches, contributing to the HGM’s social and ethical dynamics.
| Project No PS229049 | WSP |
| How Mine | March 2026 |
| S-K 1300 Technical Report Summary | Page 122 |
| Namib Minerals |
| 17.11.2 | Contributing to the national and local economy |
The initiative also aims to increase employment opportunities and process more minerals to benefit the nation. Zimbabwe has outlined a series of short- and medium-term plans aimed at restoring and enhancing capacities for sustainable socio-economic growth. Therefore, the HGM aims to foster economic transformation within the country. It will contribute to socio-economic development at both local and national levels by improving infrastructure.
| 17.11.3 | Establishing a social management framework |
BMC Zimbabwe recognises its responsibility to the community and actively engages in Corporate Social Responsibility (CSR) initiatives to address local challenges. Current initiatives include the Manager’s Fund, supporting underprivileged school children with tuition fees; providing primary healthcare services to community members, treating 1,500 to 1,900 patients monthly; offering medical support such as Antiretrovirals (ARV’s) to HIV-positive employees and their families; and facilitating transport for children from nearby communities to the HGM Primary and Secondary Schools, easing their daily commute of up to 15 km each way.
| 17.11.4 | Stakeholder engagement |
BMC aims to maintain and update the stakeholder register, including stakeholders’ needs and expectations, and to ensure that all relevant stakeholder groups are consulted.
The mine’s Management of Interested Parties procedure (BEMS-SP-02) ensures the identification, understanding, and fulfilment of stakeholder requirements. Regular engagement with stakeholders, through various channels including physical meetings and virtual communication, enables the mine to establish plans, negotiate agreements, and address concerns to the satisfaction of all parties involved. This proactive approach strengthens relationships with local communities, regulatory bodies, and other interested parties, fostering a positive and collaborative environment.
| 17.11.5 | Impacts on land use and access |
The Property area is characterised by veldt natural vegetation covering gently undulating hills and slopes, with various mixed woodland species present. Despite historical mining and forestry activities dating back to the 1940s, the natural vegetation remains largely undisturbed. However, there are invader plants like Eucalyptus alongside indigenous species in the area.
| 17.11.6 | Protecting community health and safety |
The Public Health Act regulates activities affecting public health, granting powers to health officials and local authorities. Section 82 prohibits activities causing nuisances or health risks, with local authorities responsible for cleanliness and nuisance prevention. Notices are issued to remedy identified nuisances, with fines imposed for non-compliance per Section 87(3). To maintain standards and enhance waste management in workers’ houses, measures should be taken to reduce disease transmission.
| 17.11.7 | Protecting the workforce |
HGM complies with the relevant Zimbabwean legislation as a minimum.
| 17.11.8 | Commitment to local procurement and hiring |
| 17.11.8.1 | Procurement |
BMC policy is that the procurement of all products and services shall be based on competitive bidding. The competitive procurement process is designed to foster an impartial and comprehensive evaluation of multiple quotes, bids or proposals, leading to the selection of the most responsible supplier who can provide the best value to the business. This procurement method also eliminates corrupt and unethical practices, or the appearance of such, in our procurement and contracting processes.
| Project No PS229049 | WSP |
| How Mine | March 2026 |
| S-K 1300 Technical Report Summary | Page 123 |
| Namib Minerals |
Furthermore, it is BMC’s policy to use, whenever possible and practical, local suppliers or contractors that are able to provide products and services of required quality on a timely basis at competitive prices. The benefits of sourcing locally include:
| — | Promoting the use of local suppliers demonstrates BMC’s investment in the local community |
| — | Close proximity makes it far easier to travel to our suppliers for supplier development and contract management purposes, as well as for site inspections |
| — | The local knowledge of local suppliers means that they are well-placed to appreciate and satisfy local preferences – this is particularly relevant where specialized products and services are concerned |
| — | Supply chains are generally shorter, leading to greater certainty and predictability of delivery times. An associated benefit is that logistics costs (e.g. freight, insurance, duty, etc.) are reduced. |
| — | BMC take pride in local suppliers and reserved certain products to local suppliers, including chemicals, explosives, bolts and nuts, timber products, steel balls, fuel, protective equipment (clothing), security services, contract drilling services, power installations, and fencing services. |
Future plans in support of local procurement include:
| — | Identifying local suppliers from less privileged communities, understanding their challenges and providing support such as machinery to facilitate production |
| — | Preference locally produced products and assist with quality production through technology |
| — | Introducing a quarter system in the budget whereby a certain proportion of procurement expenditure is allocated to the local supplier. |
| 17.11.8.2 | Hiring |
The Zimbabwean Labour Relations Act (Chapter 28:01) Revised Edition 1996 Act is set to, among other things, declare and define the fundamental rights of employees; to define unfair labour practices; to regulate conditions of employment and other related matters; to provide for the control of wages and salaries; to provide for the appointment and functions of workers committees; to regulate the negotiation, scope and enforcement of collective bargaining agreements. It also provides for protection of both the employees and employers. The act provides for recruitment to be conducted without discrimination on grounds of race, tribe, and place of origin, political opinion, colour, creed, gender, pregnancy, HIV/AIDS status or any disability. The mine has an operational works council that negotiates wages on behalf of all stakeholders. The HGM has also managed to mainstream HIV and AIDS in the workplace.
HGM aims to give employment opportunities to local people where appropriate. This covers the following commitments:
| — | Contractors will be required to provide skills training and development of the contractor workforce. Contractors will be required to employ local people where appropriate make use of local goods and services where possible and appropriate. |
| — | Conduct a skills assessment in local communities and receive curricula vitae from local communities on a regular basis using an external employment agent. |
| — | Implement formal training policy and programs that aim to improve skills. Programs should be available for all directly and indirectly employed personnel. |
| — | Conduct a skills assessment of all unskilled and semi-skilled employees and design a portable skills training program for the mine’s employees. Portable skills refer to useful economic skills that an employee could use to augment their livelihoods. Typical training courses are basic fitting and turning, vehicle mechanical work, electricity, plumbing, and many other appropriate income-generating skills. |
| Project No PS229049 | WSP |
| How Mine | March 2026 |
| S-K 1300 Technical Report Summary | Page 124 |
| Namib Minerals |
BMC’s ‘BEMS H-R-P-04 Recruitment and Selection Policy and Procedure’ outlines how BMC will strive to resource the mines with the best talent available on the market. This is done in a manner that also recognises and prioritises locals already living within and around the mining operations.
Recruitment and Selection of members of local community is based on the need to ensure this category of individuals is fairly represented and not excluded from operations of the company. This also ensures that the company directly participates in community development by availing career opportunities to members of local communities and at the same time indirectly addressing other community development issues by helping to deal with poverty.
Our local recruitment is driven by a recognition of the need and commitment to utilise local resources and talents already at our disposal, thus benefiting the local communities which are most impacted by our activities.
| 17.12 | Mine closure |
Zimbabwe’s mining sector is governed by key legislation, including the Mines and Minerals Act, the Minerals Corporation of Zimbabwe Act [Chapter 21:04], and the Environmental Management Act. These laws require mining operations to prioritize rehabilitation and restoration of mined land to its pre-mining state.
To ensure responsible mine closure and minimise community impacts, BMC has developed a comprehensive Mine Closure Plan for the How Mine. This plan outlines BMC’s strategies for:
| — | Decommissioning operational infrastructure |
| — | Rehabilitating the environment |
| — | Releasing the area for future use. |
In compliance with regulatory requirements, the Mine Closure Plan is reviewed and updated every decade. The latest plan was developed in 2025, demonstrating BMC’s commitment to sustainable mining practices and community well-being, please refer to 18.1.2.
The mine closure plan, including remediation and reclamation plans, have recently been updated by Enmin in June 2024, including a detailed outline of closure requirements and costs.
The plan envisages that at the conclusion of mining and processing, the land will be rehabilitated. A mine closure plan has been developed that contemplates site closure that will restore the land to its best future use. Closure planning is an iterative process, and ongoing technical studies as well as consultation with local stakeholders will feed into future refinements of the current closure concepts, prepared on a regular basis by BMC Zimbabwe’s selected external consultant. The implementation and success of the plan will be monitored until the site achieves an environmentally and socially acceptable and sustainable state.
The conceptual mine closure plan indicates that closure will be required after approximately 3 years of mining the remaining Mineral Reserve, although this may extend if additional Mineral Resources are converted to Mineral Reserves as part of an annual update. Studies are ongoing to determine the potential for further extraction. On exhaustion of Mineral Reserves, the underground mine will be closed and the ore handling and processing facilities will be decommissioned. This will entail dismantling, demolition and removal of equipment and buildings, reshaping and re contouring of land surfaces and rehabilitation of occupied areas. Dewatering of the underground mine will cease upon completion of mining and allowed to fill with water. As far as practicable, the land occupied by the mine and its infrastructure will be returned to its former land use. The mine, plant area and waste emplacements and other works will be made safe for the community including the placement of barriers to discourage people from entering the mined-out workings. A public education program on safety issues associated with the mine and any excavated areas will be conducted. A passive water management system will be implemented so that adequate protection for surrounding water resources can be provided without ongoing active management by BMC Zimbabwe.
| Project No PS229049 | WSP |
| How Mine | March 2026 |
| S-K 1300 Technical Report Summary | Page 125 |
| Namib Minerals |
The closure phase will also require the management of social issues including retrenchment of the workforce and managing the implications of loss of local employment and business. To mitigate the social impacts commonly associated with mine closure, the Mine Closure Plan includes components related to social and community impacts. The plan will be developed in consultation with relevant authorities, the workforce, and local communities.
| 17.13 | Translating the ESIA into environmental and social management |
After conduction of ESIA the Mine develops Environmental plans CSR plans to implement commitments, requirements and request made by stakeholders during public consultations. Check 2025 EMP and CSR plans for 2025.
| 17.14 | QP’s opinion |
| 17.14.1 | Legal |
Namib Minerals has advised that it does not have any outstanding legal issues that would affect the capacity to estimate a Mineral Reserve.
| 17.14.2 | Social and environment |
Namib Minerals has advised that there are no social or environmental issues that pose a risk to the operation and that all necessary permits are in place. However, WSP recommends a more detailed audit of TSF capacity over the LOM, compliance monitoring, community and environmental management plans, costs, and liabilities on an ongoing basis. Community and environment issues often require sustained management focus in these jurisdictions.
| 18 | Capital and operating costs |
Capital and operating cost estimates have been prepared by HGM to generate a 4-year Mineral Reserves only plan, plus 1 year for mine closure. WSP has analysed historical physical quantities, operating and capital costs of operation over the past 3 years 2023 – Q1 2026, and estimated an additional 5% contingency which has been applied to all operating and capital costs. Mine closure independently includes a contingency of 15.0%.
| Project No PS229049 | WSP |
| How Mine | March 2026 |
| S-K 1300 Technical Report Summary | Page 126 |
| Namib Minerals |
Capital costs total US$30.0 M comprising sustaining capital of US$27.6 M, growth capital of US$2.4. M (only in CY2025 for underground and process plant production upgrades. Growth capital of US$2.4 M is incurred only in 2025 for underground Mineral Reserve block access and process plant production upgrades. A mine closure cost estimate of US$8.1 M (assuming a planned closure scenario) has been updated December 2025 in a review undertaken by Enmin Consulting (Private) Limited (Enmin).
Operating costs total US$123.5 M (averaging US$77.12/t processed) comprising direct operating C1 costs of US$108.5 M (US$67.81/t processed) and fixed overheads US$14.9 M (US$9.33/t processed).
Given the historical track record of operation of the HGM, and a 5% contingency allowance for both operating and capital costs, WSP views the cost estimates comply with the level of accuracy required by § 229.1302 (Item 1302 of Regulation S–K). The capital and operating cost estimate accuracy is assessed at +15% while a 5% contingency allowance on all costs is consistent with recent historical variability as a provision for any additional, unforeseen costs associated with unanticipated geologic circumstances, engineering conditions and unanticipated geopolitical conditions.
| 18.1 | Capital costs |
Capital costs for growth, sustaining and mine closure are detailed under this Section. Capital costs prepared for the Mineral Reserves LOM plan are provided in Table 18.1. The sustaining and growth capital costs have been adjusted to reflect the tonnage proportion of Mineral Reserves by year in the HGM strategic LOM plan, which includes MII resource inventory material. Mine closure costs have not been adjusted for the proportion of Mineral Reserves tonnage but have been assumed as estimated by Enmin, an external consultant specialising in this area.
A contingency allowance of +5% has been applied for growth and sustaining capital while a contingency of 15.0% has been applied for mine closure capital costs.
| 18.1.1 | Growth and sustaining capital |
Growth and sustaining capital costs for the project over the estimated 4-year LOM are provided in Table 18.1. Capital upgrades mainly relate to projects associated with increasing mine production and plant throughput from 40 ktpm to 55 ktpm:
| — | 10–20 MVA transformer upgrade. |
| — | Underground 33 Level loading station and conveyor. |
| — | CIP tank refurbishment. |
| — | Crushing plant upgrades. |
| — | North shaft conveyor from shaft to ROM feed. |
| — | North shaft winder upgrades. |
| Project No PS229049 | WSP |
| How Mine | March 2026 |
| S-K 1300 Technical Report Summary | Page 127 |
| Namib Minerals |
Table 18-1 Mineral Reserves summary capital expenditure for FY 2026-2029
| LOM Capital Costs US$’000 | |||||
| Category | 2026 | 2027 | 2028 | 2029 | Total |
| Underground Plant & Equipment | 3,437 | 618 | 965 | 1,282 | 6,302 |
| Surface Plant & Equipment | 2,807 | 461 | 82 | 494 | 3,844 |
| Other Surface Costs | 4,829 | 10 | 97 | - | 4,936 |
| Housing & Amenities | 1,032 | 1,315 | 1,315 | 1,315 | 4,976 |
| Furniture & Fittings | 306 | 145 | - | 145 | 597 |
| Insurance Spares | 537 | 704 | 475 | 662 | 2,378 |
| Vehicles | 1,038 | 90 | 336 | 90 | 1,554 |
| Projects and Exploration | 3,586 | 3,130 | 3,380 | 2,661 | 12,757 |
| Subtotal Sustaining Capex | 17,574 | 6,472 | 6,649 | 6,649 | 37,344 |
| Subtotal Growth Capex | - | - | - | - | |
| Contingency +5% | - | - | - | - | - |
| Mine Closure +12.63% contingency | - | - | - | - | |
| GRAND TOTAL | 17,574 | 6,472 | 6,649 | 6,649 | 37,344 |
Source: BMC Financial Model Reserves Feb 2026 20260226
| 18.1.2 | Mine closure costs |
Mine and social closure costs have recently been updated in December 2025 by Enmin. These costs comprise allowances for environmental rehabilitation, social closure, and equipment salvage. The total cost is estimated at US$8.1 M assuming a Planned Closure scenario in accordance with the LOM plan, inclusive of a 15% contingency (Table 18.2), while this increases to US$16.0 M assuming an Unplanned closure scenario. Equipment Salvage cost will only be considered in Unplanned Closure as this cost forms a part of BMC’s operational cost. Social closures costs will only be borne during unplanned closure of the mine. For planned closure, the HGM will have the opportunity to give sufficient notice to its employees on the closure of the HGM, thus avoiding this additional cost. The Planned Closure cost estimate is adopted for cashflow model evaluation.
Table 18-2 HGM present closure obligation (Enmin 2025)
| Item No. | Activity | Cost (US$) | |
| Planned Closure | Unplanned Closure | ||
| 1 | Environmental Liability | 6,656,256 | 6,324,738 |
| 2 | Social Liability | 6,779,300 | |
| 3 | Equipment Salvage | 272,759 | |
| Sub-total | 6,365,468 | 13,376,797 | |
| Operation & Maintenance Costs @6% of Total Closure Cost | 459,281 | 802,608 | |
| Contingency 15% | 998,438 | 1,791,535 | |
| Total Mine Closure Costs | 8,113,976 | 15,970,940 | |
| 18.2 | Operating costs |
Inspection of the breakdown of annual production and cost performance over the past three years (CY2023-CY2025), indicates that operating unit costs have averaged US$80.67/t. BMC Zimbabwe forecast to achieve a reduction in operating costs by 13% to US$72/t as a function of the capital upgrade program to increase throughput from 40 ktpm to 55 ktpm, plus additional business improvement initiatives relating to power and water supply. This is judged as achievable with Q1 2025 costs averaging $79.18/t and a 55%/45% fixed/variable cost analysis confirming the potential cost reduction to these levels.
| Project No PS229049 | WSP |
| How Mine | March 2026 |
| S-K 1300 Technical Report Summary | Page 128 |
| Namib Minerals |
Operating costs have been prepared based on a 4-year Mineral Reserves only schedule assuming unit operating costs that compare well with actual costs from CY2023–CY2025. Operating costs total US$123.5 M (averaging US$77.12/t processed) comprising direct operating C1 costs of US$108.5 M (US$67.81/t processed) and fixed overheads US$14.9 M (US$9.33/t processed).
Direct operating costs cover mining and processing functions. Fixed overheads cover the cost of rehabilitation, non-production power, environment, administration costs (Zimbabwe and UK), employee welfare, sale of scrap, exchange gains/losses, and intercompany balances written off. Exploration costs are generally covered under capital but excluded here for assessment of a Mineral Reserves only LOM plan.
Table 18-3 HGM Mineral Reserves LOM OPEX
| HGM Forecast | ||||||
| Year | Unit | Total | 2026 | 2027 | 2028 | 2029 |
| Ore Milled | kt | 1,601 | 286 | 497 | 505 | 313 |
| Head Grade | g/t | 1.50 | 1.54 | 1.35 | 1.72 | 1.32 |
| Recovery | % | 89 | 89 | 89 | 89 | 89 |
| Au Production | koz | 69 | 13 | 19 | 25 | 12 |
| KPIs | ||||||
| Operating Costs (C1) | US$/tonne | 86 | 71 | 71 | 70 | |
| US$/oz | 2,112 | 2,002 | 1,611 | 2,002 | ||
| AISC | US$/t | 3,031 | 2,520 | 2,019 | 2,854 | |
Source: BMC Financial Model Reserves Feb 2026 20260226
Notes: Operating C1 costs are inclusive of operating costs, royalties, and realisation costs. Fixed overheads averaging US$3.73M per annum or US$9.33/t are excluded. All-In-Sustaining-Costs (AISC) are C1 Costs plus fixed overheads and sustaining capital.
| 18.3 | Contingency |
A 5% contingency allowance for both capital and operating costs has been applied based on a review of costs over the past 3 years CY2023 through to Q1 2026 including strong consideration for the mine being a well-established operation. This estimate has also been applied historically.
Please note that the total capital spend has traditionally been below budget over the past 3 years.
Accordingly, the assumption of a +5% contingency for operating costs is considered conservative and appropriate.
| Project No PS229049 | WSP |
| How Mine | March 2026 |
| S-K 1300 Technical Report Summary | Page 129 |
| Namib Minerals |
| 19 | Economic analysis |
| 19.1 | Summary |
WSP has adopted a conservative approach considering a cashflow model based on a Mineral Reserves only inventory, 1.6Mt at 1.50g/t Au for 77koz gold production (69 koz after the 89.0% metallurgical recovery is applied), scheduled for mining and processing over 4 years at a metallurgical recovery rate of 89%. WSP considered HGM’s operating cost and capital requirements at a cost centre level, and applied 5% contingency to all costs. Mine closure costs have been assumed at US$8.1M in Year 4.
A further 892 kt at 0.89 g/t Au of Probable Reserve in a surface sands (tailings) stockpile has not been incorporated to the cashflow model as it would displace higher grade underground ore. This remains as upside if processed at the conclusion of underground mining.
The economic viability of the sands mining has been included by cut-off grade and pay limit calculations that adopt a mining and processing cost of US$20.54/t, a gold price of US$3,272/oz (US$3,600/oz for the Mineral Resource estimate) and process recovery of 50% (a 0.46 g/t fixed tail). Under these circumstances, a cut-off grade/pay limit has been estimated at 0.66 g/t, below the average Sands Mineral Reserve grade of 0.89 g/t.
| 19.2 | Methodology |
| 19.2.1 | Modelling approach |
| — | HGM uses statistical analysis and economic modelling for the assumptions adopted by the QP in the Mineral Reserves LOM Forecast. |
| — | An after-tax cash flow modelling approach has been adopted that considers direct operating (mining, processing, administration, corporate administration, royalty, refining), capital (sustaining, growth, mine closure), net revenue (inclusive of 5% royalties and realisation costs), depreciation, finance (loan, working capital), investing, dividend and tax costs. Exploration costs are excluded as these activities are not required for the defined Mineral Reserve base. |
| — | Loan and financing costs are excluded, given strong positive cashflows. An annual dividend allowance has been excluded as this will be allocated out of positive discounted cashflow. |
| — | Zimbabwean corporate tax is applied at the rate of 25.75% with allowance for capital depreciation over the 3-year active mine life. |
| — | A gold price of US$3,272/oz is applied based on the average of the trailing 2-year average gold price to end December 2025 and the forecast CY 2026 gold price. |
| — | Royalties are levied at the rate of 5% for a price of gold revenue for a price up to $5,000/oz and 10% above $5,000/oz. |
| — | Realisation costs to cover dore transport and refining is included at the rate of US$0.65/oz. Sale of gold to the Fidelity refiner is mandated by government and revenue received is based on spot pricing, with 70% paid in local currency and 30% paid in ZiG local currency. No discount to account for local currency risks has been applied as these risks are judged to be mitigated for the following reasons: |
| — | The assumed US$3,272/oz gold price is a discount of 2% to the spot pricing levels US$3,322/oz (end December 2025). |
| — | Forecast gold prices are expected to improve (Trading Economics, AXI). |
| Project No PS229049 | WSP |
| How Mine | March 2026 |
| S-K 1300 Technical Report Summary | Page 130 |
| Namib Minerals |
| 19.2.2 | Sources of assumptions |
Cashflow model assumptions are detailed in Table 19.1 and drawn from BMC and industry sources, reviewed and utilised by WSP.
Table 19-1 HGM Mineral Reserve cashflow modelling assumptions
| Parameter | Unit | Total | Source |
| Gold conversion factor | gm to oz | 31.10348 | Standard |
| Metallurgical gold recovery | % | 89.0% | 3-year trailing average |
| USD denominated sales | % | 70% | Zimbabwean Government |
| Royalties | % | 5% (≤ US$5000/oz), 10% (> US$5000/oz). | Zimbabwean Government |
| Realisation (FP&R) | US$ per oz | 0.65 | HGM per Fidelity |
| Cost/t – ROM | US$ per tonne | 77.12 | Average Mineral Reserves LOM estimate |
| Average Overhead cost/annum | US$’000 | 3,338 | WSP from 2025 HGM actuals |
| Corporate income tax | % | 25.75 | HGM |
| Fixed asset depreciation | LOM yrs | 3 | HGM |
| Cost of capital (Discount Rate) | % | 19 | HGM |
| Loan compound interest rate | % | 13 | HGM |
| Loan amount | US$’000 | 3 863 | HGM |
| Loan tenure | Yrs | 3 | HGM |
| Gold price | US$ / oz | 3,272 | As detailed above. Note US$3.332/oz as at end December 2025 |
Source: BMC Financial Model Reserves Feb 2026 20260226
| 19.2.3 | Financial |
Financial details for HGM are presented in Table 19.1. No loan is required as capital can be funded out of positive cashflows.
| 19.2.4 | Pricing and revenue |
Pricing and Revenue used for any computation regarding the project has been addressed in Table 19.1 and detailed in Section 18.
Metal prices adopted for the LOM have been reviewed and aligned to an average of the 2-year trailing average price and the CY2026 forecast estimate for gold as at end December 2025, the reporting date for the Mineral Reserve. A gold price of US$3,272/oz is assumed for the LOM. The net price received has been adjusted in line with the current (RTGS) split of 70/30%. Gold proceeds are paid 70% in USD and 30% in local currency with effect from February 2025 (previously 75% USD and 25% in local currency). Sale of gold under these terms has been mandated by the Zimbabwean Government since the start of 2020.
| Project No PS229049 | WSP |
| How Mine | March 2026 |
| S-K 1300 Technical Report Summary | Page 131 |
| Namib Minerals |
| 19.2.5 | Taxes and royalties |
Government royalties are paid at the rate of 5% (≤ US$5000/oz), 10% (> US$5000/oz) on gross gold revenue.
Realisation costs in terms of refining by Fidelity are paid at the rate of US$0.65/oz. Transport costs are covered separately under Fixed Overhead Indirect costs.
Zimbabwean corporate tax is levied at the rate of 25.75% with allowance for depreciation over the LOM.
| 19.0 | Capital costs |
Capital costs prepared by HGM are detailed in Section 18.1 of this report. An additional 5% contingency has been applied to all capital costs including sustaining and growth capital. A 15.0% contingency has been separately applied for mine closure costs. Growth and sustaining capital cost allocations have been adjusted from the LOMP for the Mineral Reserve Only LOMP. Mine closure capital costs have been assumed at US$8.1M based on an external expert consultant, Enmin (June 2025).
| 19.1 | Operating costs |
WSP utilised the recent (CY2025) operating cost average of US$79.18 for its initial cut-off calculations.
These cut-offs were used to determine the final optimised HGM Mineral Reserve CY2025. The final Mineral Reserve mining schedule was then used to complete the required LOM economic analysis.
The LOM economic analysis calculates discrete, and total, operating costs on a monthly basis for the LOM which differs month to month from the initial estimate used in the cut-off calculations. This is part of the mine planning process and accepted industry practice.
Operating costs prepared by HGM are detailed in Section 18.2 of this report.
| 19.2 | Cash flow |
WSP has prepared a cashflow evaluation to test the economic viability of mining and processing only the Proved and Probable Mineral Reserves as presented in Table 19.2 and the sensitivity graphs in Figure 19.1. This scenario assumes:
| — | A discount rate of 19%. |
| — | Mining and processing representing the scheduled, extractable Mineral Reserve base. |
| — | 4 year mine plan, and 1 year for mine closure. |
| — | Updated mine closure cost estimate of US$8.1 M based on a planned closure scenario and scheduled in the year following completion of processing. These costs have not been discounted for inventory scale. |
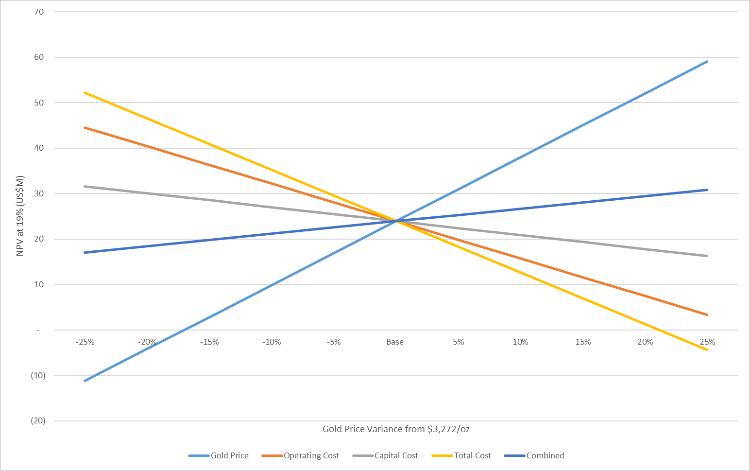 | 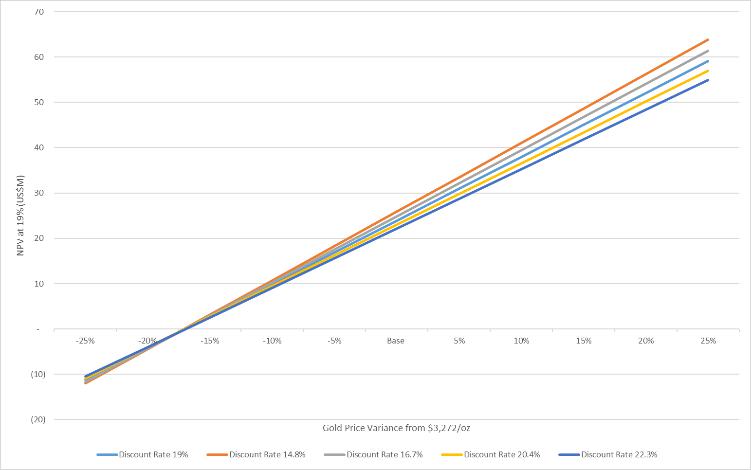 |
| Figure 19.1 | Mineral Reserves only project NPV and sensitivity analysis |
| Project No PS229049 | WSP |
| How Mine | March 2026 |
| S-K 1300 Technical Report Summary | Page 132 |
| Namib Minerals |
Table 19-2 HGM cashflow analysis prior to depreciation, financing, and tax – Mineral Reserves (Proved and Probable only)
| Year | Unit | Total | 2026 | 2027 | 2028 | 2029 |
| Income statement | ||||||
| Revenue USD | [US$ ’000] | 154,953 | 40,710 | 61,979 | 80,421 | 38,251 |
| Revenue ZWG | [US$ ’000] | 66,408 | 12,213 | 18,594 | 24,126 | 11,475 |
| Gross revenue | [US$ ’000] | 221,361 | 40,710 | 61,979 | 80,421 | 38,251 |
| Royalties | [US$ ’000] | -11,068 | -2,036 | -3,099 | -4,021 | -1,913 |
| Realisation | [US$ ’000] | -86 | -16 | -24 | -31 | -15 |
| Net revenue | [US$ ’000] | 210,207 | 38,659 | 58,856 | 76,369 | 36,324 |
| C1 costs | [US$ ’000] | -117,670 | -24,564 | -35,275 | -36,054 | -21,778 |
| Overheads | [US$ ’000] | -13,935 | -3,538 | -3,472 | -3,487 | -3,438 |
| EBITDA | [US$ ’000] | 78,602 | 10,557 | 20,109 | 36,828 | 11,108 |
| Depreciation | [US$ ’000] | -57,097 | -11,305 | -12,985 | -14,258 | -18,549 |
| EBIT | [US$ ’000] | 21,505 | -748 | 7,123 | 22,571 | -7,441 |
| Finance costs | [US$ ’000] | -2,356 | -1,053 | -720 | -301 | -282 |
| PBT | [US$ ’000] | 19,149 | -1,802 | 6,403 | 22,270 | -7,441 |
| Corporate income tax | [US$ ’000] | -8,709 | -2.393 | -1,664 | -5,882 | 1,230 |
| Net income | [US$ ’000] | 10,440 | -4,194 | 4,739 | 16,388 | -6,493 |
| Cash flow statement | ||||||
| EBITDA | [US$ ’000] | 78,602 | 10,557 | 20,109 | 36,828 | 11,108 |
| Corporate income tax | [US$ ’000] | -16,651 | -2,460 | -4,303 | -7,948 | -1,941 |
| Working capital | [US$ ’000] | 21,159 | 14,278 | -3,651 | 8,219 | 2,313 |
| Operating cash flow | [US$ ’000] | 83,109 | 22,375 | 12,155 | 37,099 | 11,480 |
| Sustaining capex | [US$ ’000] | -27,801 | -8,031 | -6,472 | -6,649 | -6,649 |
| Growth capex | [US$ ’000] | -17,302 | -9,543 | 0 | 0 | 0 |
| Mine Closure | [US$ ’000] | 0 | 0 | 0 | 0 | -8,114 |
| Investing cash flow | [US$ ’000] | -45,103 | -17,574 | -6,472 | -6,649 | -14,743 |
| Loan drawdown | [US$ ’000] | 1,500 | 0 | 0 | 0 | 0 |
| Finance costs | [US$ ’000] | -1,228 | -772 | -438 | -19 | 0 |
| Loan repays | [US$ ’000] | -4,631 | -2,055 | -2,397 | -179 | 0 |
| Dividends paid | [US$ ’000] | -66,500 | -9,600 | -9,600 | -31,300 | -16,000 |
| Financing cash flow | [US$ ’000] | -70,859 | -10,927 | -12,435 | -31,498 | -16,000 |
| Opening cash | [US$ ’000] | 765 | 5,567 | 11,250 | 41,699 | |
| Project No PS229049 | WSP |
| How Mine | March 2026 |
| S-K 1300 Technical Report Summary | Page 133 |
| Namib Minerals |
| Year | Unit | Total | 2026 | 2027 | 2028 | 2029 |
| Free cash flow | [US$ ’000] | 4,802 | 5,683 | 30,450 | -3,263 | |
| Closing cash | [US$ ’000] | 5,567 | 11,250 | 41,699 | 38,436 | |
| DCF valuation | ||||||
| Undiscounted cash flow | [US$ ’000] | 1,200 | 4,802 | 5,683 | 30,450 | -3,263 |
| Period | [-] | 1 | 2 | 3 | 4 | |
| Discount factor | [-] | 1.19 | 1.41 | 1.67 | 1.98 | |
| Discounted cash flow | [US$ ’000] | 24 886 | 4,050 | 4,043 | 18,274 | -1,482 |
| UDCF (active) | 38 006 | 4,802 | 5,683 | 30,450 | -3,263 | |
| KPIs | ||||||
| Operating costs (C1) | [US$ / tonne] | 74 | 86 | 71 | 71 | 70 |
| [US$ / oz] | 1 932 | 2,112 | 2,002 | 1,611 | 2.002 | |
| AISC | [US$ / tonne] | 2 606 | 3,031 | 2,520 | 2,019 | 2,854 |
| Spot Price | $/OZ | 3,272 | 3,272 | 3,272 | 3,272 | 3,272 |
| 19.3 | Economic evaluation and sensitivity analysis |
Key outcomes of the cashflow evaluation and sensitivity analysis on an after-tax basis, considering Mineral Reserves only are:
| — | A positive project NPV of US$22.1 M when Mineral Reserves only (PP) are considered over a 4-year LOM. |
| — | The project value is most sensitive to operating costs then gold price, but relatively less sensitive to capital cost. |
| — | The project value is relatively less sensitive to discount rate over a 11% – 20% range and gold price range from -25% (US$2,454/oz) and +25% (US$4,090/oz). |
| — | Project breakeven for the Mineral Reserve inventory is a 24% fall in gold price (US$2,640/oz) or a 37% increase in total cost. |
| — | On this basis, the economic analysis is judged sufficiently robust to provide breakeven economics within a +10% level of accuracy and <15% contingency. |
| Project No PS229049 | WSP |
| How Mine | March 2026 |
| S-K 1300 Technical Report Summary | Page 134 |
| Namib Minerals |
| 20 | Adjacent properties |
There are no other significant mining operations in the immediate vicinity of the HGM, though several small, narrow reef historical mine workings do exist within the HGM ML area.
All these historical workings are currently inactive but are considered targets for exploration.
No data or other information from these historical adjacent properties were used in the preparation of this TRS.
| 21 | Other relevant data and information |
WSP is not aware of any other relevant data or information other than that disclosed in this TRS, that materially affects the information included in this TRS and that all material assumptions and parameters underpinning Mineral Resources and Mineral Reserve estimates continue to apply and have not materially changed since the 2024 MRMR.
Please note that the MRMR utilises a new block model and an improved gold price.
| 22 | Interpretation and conclusions |
| 22.1 | Mineral Resources interpretations and conclusions |
| — | Based on the information presented in this TRS, the QP’s key conclusions are as follows: |
| — | The levels of understanding of the regional geology, local geology and the nature and controls on mineralisation are high, and provide a solid foundation for geological modelling, Mineral Resource estimation, and mining and exploration geology. |
| Project No PS229049 | WSP |
| How Mine | March 2026 |
| S-K 1300 Technical Report Summary | Page 135 |
| Namib Minerals |
| — | The drilling, sampling, assay and Quality Assurance Quality Control (QAQC) techniques used for both exploration and resource estimation are consistent with standard industry practice, and are considered appropriate for the purposes of geological modelling and Mineral Resource estimation. |
| — | The on-site assay laboratory is well-equipped, clean and maintained and is suitable for the work it is being utilised for. |
| — | The Mineral Resource estimate uses ordinary kriging which is considered appropriate for the mineralisation style. |
| — | Grade estimates were constrained to updated mineralisation wireframes during grade estimation and includes mineralisation with a lower cutoff of 0.36 g/t Au. |
| — | Quality Assurance Quality Control (QAQC) techniques used for both exploration and resource estimation are consistent with standard industry practice and are considered appropriate for the purposes of geological modelling and Mineral Resource estimation. |
| — | Estimates utilise all available samples, including channel, sludge and diamond drill core samples and incorporate level mapping where available. |
| — | Dry bulk density of 2.8 tonnes per cubic metre (t/m3) was assigned for all mineralised domains. |
| — | Statistical validation of the Mineral Resource estimate as well as visual validation has been completed and demonstrates a robust estimate which correlates well to the input data. |
| — | RPEE has been considered, and the parameters used are considered reasonable. The Mineral Resource estimate has been reported withing Mineable Stope Optimiser (MSO) shapes demonstrating reasonable prospects of economic extraction. |
| — | The Mineral Resource classification that has been applied is considered appropriate. |
| 22.2 | Mineral Reserves interpretations and conclusions |
The QP is satisfied with the basis for estimation and update of the CY2025 Mineral Reserves. The outlook for the Mineral Reserve and LOMP has improved on a number of fronts being:
| — | Completion of the shaft deepening to the 34L to allow access to target mining blocks and installation of a loading pocket. Further shaft deepening to the 36L is planned and possibly an extension to 38L with sufficient further work and justification. This opens the asset up to further LOMP improvements, and stoping optionality, which de-risks the annual mine plan. |
| — | Process plant capital upgrades and improvements are ongoing to provide improved plant reliability and performance. Based on recent successes WSP is confident these will be implemented successfully. |
| Project No PS229049 | WSP |
| How Mine | March 2026 |
| S-K 1300 Technical Report Summary | Page 136 |
| Namib Minerals |
| — | Increases to the Mineral Resource raises the possibility that further strategic analysis of the asset may improve conversion to a greater Mineral Reserve, including the ability to develop and include low grade mineralisation, resulting in an improved and increased LOMP. WSP recommends completing a strategic analysis for the asset as part of the mine planning improvements based on the developing use of modern mining software and mine planning practices. |
| — | Improvements to the gold price over the last 12 months has significantly strengthened the financial basis of the asset. Further increases to the gold price may further improve the Mineral Reserve and subsequent economic strength. WSP recommends developing a robust and externally reviewed, macro-economic forecast that will be a critical input into the recommended strategic analysis. |
| — | The mining methods are appropriate to the style and type of mineralisation and are based on a history of successful implementation. As mining extends at depth and ground stress fields increases, HGM has taken steps to measure the stress field and provide inhouse and external technical support to the mining method. WSP believes that modern mechanical methods of extraction and extraction practices should form part of any strategic analysis. |
| — | The surface sands Mineral Reserve estimate is appropriately based on a survey solid wireframe, resource model and pay limit estimate (0.89 g/t Au). The sands reserve is not currently included in the LOM plan since it would displace higher grade underground resource but remains as potential project upside at the conclusion of underground mining and processing. |
| — | The economic analysis for the Mineral Reserve showed that HGM is developing and improving their financial models allowing a greater understanding of cost drivers and the ability to discretely assess variable and fixed costs which is key to eventual costs reduction strategies and the ability for HGM to optimise the project. |
| — | Capital and operating costs for the operation are considered appropriate and compare well with historical benchmarks, contracts and quotations. No contingency allowance is included in HGM estimates but subsequently added at the rate of 5% by WSP. |
| — | The site visit undertaken in February 2026 showed a strong focus on safety and a respectable recent safety record. This is a strong positive for the asset as poor safety standards may cause significant production disruption, in addition to the health and safety effects on the workforce. |
| — | The ventilation system underground at HGM is adequate for the current annual extraction schedule. Although the mine is developing into deeper zones, relatively speaking, the number of active headings and the total extraction output remains steady for the forward Mineral Reserve plan. In the QP’s opinion the majority of underground mines have opportunity to improve ventilation network efficiency but the QP does not believe there is a risk to the Mineral Reserves mining plan due to the underground ventilation network. |
| — | WSP is aware of a large, failed section of the mine between 20L and 26L deemed the ‘accumulations’. During the site visit it was communicated to WSP that there may be a possibility of a 60% recovery of this material, but WSP believes further work is needed to verify the ability to extract this material safely and without significant dilution. This material has not been included in the Mineral Reserve at this time but is potentially an upside to the estimate. |
| Project No PS229049 | WSP |
| How Mine | March 2026 |
| S-K 1300 Technical Report Summary | Page 137 |
| Namib Minerals |
| 23 | Recommendations |
Based on the results presented in this TRS, and consistent with Namib’s (formerly BMC Limited’s) long standing operating practices, ongoing technical work will be performed on the Property as part of studies to improve confidence, decrease risk, and enable the conversion of Mineral Resources to Mineral Reserves.
The following items are recommended to sustain Mineral Resources and Mineral Reserves.
| 23.1 | Mineral Resources recommendations |
| — | Data and database management requires additional work to streamline the existing process and remove the current need for manual transcription of assay results and other data and to ensure built in validation of data is performed. It is recommended that HGM invest in a corporate database with inbuild validation routines and reporting functionality to assist with the large amount of geological information currently housed in excel spreadsheets. |
| — | Consider the creation of a lithology and a structural model to help guide the mineralisation modelling and assist in more robust domaining of the mineralisation. |
| — | Further bulk density testwork should be completed to ensure the values used in the Mineral Resource are appropriate and suitable for use across the deposit. It is recommended that BD values are reviewed by lithology and area of the mine to determine whether different values would be more appropriate. |
| — | Consider changing the down hole survey method currently used to a north seeking gyro tool to minimise the impact of magnetic material currently influencing the surveys at depth. |
| — | Include blank material with every laboratory submission to test the amount of contamination between samples through the sample preparation stages at the laboratory. |
| — | Undertaking core photography will provide a lasting record of drilling, particularly useful when mining historic areas where the core has already been disposed of. |
| — | Mineral Resource reconciliation practices should be reviewed, and a system implemented that provides a measure of the estimate’s performance. It is recommended that mined development and production be reconciled monthly, and stope close-out reports be developed for each completed stope. |
| 23.2 | Mineral Reserves recommendations |
| — | Design wireframes should be prepared for all Mineral Reserve blocks that appropriately account for design constraints in terms of resource mineralisation widths, stope widths, crown/sill/rib pillars and any geotechnical constraints particularly as the mining extends at depth. Integrated as-mined and design wireframe models should be prepared with all wireframes flagged to allow ease in reporting. Ore production from development should be monitored, recorded and reconciled on an ongoing basis. Broken ore stocks should be reconciled on a monthly basis, both for underground stopes and surface stockpiles. This will allow reconciliation of the variance between break, hoist and reconciled mill feed (weightometer). The gap observed between claim hoist and process feed should be identified. A complete review of the reconciliation process should be undertaken to confirm the gross level of dilution and ore loss, planned (via stope design), unplanned (operational) and actual. The manner of application of the MCF to grade alone should be reviewed in concert with the reconciliation review. Any remaining manually prepared or AutoCAD plans prepared for the Mineral Resources and Mineral Reserves should be converted to stope wireframe designs allow ease of interrogation and analysis using the consolidated resource model. Recovery factors should be applied to tonnage estimates, as per the WSP TRS work, to derive extractable reserves for all Mineral Reserve blocks. These extractable reserve tonnage and diluted grade estimates should be adopted in scheduling. Dam Sands process amenability should be reviewed with respect to potential for impurities, deleterious elements and pregnant solution robbing materials. Process variability testwork should be revisited. |
| Project No PS229049 | WSP |
| How Mine | March 2026 |
| S-K 1300 Technical Report Summary | Page 138 |
| Namib Minerals |
| — | The use of conversion factors other than the gold grams to troy ounces conversion factor of 31.10348 gm/oz should be avoided as several inconsistencies were corrected in the supplied financial models. |
| — | The potential for blending sands with underground ore treatment to optimise plant throughput, gold recovery, costs and returns should be assessed. |
| — | Subject to capital and ventilation constraints, the QP recommends consideration be given to implementing more modern, mechanised mining techniques to improve productivity and production tonnage per personnel-shift. This will need to take appropriate account of the existing underground infrastructure and ventilation constraints. |
| — | Ore tonnages are reported on a dry basis. Recent inspection in February 2026 indicates that the mine is relatively dry. Density estimates are applied at one significant decimal place. WSP recommends estimating average densities either by interpolation within the resource model by lithology or by reconciliation to derive an average dry density estimate to two significant decimal places. |
| — | Review of application APF, BF, and BCF modifying factors based on gold metal content and applied solely as a grade factor. This should be incorporated into the developing electronic mining schedule. |
| — | Review of average mineralisation width, stope block width and diluent grade to ensure that appropriate account is made for both practically achievable mining widths and dilution estimates. |
| 24 | References |
BMC (2024). Bulawayo Mining Company Corporate Social Responsibility, Policy Document, Report on file at Metallon Management (Private) Limited, Harare, Zimbabwe.
BMC (2023a). How Mine, Environmental Management Plan 2023, Report on file at Metallon Management (Private) Limited, Harare, Zimbabwe.
BMC (2023b). How Mine, Mineral Reserves and Mineral Resources (MRMR) Estimates, 31 December 2023, Report on file at Metallon Management (Private) Limited, Harare, Zimbabwe.
BMC (2023c). How Mine, Sands Re-Treatment Trials Report – July 2023, Report on file at Metallon Management (Private) Limited, Harare, Zimbabwe.
BMC (2021). BMC Sands Mineral Resources, December 2021, Report on file at Metallon Management (Private) Limited, Harare, Zimbabwe.
| Project No PS229049 | WSP |
| How Mine | March 2026 |
| S-K 1300 Technical Report Summary | Page 139 |
| Namib Minerals |
BMC (2020). How Mine, Mineral Resources and Mineral Reserves Estimation, 31 December 2020, Report on file at Metallon Management (Private) Limited, Harare, Zimbabwe.
BMC (2018). How Mine, Mineral Resources and Mineral Reserves Estimation, 31 December 2018, Report on file at Metallon Management (Private) Limited, Harare, Zimbabwe.
Edelrod Consulting (Edelrod) (2024). How Mine Mineral Reserves and Mineral Resources as at 31 December 2023, Independent Competent Persons’ Statement, Report on file at Metallon Management (Private) Limited, Harare, Zimbabwe, 28 pp.
Enmin Consulting (Private) Limited (2024). Mine Closure Plan 2024, Volume I – Executive Summary, June 2024. Report on file at Metallon Management (Private) Limited, Harare, Zimbabwe.
Golder Associates Pty Ltd (Golder) (2021). Competent Person’s Report for the How Gold Mine, Zimbabwe, Prepared for Metallon Corporation Limited (UK), United Kingdom.
Groundwork (2024), Determination of the State of Stress at How Mine, Groundwork Project # MET02966/HOWGMP, submitted February 2024.
Metallon (2024), Mineral Reserves and Mineral Resources (MRMR) Estimates, Report on file at Metallon Management (Private) Limited, Harare, Zimbabwe.
Meteoblue (2026), Climate Mazowe, Available at: https://www.meteoblue.com/en/weather/historyclimate/climatemodelled/mazowe_zimbabwe_886384
Middindi (2022), Addendum to Review Report, Sill Pillar Extraction, How Mine, Middindi Consulting (Pty) Ltd Ref: MDI2022-How01, submitted November 2022.
NRZ (2024a), Freight Services, Available at: https://nrz.co.zw/freight-services/
NRZ (2024b), Passenger Services, Available at: https://nrz.co.zw/passenger-services/
NRZ (2024c), Network System, Available at: https://nrz.co.zw/network-system/
Prendergast, MD (2004), The Bulawayan Supergroup: a late Archaean passive margin-related large igneous province in the Zimbabwe craton, Journal of the Geological Society, vol.161, pp. 431-445.
Reserve Bank of Zimbabwe (RBZ) (2024), The 2024 Monetary Policy Statement at a Glance, 5 April 2024 13pp.
SRK Consulting (South Africa) (Pty) Ltd (SRK) (2017), Investigation of How Mine Rib Pillar Failure, Report Prepared for Metallon Gold Zimbabwe (Private) Limited, Report Number 512843/1, Submitted May 2017. 47 pp.
SRK (2021), How Mine Rock Mechanics Review, Prepared for Metallon Gold Zimbabwe (Private Limited, SRK Ref #539349, submitted December 2021.
WSP (2024), How Mine S-K 1300 Technical Report Summary, Prepared for Metallon Gold Zimbabwe (Private) Limited, Republic of Zimbabwe, submitted August 2024.
Zimbabwe National Institute of Rock Engineering (ZINIRE) (2018), Technical Visit Feedback Report How Mine Metallon Gold Mine, Prepared for Metallon Gold Zimbabwe (Private) Limited, Republic of Zimbabwe, Submitted July 20182, 17 pp.
| Project No PS229049 | WSP |
| How Mine | March 2026 |
| S-K 1300 Technical Report Summary | Page 140 |
| Namib Minerals |
| 25 | Reliance on information provided by the Registrant |
Except for the purposes legislated under Canadian/USA securities law, any use of this report by any third party is at that party’s sole risk. The QPs have wholly relied upon the Registrant for the following:
| — | Macroeconomic trends, data and assumptions, and interest rates as at February 2026 (Sections 18 and 19).R |
| — | Marketing information and plans within the control of the Registrant (Sections 16, 18, and 19).R |
| — | Legal matters outside the expertise of the QPs, such as statutory and regulatory interpretations affecting the mine plan (Sections 3, 13, 15, and 17)R |
| — | Environmental matters outside the expertise of the QPs (Section 17). Accommodations the Registrant commits or plans to provide to local individuals or groups in connection with its mine plan (Section 17). |
| — | Accommodations the Registrant commits or plans to provide to local individuals or groups in connection with its mine plan (Section 17). |
| — | Governmental factors outside the expertise of the QPs (Section 17). |
The QPs consider it reasonable to rely upon the Registrant for the above information, based on the QPs’ past and ongoing interactions with the subject-matter experts in these areas employed or engaged by the Registrant, as well as the Registrant’s considerable experience mining at the Property. Further, the QPs have taken all appropriate steps, in their professional opinion, to ensure that the above information provided by the Registrant is accurate in all material respects and have no reason to believe that any material facts have been withheld or misstated.
| 26 | Date and Signature Page |
This report titled “How Mine S-K 1300 Technical Report Summary” with an effective date of December 31, 2025 was prepared and signed by: WSP Australia Pty Limited (WSP). WSP hereby states that it is the QP Firm responsible for the preparation of this Technical Report Summary.

Colin McVie
Technical Director Mine Advisory
Dated in Melbourne, Australia
Signature Date: 31 March 2026
| Project No PS229049 | WSP |
| How Mine | March 2026 |
| S-K 1300 Technical Report Summary | Page 141 |
| Namib Minerals |

| Project No PS229049 | WSP |
| How Mine | March 2026 |
| S-K 1300 Technical Report Summary | Page 142 |
| Namib Minerals |
This Report is provided by WSP Australia Pty Limited (WSP) for Namib Minerals (Client) in response to specific instructions from the Client and in accordance with WSP’s proposal dated November 2025 and agreement with the Client dated November 2025 (Agreement).
Permitted purpose
This Report is provided by WSP for the purpose described in the Agreement and no responsibility is accepted by WSP for the use of the Report in whole or in part, for any other purpose (Permitted Purpose).
Qualifications and assumptions
The services undertaken by WSP in preparing this Report were limited to those specifically detailed in the Report and are subject to the scope, qualifications, assumptions and limitations set out in the Report or otherwise communicated to the Client.
Except as otherwise stated in the Report and to the extent that statements, opinions, facts, conclusion and / or recommendations in the Report (Conclusions) are based in whole or in part on information provided by the Client and other parties identified in the report (Information), those Conclusions are based on assumptions by WSP of the reliability, adequacy, accuracy and completeness of the Information and have not been verified. WSP accepts no responsibility for the Information.
WSP has prepared the Report without regard to any special interest of any person other than the Client when undertaking the services described in the Agreement or in preparing the Report.
Use and reliance
This Report should be read in its entirety and must not be copied, distributed or referred to in part only. The Report must not be reproduced without the written approval of WSP. WSP will not be responsible for interpretations or conclusions drawn by the reader. This Report (or sections of the Report) should not be used as part of a specification for a project or for incorporation into any other document without the prior agreement of WSP.
WSP is not (and will not be) obliged to provide an update of this Report to include any event, circumstance, revised Information or any matter coming to WSP’s attention after the date of this Report. Data reported and Conclusions drawn are based solely on information made available to WSP at the time of preparing the Report. The passage of time; unexpected variations in ground conditions; manifestations of latent conditions; or the impact of future events (including (without limitation) changes in policy, legislation, guidelines, scientific knowledge; and changes in interpretation of policy by statutory authorities); may require further investigation or subsequent re-evaluation of the Conclusions.
This Report can only be relied upon for the Permitted Purpose and may not be relied upon for any other purpose. The Report does not purport to recommend or induce a decision to make (or not make) any purchase, disposal, investment, divestment, financial commitment or otherwise. It is the responsibility of the Client to accept (if the Client so chooses) any Conclusions contained within the Report and implement them in an appropriate, suitable and timely manner.
In the absence of express written consent of WSP, no responsibility is accepted by WSP for the use of the Report in whole or in part by any party other than the Client for any purpose whatsoever. Without the express written consent of WSP, any use which a third party makes of this Report or any reliance on (or decisions to be made) based on this Report is at the sole risk of those third parties without recourse to WSP. Third parties should make their own enquiries and obtain independent advice in relation to any matter dealt with or Conclusions expressed in the Report.
| Disclaimer |
This report contains the expressions of professional opinions of the Authors based on (i) information available at the time of preparation, (ii) data supplied by BMC [and others], and (iii) the assumptions, conditions, and qualifications set forth in this report. The quality of information, conclusions, and estimates contained herein are consistent with the stated levels of accuracy as well as the circumstances and constraints under which the mandate was performed.
| Project No PS229049 | WSP |
| How Mine | March 2026 |
| S-K 1300 Technical Report Summary | Page 143 |
| Namib Minerals |
Exhibit 96.2
Bulawayo Mining Company Limited
Mazowe Mine
S-K 1300 Technical Report Summary
January 2025
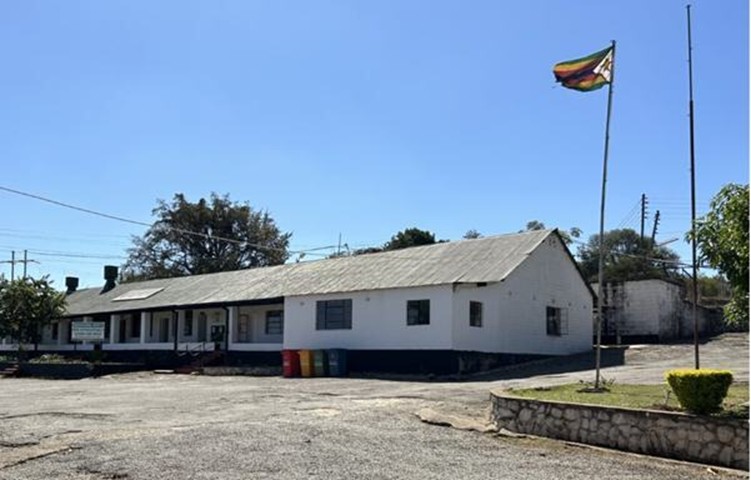

| |
| Our ref: Namib Minerals Redwing and Mazowe WSP Consents 1 April 26 | Level 27, 680 George Street |
| Sydney NSW 2000 | |
| Your ref: Namib Minerals Redwing and Mazowe WSP Consents 1 April 26 | GPO Box 5394 |
| Sydney NSW 2001 | |
| 1 April 2026 | |
| Tel: +61 2 9272 5100 | |
| Fax: +61 2 9272 5101 | |
| www.wsp.com |
Namib Minerals
Suite 210, 2nd Floor, Windward III, Regatta Office Park, PO Box 500
Grand Cayman, Cayman Islands, KY1-1106
Dear All
WSP Consent - Redwing and Mazowe Mine TRS
Please take this letter as confirmation from this date onwards, WSP Australia Pty Limited, take ownership and is responsible for the preparation of the technical reports summary titled Redwing Mine S-K 1300 Technical Report Summary with an effective date of 31 December 2023, and the technical report summary titled Mazowe Mine S-K 1300 Technical Report Summary with an effective date of 31 December 2023.
Furthermore, in each case as signed and certified by WSP Australia Pty Limited (collectively, the “Technical Report Summaries”), WSP hereby states that it is the QP Firm responsible for the preparation of those Technical Report Summaries.
Yours sincerely
| /s/ Colin McVie | |
| Colin McVie | |
| Technical Director Mine Advisory |
WSP Australia Pty Limited ABN 80 078 004 798

Mazowe Mine
S-K 1300 Technical Report Summary
Bulawayo Mining Company Limited
WSP
Level 3, 51-55 Bolton St
Newcastle NSW 2300
PO Box 1162
Newcastle NSW 2300
Tel: +61 2 4929 8300
Fax: +61 2 4929 8382
wsp.com
| Rev | Date | Details | ||
| D | 29/01/2025 | Final report |
| Name | Date | Signature | ||||
| Aaron Radonich | /s/ Aaron Radonich | |||||
| Prepared by: | 29/01/2025 | |||||
| Allan Blair | /s/ Allan Blair | |||||
| Reviewed by: | Jerry DeWolfe | 09/01/2025 | /s/ Jerry DeWolfe |
This document may contain confidential and legally privileged information, neither of which are intended to be waived, and must be used only for its intended purpose. Any unauthorised copying, dissemination or use in any form or by any means other than by the addressee, is strictly prohibited. If you have received this document in error or by any means other than as authorised addressee, please notify us immediately and we will arrange for its return to us.
| PS213686-WSP-NTL-MNG-REP-002 RevD (Mazowe Mine) |
January 2025 |
Table of contents
| 1 | Executive summary | 1 |
| 1.1 | Property description and ownership | 1 |
| 1.2 | Geology and mineralisation | 1 |
| 1.3 | Exploration | 2 |
| 1.4 | Mineral Resources estimates | 2 |
| 1.5 | Mineral Reserves estimates | 3 |
| 1.6 | Capital and operating costs | 3 |
| 1.7 | Permitting requirements | 3 |
| 1.8 | QPs’ conclusions and recommendations | 4 |
| 1.8.1 | Mineral Resources | 4 |
| 1.8.2 | Mineral Reserves | 5 |
| 2 | Introduction | 7 |
| 2.1 | Registrant information | 7 |
| 2.2 | Terms of reference and purpose | 9 |
| 2.3 | Sources of information | 12 |
| 2.4 | Personal inspection | 12 |
| 2.5 | Previously filed Technical Report Summaries | 13 |
| 2.6 | WSP declaration | 13 |
| 3 | Property description | 14 |
| 3.1 | Property location | 14 |
| 3.2 | Title and mineral rights | 15 |
| 3.3 | Encumbrances | 16 |
| 3.4 | Risks to access, title, or right to perform work | 16 |
| 3.5 | Agreements and royalties | 17 |
| 4 | Accessibility, climate, local resources, infrastructure and physiography | 17 |
| 4.1 | Topography, elevation, and vegetation | 17 |
| 4.2 | Access | 17 |
| 4.3 | Proximity to population centres | 17 |
| 4.4 | Climate | 17 |
| 4.5 | Local resources and existing infrastructure | 18 |
| 4.5.1 | Power supply | 18 |
i
| CONTENTS (Continued) | ||
| 4.5.2 | Water supply | 19 |
| 4.5.3 | Personnel | 19 |
| 4.5.4 | Suppliers | 19 |
| 5 | History | 20 |
| 5.1 | Exploration and ownership history | 20 |
| 5.2 | Production history | 20 |
| 5.3 | Production reconciliation | 21 |
| 5.4 | Aggregate fiscal year production | 22 |
| 5.5 | Exploration and development by previous owners or operators | 22 |
| 5.6 | Liabilities | 22 |
| 6 | Geological setting, mineralisation, and deposit | 23 |
| 6.1 | Regional geology | 23 |
| 6.2 | Structural setting | 24 |
| 6.3 | Local and Property geology | 24 |
| 6.4 | Deposit type and geology | 26 |
| 6.5 | Mineralisation | 28 |
| 7 | Exploration | 28 |
| 7.1 | Diamond drilling | 28 |
| 7.1.1 | Underground drilling | 28 |
| 7.1.2 | Surface drilling | 30 |
| 7.3 | QP’s opinion | 36 |
| 8 | Sample preparation, analyses, and security | 36 |
| 8.1 | Sampling techniques | 36 |
| 8.1.1 | Core sampling | 36 |
| 8.1.2 | Channel sampling | 36 |
| 8.1.3 | Grab samples | 37 |
| 8.1.4 | Sample security | 37 |
| 8.1.5 | Dry bulk density determination | 37 |
| 8.2 | Sample preparation, analyses, and procedures | 37 |
ii
| CONTENTS (Continued) | ||
| 8.3 | Quality Assurance Quality Control | 37 |
| 8.3.1 | Channel sampling | 38 |
| 8.3.2 | Core sampling | 38 |
| 8.3.3 | Grab sampling | 38 |
| 8.3.4 | General guidelines | 38 |
| 8.4 | QP’s opinion on adequacy | 38 |
| 9 | Data verification | 39 |
| 9.1 | Mineral Resources verification | 39 |
| 9.1.1 | Data verification conducted by MMC Zimbabwe | 39 |
| 9.1.2 | Data verification conducted by WSP | 39 |
| 9.1.3 | Limitations on Mineral Resources data verification | 40 |
| 9.2 | Mining and Mineral Reserves data verification | 40 |
| 9.3 | Geotechnical data verification | 40 |
| 9.4 | Hydrology and hydrogeology data verification | 42 |
| 9.4.1 | Hydrology | 43 |
| 9.4.2 | Hydrogeology | 44 |
| 9.5 | Processing and recovery methods data verification | 44 |
| 10 | Mineral processing and metallurgical testing | 45 |
| 10.1 | Nature and extent of mineral processing and metallurgical testing | 45 |
| 10.2 | Metallurgical sampling representativity | 46 |
| 10.2.1 | Underground ore testwork | 46 |
| 10.2.2 | Sands testwork | 46 |
| 10.3 | Details of analytical or testing laboratories | 47 |
| 10.4 | Recovery estimates | 48 |
| 10.5 | QP’s opinion on adequacy of the data collected | 48 |
| 11 | Mineral Resource estimates | 49 |
| 11.1 | Key assumptions, parameters, and methods | 49 |
| 11.1.1 | Care and maintenance | 49 |
| 11.1.2 | Resource database | 49 |
| 11.1.3 | Geological interpretation | 49 |
| 11.1.4 | Data preparation | 49 |
| 11.1.5 | Exploratory data analysis | 49 |
| 11.1.6 | Dry bulk density | 52 |
iii
| CONTENTS (Continued) | ||
| 11.1.7 | Block models | 52 |
| 11.1.8 | Grade interpolation parameters | 53 |
| 11.1.9 | Grade estimation | 55 |
| 11.1.10 | Model validation | 56 |
| 11.2 | Mineral Resources classification | 56 |
| 11.2.1 | Measured Mineral Resources | 56 |
| 11.2.2 | Indicated Mineral Resources | 57 |
| 11.2.3 | Inferred Mineral Resources | 57 |
| 11.3 | Cut-off grade, price, and justification | 57 |
| 11.3.1 | Tonnage-grade factors | 58 |
| 11.4 | Mineral Resources statement | 59 |
| 11.5 | Uncertainty in the estimates of Inferred, Indicated, and Measured Mineral Resources | 61 |
| 11.6 | QP’s opinion on factors likely to influence the prospect of economic extraction | 62 |
| 12 | Mineral Reserves estimates | 62 |
| 13 | Mining methods | 63 |
| 13.1 | Introduction | 63 |
| 13.2 | Parameters relevant to the design and schedule | 63 |
| 13.2.1 | Geotechnical | 63 |
| 13.2.2 | Hydrogeological | 64 |
| 13.3 | Production parameters | 64 |
| 13.3.1 | Production rates | 64 |
| 13.3.2 | Expected mine life | 64 |
| 13.3.3 | Mining model | 64 |
| 13.3.4 | Mining dilution and recovery factors | 65 |
| 13.4 | Mining fleet, machinery, and personnel requirements | 65 |
| 13.5 | Scheduling process | 65 |
| 13.6 | Scheduling results | 65 |
| 13.7 | Mining unit dimensions | 66 |
| 13.8 | Mine layout | 66 |
| 14 | Processing and recovery methods | 69 |
| 14.1 | Processing methodologies and flowsheets | 69 |
iv
| CONTENTS (Continued) | ||
| 14.2 | Processing plant throughput and characteristics | 70 |
| 14.3 | Primary and secondary crushing | 70 |
| 14.4 | Product sampling | 70 |
| 14.5 | Product stockyard | 71 |
| 14.6 | Energy and water process materials requirements | 71 |
| 14.6.1 | Mine power plant | 71 |
| 14.6.2 | Mine water management system | 71 |
| 14.7 | QP’s opinion | 71 |
| 15 | Infrastructure | 72 |
| 15.1 | Rail access | 72 |
| 15.2 | Port access | 72 |
| 15.3 | Roads | 72 |
| 15.4 | Camp | 72 |
| 15.5 | Tailings | 72 |
| 15.6 | Potable water and wastewater | 74 |
| 15.7 | Accommodation and offices | 74 |
| 15.8 | Non process infrastructure | 74 |
| 15.9 | Information and communications technology (ICT) systems | 74 |
| 15.10 | Other support facilities and utilities | 74 |
| 16 | Market studies | 75 |
| 16.1 | Nature and material terms of agency relationships | 75 |
| 16.2 | Results of relevant market studies | 75 |
| 16.3 | Commodity price projections | 75 |
| 16.4 | Mining and processing | 77 |
| 16.5 | Product transport and handling | 77 |
| 16.6 | Hedging arrangements | 77 |
| 16.7 | Forward sales contracts | 77 |
| 16.8 | Contracts with affiliated parties | 77 |
v
| CONTENTS (Continued) | ||
| 17 | Environmental studies, permitting, and plans, negotiations, or agreements with local individuals or groups | 78 |
| 17.1 | Introduction | 78 |
| 17.2 | Project context | 78 |
| 17.3 | Project permitting | 78 |
| 17.4 | Environmental and Social Impact Assessment | 78 |
| 17.4.1 | Biodiversity and natural resources | 78 |
| 17.4.2 | Managing impacts on water | 79 |
| 17.4.3 | Acid and metalliferous drainage (AMD) | 79 |
| 17.4.4 | Erosion and protection of soils | 79 |
| 17.4.5 | Noise and vibration | 79 |
| 17.4.6 | Air quality | 79 |
| 17.4.7 | Local climate impacts | 79 |
| 17.4.8 | Greenhouse gas emissions | 79 |
| 17.4.9 | Resources use and non-mineral waste | 79 |
| 17.5 | Property standards | 79 |
| 17.6 | Stakeholder engagement | 80 |
| 17.6.1 | Stakeholder engagement plan | 80 |
| 17.6.2 | Consultation | 80 |
| 17.7 | Cultural, economic, and social conditions | 80 |
| 17.7.1 | Cultural heritage | 80 |
| 17.7.2 | Local landscape | 80 |
| 17.7.3 | Contributing to the national and local economy | 80 |
| 17.7.4 | Establishing a social management framework | 80 |
| 17.7.5 | Impacts on land use and access | 80 |
| 17.7.6 | Protecting community health and safety | 81 |
| 17.7.7 | Protecting the workforce | 81 |
| 17.7.8 | Commitment to local procurement and hiring | 81 |
| 17.8 | Mine closure | 81 |
| 17.8.1 | Plan | 81 |
| 17.8.2 | Cost | 82 |
| 17.9 | Translating the ESIA into environmental and social management | 82 |
| 17.10 | QP’s opinion | 82 |
| 18 | Capital and operating costs | 83 |
| 19 | Economic analysis | 83 |
vi
| CONTENTS (Continued) | ||
| 20 | Adjacent properties | 83 |
| 21 | Other relevant data and information | 83 |
| 22 | Interpretation and conclusions | 83 |
| 22.1 | Mineral Resources interpretations and conclusions | 83 |
| 22.2 | Mineral Reserves interpretations and conclusions | 84 |
| 23 | Recommendations | 85 |
| 23.1 | Mineral Resources recommendations | 85 |
| 23.2 | Mineral Reserves recommendations | 86 |
| 24 | References | 87 |
| 25 | Reliance on information provided by the Registrant | 89 |
| List of tables | ||
| Table 1-1 | MGM underground Measured and Indicated Mineral Resources estimate as at 31 December 2023 | 2 |
| Table 1-2 | MGM underground Inferred Mineral Resources estimate as at 31 December 2023 | 3 |
| Table 1-3 | Summary of proposed 2024 MMC Zimbabwe surface exploration drilling (MMC Zimbabwe 2024) | 5 |
| Table 2-1 | List of acronyms and abbreviations used in this TRS | 9 |
| Table 2-2 | List of QPs | 13 |
| Table 5-1 | Mineral Resource summary comparison end December 2022 to end December 2023 | 21 |
| Table 9-1 | Summary of drill hole database errors | 39 |
| Table 9-2 | Groundwater development potential of formations occurring in the Mazowe Catchment | 44 |
| Table 10-1 | Test conditions and results for flotation | 47 |
| Table 11-1 | Univariate statistics for samples within the economic mineralisation envelope (GFM 2018) | 50 |
| Table 11-2 | Top-cut grades applied by MMC Zimbabwe | 51 |
vii
| List of tables continued | ||
| Table 11-3 | Block dimension schemes for 30 June 2018 block models (GFM 2018) | 52 |
| Table 11-4 | Grade interpolation parameters for 30 June 2018 block models (GFM 2018) | 54 |
| Table 11-5 | 31 December 2023 Mineral Resource COG parameters | 58 |
| Table 11-6 | MGM underground Measured and Indicated Mineral Resources estimate as at 31 December 2023 | 60 |
| Table 11-7 | MGM underground Inferred Mineral Resources estimate as at 31 December 2023 | 60 |
| Table 13-1 | MGM shaft list – dimensions, depths and inclination | 68 |
| Table 16-1 | Zimbabwean inflation rate and economic indicators (Trading Economics, 30 May 2024) | 76 |
| Table 17-1 | MGM present closure obligation (Enmin 2024) | 82 |
| Table 23-1 | Summary of proposed 2024 MMC Zimbabwe surface exploration drilling (MMC Zimbabwe 2024) | 86 |
| List of figures | ||
| Figure 2.1 | BMC Limited corporate structure | 8 |
| Figure 3.1 | Property location map | 15 |
| Figure 3.2 | MMC Zimbabwe claims boundary | 16 |
| Figure 4.1 | Climate statistics for Mazowe, Zimbabwe (Meteoblue 2024) | 18 |
| Figure 5.1 | MGM total gold production 1962–2023 | 21 |
| Figure 6.1 | Regional geology of Zimbabwe showing locations of greenstone belts (Prendergast 2004) | 23 |
| Figure 6.2 | Local geology of the Mazowe area (GFM 2018) | 25 |
| Figure 6.3 | Local stratigraphy of the Mazowe area | 26 |
| Figure 6.4 | Cross-section looking west through the main Property reefs (GFM 2018) | 27 |
| Figure 7.1 | Plan view of channel samples and existing mine development | 29 |
| Figure 7.2 | Plan view of drill hole collars and existing mine development | 30 |
| Figure 9.1 | Section showing all drill holes above the MGM topographic surface | 40 |
| Figure 9.2 | Catchment boundaries of Zimbabwe (BMC Limited) | 42 |
| Figure 9.3 | Mean annual rainfall within the Mazowe catchment (Waterkings 2014) | 43 |
| Figure 10.1 | MGM Sands flotation and CIL plant flowsheet | 45 |
| Figure 11.1 | Nucleus 3 block grade and drill hole comparison | 56 |
| Figure 13.1 | MGM underground mine access shafts and general mine layout (Virimai 2018) | 67 |
| Figure 13.2 | MGM layout – projection looking east | 68 |
| Figure 14.1 | MGM processing flowsheet | 70 |
| Figure 15.1 | MGM site layout showing processing and TSF | 73 |
| Figure 16.1 | Historical (blue) gold spot price and forecast (grey) in US$/oz (Trading Economics 30 May 2024) | 76 |
| Figure 16.2 | Zimbabwean gold currency exchange rate ZiG/USD (Trading Economics, 1 July 2024) | 77 |
List of appendices
Appendix A Limitations statement
viii
| 1 | Executive summary |
| 1.1 | Property description and ownership |
The Mazowe Gold Mine (MGM) [or the Property] is located in Mashonaland Central Province, Zimbabwe, approximately 50 kilometres (km) north of the City of Harare (latitude 17°28’S and longitude 30°55’E). A railway line passes through the Property, linking up with the regional centres of Glendale, Bindura, and Shamva.
Mazowe Mining Company (Private) Limited Zimbabwe (MMC Zimbabwe), a wholly owned subsidiary of Gold Fields of Mazowe (UK) Limited (GFM UK), which is a wholly owned subsidiary of BMC Limited, possesses total ground holdings under Mining Lease (ML) 35 totalling 1,955.5 ha (Figure 3.2) [GFM 2018].
Ore is processed in a single processing plant, consisting of conventional crushing and milling and a Carbon-in-Leach (CIL) facility.
The Property is accessible via the A11 between Harare and Glendale. Access to the mine site and to the ore is authorised by the applicable mining legislation, and MMC Zimbabwe’s title and mining rights. Mining exploration and exploitation works conducted or to be conducted on site are authorised in accordance with the applicable legislation, and MMC Zimbabwe’s title and mining rights.
| 1.2 | Geology and mineralisation |
The MGM is situated within the Harare-Bindura-Shamva greenstone belt of the Zimbabwean (Archaean) Craton, on the margin of the Chinhamhora Batholith. The Harare-Bindura-Shamva greenstone belt comprises major metavolcano-sedimentary sequences, structurally intruded by the Chinhamhora Batholith, linking northwards through the Property area, and then eastwards along the Mazowe Valley, through the Harare-Bindura-Shamva greenstone belt.
The typical lithology at the MGM consists of the Mazowe Granodiorite, which is coarse, crystalline, quartz-rich and porphyritic. Feldspar porphyries occur in the eastern to southern parts of the mine complex. They are typically dark grey or black in colour, with pronounced white phenocrysts of quartz and feldspar. To the east of the Property, feldspar porphyries grade into metabasaltic rocks. These are intercalated with BIF in places. Thin ultramafic units/lithologies are known to occur in the footwall of the Jumbo mineralised shear zone.
The mineralisation at the MGM is collectively hosted by granodiorite stock and feldspar porphyries. These lithologies are host to a multitude of narrow, sub-parallel mineralised shear zones, which form an imbricate thrust shear zone system. To date more than 15 sub-parallel shear zones have been identified. These shear zones strike east-west and dip to the north at approximately 10 to 50 degrees (°). From north to south, mining has exposed the following mineralised shear zones:
| — | Flowing Bowl. |
| — | S.O.S. |
| — | Bucks. |
| — | Bojum/Wimbledon. |
| — | Connaught. |
| — | Nucleus. |
| — | Birthday. |
| — | Carnbrae. |
| — | Shear zones are generally separated by unsheared zones (lithons) of ± 30 metres (m) in width. |
| Project No PS213686 Mazowe Mine S-K 1300 Technical Report Summary Bulawayo Mining Company Limited | WSP January 2025 Page 1 |
| 1.3 | Exploration |
Current exploration is conducted using underground diamond drilling and channel samples. Diamond drill core is logged and sampled, with sample length dictated by the width of the mineralised shear zone. One sample each of the barren hanging wall and footwall is also taken and submitted for assay. All underground diamond drill holes are collar and downhole surveyed.
Channel sampling, diamond drilling, and sludge drilling samples were used for the purposes of geological modelling and Mineral Resource estimation.
| 1.4 | Mineral Resources estimates |
This report is prepared as a Technical Report Summary (TRS) for the Property, in accordance with the United States Securities and Exchange Commission’s (SEC) Modernised Property Disclosure Requirements for Mining Registrants as described in Subpart 229.1300 of Regulation S K, Disclosure by Registrants Engaged in Mining Operations (S-K 1300) and Item 601(b)(96).
The disclosure of Mineral Resources under this report is based upon the Qualified Person’s (QP’s) initial assessment. The Mineral Resources estimate has been defined, classified, and reported according to the guiding principles and minimum standards set out in SAMREC (2016). WSP’s view is that there are no material differences between SAMREC (206), and S-K 1300 requirements for the reporting of Mineral Resources.
The relevant QPs are satisfied that there has been sufficient orebody knowledge work completed to support Reasonable Prospects for Economic Extraction (RPEE) at the Property from a Mineral Resources perspective. The initial assessment incorporates the QP’s qualitative evaluation of relevant technical and economic factors likely to influence the prospect of economic extraction to establish the economic potential of the mining property or project (Section 11.3).
Evaluation data collection includes diamond drilling, and channel sampling.
Given there has been no mining or exploration conducted since the mine was placed on Care & Maintenance (C&M) due to the mine workings being flooded, in the QP’s opinion the 2018 assumptions regarding definition of the Mineral Resource base remain current.
For the purposes of demonstrating capacity to exploit the Mineral Resource base as required under S-K 1300, the QPs prepared a high-level cashflow model provided by MMC Zimbabwe and are satisfied that the scale of the Mineral Resource and free cashflow after operating costs are sufficient to cover the capital cost of re-establishing access to the underground mine workings, dewatering the underground mine workings, surface infrastructure, and plant refurbishment/replacement. A process recovery of 88% for gold was applied for cashflow modelling consistent with recent historical averages and fixed tail estimates. Further assumptions are provided under Section 11.3 and Table 11-5.
A new COG for 2023 was calculated based on the 3-year trailing average gold price at December 2023 (with a gold price multiplier of 30%), applicable mill recovery, and revised operating and sustaining capital costs. This is described in Section 11.3.
Mineral Resources are reported on an in-situ basis.
Table 1.1 presents the underground Measured and Indicated Mineral Resources (exclusive of Mineral Reserves) reported as at 31 December 2023.
| Table 1-1 | MGM underground Measured and Indicated Mineral Resources estimate as at 31 December 2023 |
| Category | Tonnage (Mt) | Au Grade (g/t) | Au Metal (koz) | |||||||||
| Underground | ||||||||||||
| Measured Resources | 0.26 | 9.01 | 75 | |||||||||
| Indicated Resources | 0.91 | 7.45 | 217 | |||||||||
| Grand Total | 1.17 | 7.77 | 291 | |||||||||
Notes: Mt = million tonnes; Au Grade g/t = gold grams per tonne; koz = thousand ounces.
| Project No PS213686 Mazowe Mine S-K 1300 Technical Report Summary Bulawayo Mining Company Limited | WSP January 2025 Page 2 |
Table 1.2 presents the underground Inferred Mineral Resources (exclusive of Mineral Reserves) reported as at 31 December 2023.
| Table 1-2 | MGM underground Inferred Mineral Resources estimate as at 31 December 2023 |
| Category | Tonnage (Mt) | Au Grade (g/t) | Au Metal (koz) | |||||||||
| Underground | ||||||||||||
| Inferred Resources | 3.29 | 8.65 | 915 | |||||||||
| Grand Total | 3.29 | 8.65 | 915 | |||||||||
Notes: Mt = million tonnes; Au Grade g/t = gold grams per tonne; koz = thousand ounces.
It should be noted that the Mineral Resources estimate for the Property is reported exclusive of Mineral Reserves. The Property does not have a current Mineral Reserve.
It should be noted that the sands (tailings) Mineral Resources estimate for the Property is not included as part of the in-situ Mineral Resources for the Property, as the ownership of the sands (tailings) material itself, and the accompanying sands (tailings) processing facility is currently under dispute, with legal proceedings ongoing. The sands (tailings) Mineral Resources estimate for the Property is detailed in Section 11.3.
The Mineral Resources presented in this Section are not Mineral Reserves, and do not reflect demonstrated economic viability. The reported Inferred Mineral Resources are considered too speculative geologically to have the economic considerations applied to them that would enable them to be categorised as Mineral Reserves. There is no certainty that all or any part of this Mineral Resource will be converted into Mineral Reserve.
All figures are rounded to reflect the relative accuracy of the estimates and totals may not add correctly.
Based on the geological results presented in this TRS, supported by the assumptions made by BMC Zimbabwe (presented in Section 11.3), it is the QP’s opinion that the Mineral Resources have RPEE.
| 1.5 | Mineral Reserves estimates |
Not applicable since this TRS is an Initial Assessment and no Mineral Reserves have been estimated.
| 1.6 | Capital and operating costs |
Not applicable since this TRS is an Initial Assessment and no Mineral Reserves have been estimated.
Any future estimation of Mineral Reserves and potential recommencement of operations will require the support of an additional drilling and resource definition campaign and at least a pre-feasibility to feasibility level of evaluation.
| 1.7 | Permitting requirements |
The ML is inspected on an annual basis by the Government of Zimbabwe. The area covered by ML 35 was surveyed and declared to be 1,955.5 ha. ML 35 was inspected on 21 May 2024, and the current inspection certificate is valid until the next inspection date of 19 August 2025.
There is also a requirement for renewal of environmental and miscellaneous operating permits as outlined in Section 17.3 before recommencement of active mining operations. The Environmental Impact Assessment Certificate is current and expires 13 September 2025. Miscellaneous operating permits will require renewal.
There has been a significant increase in artisanal gold mining activities within the MGM tenement area during the period of business administration to present day.
| Project No PS213686 Mazowe Mine S-K 1300 Technical Report Summary Bulawayo Mining Company Limited | WSP January 2025 Page 3 |
| 1.8 | QPs’ conclusions and recommendations |
| 1.8.1 | Mineral Resources |
Based on the information presented in this TRS, the QP’s key conclusions are as follows:
| — | The levels of understanding of the regional geology, local geology, and the nature and controls on mineralisation are high, and provide a solid foundation for geological modelling, Mineral Resource estimation, and mining and exploration geology. |
| — | The drilling, sampling, assay and Quality Assurance and Quality Control (QAQC) techniques used for both exploration, and resource definition are consistent with standard industry practice, and are considered appropriate for the purposes of geological modelling and Mineral Resource estimation. |
| — | Grade estimates were not constrained to orebody wireframes during grade estimation but were constrained to orebody wireframes during Mineral Resource estimate reporting. |
| — | Estimates utilised all available samples i.e., channel, sludge, diamond drill core etc. |
| — | Dry bulk density (BD) of 2.9 tonnes per cubic metre (t/m3) assigned for all mineralised domains. |
| — | Validation of the Mineral Resource estimates has not been reported. Standard industry practice is to conduct both visual, and statistical validation of estimates and present the findings of this work in the Mineral Resource report to provide the reader an appreciation of the robustness of the estimates. |
| — | Grade estimation within modelled mineralisation domains (constrained estimate) would likely result in an increase in contained metal. |
| — | Mining, processing, and market modifying factors, study assumptions, and parameters are used to establish RPEE for the reporting of Mineral Resources. No significant risks exist that could impact the reliability and/or confidence of Mineral Resources estimates. |
| — | The MRMR technical report developed by MMC Zimbabwe covers a number of areas in sufficient detail; however, some areas require more detail to give the reader a more thorough understanding of the work that has been conducted, the results of the work and any inherent risks to the Mineral Resource estimate. |
Based on the information presented in this TRS, the QP’s key recommendations are as follows:
| — | Data and database management is an area that requires further work. The MGM would benefit from the introduction of a corporate database, with inbuilt validation routines and reporting functionality, to assist with what is a large quantity of geological information. |
| — | The estimated cost of this recommendation is US$1,000,000 across the BMC Limited portfolio of assets. |
| — | Data analysis is conducted; however, it is recommended that for future Mineral Resource estimates, deposit wide Exploratory Data Analysis (EDA) is undertaken prior to estimation, to ensure data is fit for purpose for geological modelling and Mineral Resource estimation. |
| — | It is recommended that a succinct geological modelling and Mineral Resource estimation process flow is developed and followed for future Mineral Resource estimates. |
| — | It is recommended that Mineral Resource estimation is constrained to modelled mineralisation domain wireframes, using an appropriate Au Cut-off Grade (COG). |
| — | Review lithology, structural and mineralisation modelling practices. |
| — | It is recommended that studies to characterise the hydrogeology are included in future exploration programs. |
| — | A comparison between BD values determined from underground grab samples, and drill core should be undertaken to ensure that the mean values used for Mineral Resource estimation are appropriate, and that bias is not being incorporated into the Mineral Resource estimate. |
| — | Validation of the Mineral Resource estimates produced, or at least the documentation of validation work undertaken is an area that requires further work. Standard industry practice is to conduct both visual and statistical validation of estimates and present the findings of this work in the TRS, to give the reader an appreciation of the robustness of the estimates. |
| — | Review Mineral Resource classification methodology and block assignment. |
| Project No PS213686 Mazowe Mine S-K 1300 Technical Report Summary Bulawayo Mining Company Limited | WSP January 2025 Page 4 |
| — | Mineral Resource reconciliation practices should be reviewed, and a system implemented that provides a measure of Mineral Resource estimate performance. Planned versus actual resource tonnages and grades should be developed and updated each time a Mineral Resource estimate is completed. It is recommended that mined development and production be reconciled monthly, and stope close-out reports be developed for each completed stope. |
| — | Infill surface drilling and exploration of the eastern continuity of the Mazowe deposits. Drilling proposed by MMC Zimbabwe is presented in Table 1.3. |
| Table 1-3 | Summary of proposed 2024 MMC Zimbabwe surface exploration drilling (MMC Zimbabwe 2024) |
| Mine Area | Nature of Work | Comment | ||||
| — | To explore for along strike and down-dip extensions of the Mazowe deposits to the east. | |||||
| — | 600 m of trenching. | |||||
| Jumbo East | — | Infill diamond drilling (11 drill holes totalling 4,400 m). | — | Estimated Cost: US$528,000. | ||
| — | Timing: 2024. | |||||
| — | Estimated tonnage and grade: 2 Mt @ 5.50 g/t (353,658 oz). | |||||
| — | 800 m of trenching. | — | To probe the down dip continuity of the Amatola deposit. | |||
| Mazowe South | — | Diamond drilling (10 drill holes totalling 4,000 m). | — | Estimated cost: US$480,000. | ||
| — | Timing: 2024. | |||||
| — | Estimated tonnage and grade: 580,000 t @ 5.50 g/t (102,561 oz). | |||||
Notes: Mt = million tonnes, g/t = grams per tonne, oz = ounces.
| — | All paper-based estimation techniques should be converted to computer-based (digital) as soon as possible. |
| — | RPEE have been considered, and the parameters used are considered reasonable. |
| — | The MRMR technical report developed by MMC Zimbabwe covers a number of areas in sufficient detail; however, some areas require more detail to give the reader a more thorough understanding of the work that has been conducted, the results of the work and any inherent risks to the Mineral Resource estimate. |
| 1.8.2 | Mineral Reserves |
Not applicable since this TRS is an Initial Assessment and no Mineral Reserves have been estimated.
For the historical 2018 Mineral Reserve estimate, the QP provides comment as follows:
| — | When last in operation in 2018 there was a significant gap in head grade delivered of 3.67 g/t compared to the Mineral Reserve grade of 6.37 g/t Au, warranting reconciliation and justification. The June 2018 Mineral Reserves compliance with the 2016 Edition of the SAMREC Code is called into question due to insufficient assurance of technical and economic feasibility. |
| — | The historical estimate is indicative and requires update to reflect resource definition via more modern CAD techniques and to reflect significant changes in cost structures and metal pricing in the intervening 6 years. |
| — | Any future estimation of Mineral Reserves and potential recommencement of operations will require the support of an additional drilling and resource definition campaign and at least a pre-feasibility to feasibility level of evaluation. |
| — | The QP approves of the conventional industry approach to defining Mineral Reserves and applying modifying factors, provided that operating performance measures are regularly updated. |
| Project No PS213686 Mazowe Mine S-K 1300 Technical Report Summary Bulawayo Mining Company Limited | WSP January 2025 Page 5 |
| — | The influx of contract artisanal miners in recent years under the supervision of the previous business administrator, now removed by BMC legal action, and associated poor safety statistics, has posed a risk to permitting and future operation. The QP understands that MMC Zimbabwe is now in the process of negotiations and removal of contract artisanal miners. It must be noted that the artisanal miners focused on shallow workings within 30 m of surface in areas outside the MGM resource and reserve base, and with underground workings flooded to the 3 Level (approximately 50 m below surface) there has been no depletion of resources. |
For the historical 2018 Mineral Reserve estimate, the QPs provide recommendations as follows:
| — | MGM is currently on C&M since August 2018 due to external economic environment which had deteriorated by then, though improvement was seen over the years. This affected the sand retreatment project’s performance in terms of throughput, head grade and recovery, and the declining tonnage and head grade from the underground operations over the period from 2016. The performance of the underground during 2017 and 2018 also suffered from a low level of capital investment in exploration and underground development, necessary to define accessible blocks to the required level of confidence and accuracy and to facilitate a well-planned development strategy and potential productivity improvements. More generally, the operation was constrained by a shortage of consumables and critical spares. Processing performance was impacted by the inability to secure reliable supplies of key consumables such cyanide. |
In response, MMC Zimbabwe commissioned a conceptual scoping level study (Virimai, November 2018) to examine options for recommencing operations. The Virimai study appears to provide sufficient confidence to proceed to a more detailed prefeasibility level assessment. WSP’s view is that this work should proceed to provide sufficient confidence for estimation of a SAMREC compliant Mineral Reserve that is suitably supported by a business plan that demonstrates the technical and economic viability. This should include:
| — | Detailed mine prefeasibility assessment of underground options. This should include examination of options for productivity improvements, block access strategies and optimised targeting and sequencing of blocks, dewatering strategy, hoist capacity, and process options. |
| — | Reconciliation of historical mine performance and individual stope reconciliation. |
| — | Once ownership litigation is successfully settled, the tailings retreatment project should be back analysed to confirm reasons for plant underperformance in throughput and head grade. This should include review of the sand tailings in-situ grades, scheduled head grades, and mining strategy. |
The required technical studies should be completed to confirm that re-establishment of commercial production and expansion of production beyond historical benchmarks is both technically feasible and economically viable.
After future Mineral Resource and Mineral Reserve updates, a stope optimisation exercise is recommended. Stope optimisation allows for the rapid development of valid stope shapes according to specified criteria.
More detailed analysis should also be completed in the following areas:
| — | Review actual mining widths compared to applied widths, unplanned dilution levels, adjustment of metal prices, and consideration of exchange rates and revenue constraints. The APF and BRF should be based on actual data and applied by section and stope. Actual mining widths achieved by survey measurement and reconciliation should be compared with average stope widths applied (plus allowance for unplanned dilution). |
| — | Unplanned levels of dilution of 23–25% in combination with the minimum mining width assumptions should be compared with reconciliation statistics from resource, reserve, break, hoist and reconciled mill feed. Planned and achieved stope widths should be compared to properly reconcile and guard against excess dilution. |
| — | Consideration should be given to assessment of the capital development, dewatering, and extraction costs for accessing and exploiting satellite blocks located at increased distance from main haulage horizons and shafts for hoisting of the ore. Increased costs for accessing these blocks needs to be considered to determine if it is economic to mine. The size of the blocks to support this access will also need to be considered as increased capital costs are more easily borne by larger block inventories. |
| — | Gold and silver prices should be updated in line with the 3-year trailing average and monitored against prevailing spot prices and/or long-term forecasts on a regular six-monthly basis. Pay limits and cashflow models should be updated accordingly. |
| — | Allowance for the influence of exchange rates, inflation, and constraints on revenue received from the sale of gold to the Zimbabwean government is required. WSP understands that recent payment has been mandated as a combination of local currency and United States Dollars (USD), the impact of which upon revenue needs to be monitored and quantified in USD terms. |
| Project No PS213686 Mazowe Mine S-K 1300 Technical Report Summary Bulawayo Mining Company Limited | WSP January 2025 Page 6 |
| 2 | Introduction |
| 2.1 | Registrant information |
This Technical Report Summary (TRS) is for the Bulawayo Mining Company Limited (BMC Limited) owned Mazowe Gold Mine (MGM) [or the Property], located in Mashonaland Central Province, approximately 50 km north of the capital Harare, and was prepared by the Qualified Persons (QPs) for BMC Limited.
BMC Limited is a private company incorporated in the United Kingdom (UK) and is a wholly owned subsidiary of Metallon Corporation Limited (UK) [Metallon]. Gold Fields of Mazowe (UK) Limited (GFM UK) is a private company incorporated in the UK and is a wholly owned subsidiary BMC Limited.
Mazowe Mining Company (Private) Limited Zimbabwe (MMC Zimbabwe), Bulawayo Mining Company (Private) Limited Zimbabwe (BMC Zimbabwe), and Redwing Mining Company (Private) Limited Zimbabwe (RMC Zimbabwe) are responsible for the management of mineral assets located in Zimbabwe, the principal activities of which include exploration, development and operation of precious metals mineral assets.
MMC Zimbabwe is directly responsible for the day-to-day management of mining operations and possesses total ground holdings under ML 35 totalling 1,955.5 ha (Figure 3.2) [GFM 2018].
| Project No PS213686 Mazowe Mine S-K 1300 Technical Report Summary Bulawayo Mining Company Limited | WSP January 2025 Page 7 |
Figure 2.1 presents the corporate structure of BMC Limited.
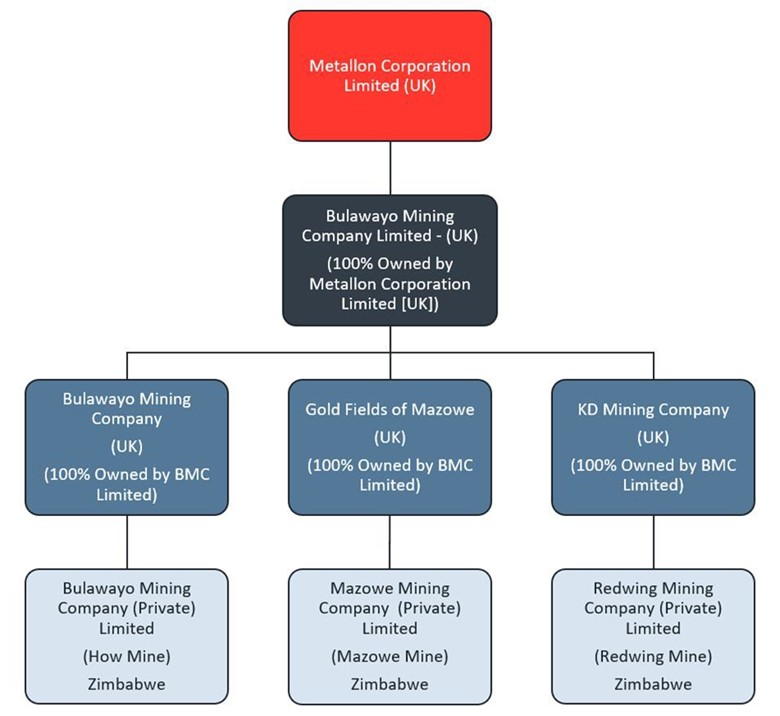
| Figure 2.1 | BMC Limited corporate structure |
In October 2002, Metallon (herein referred to as BMC Limited) acquired a portfolio of mineral assets from a holding subsidiary of Lonmin plc (Lonmin), known as Independence Mining (Private) Limited.
This portfolio of mineral assets located in Zimbabwe consists of three mining properties located within a significant land package consisting of some 66.02 square kilometres (km2) in area. The mining properties comprise three separate underground gold mines, namely: How, Mazowe, and Redwing. Each mining property is serviced by its own dedicated processing facilities and accompanying infrastructure. BMC Limited considers there to be significant exploration potential at each of the mining properties.
From acquisition of the assets in 2002 until 2006, gold production steadily increased with gold production peaking in 2005 at approximately 156,000 ounces (oz) of gold, making BMC Limited Zimbabwe’s largest gold producer.
Due to political unrest and hyperinflation in 2007, BMC Limited’s mining activities in Zimbabwe ceased and all mines were placed on Care & Maintenance (C&M). In 2009, mining activities recommenced, with many of the mines requiring rehabilitation work.
| Project No PS213686 Mazowe Mine S-K 1300 Technical Report Summary Bulawayo Mining Company Limited | WSP January 2025 Page 8 |
Operations were suspended at the MGM on 31 December 2018 and Redwing on 30 March 2019 due to general economic challenges. Both mines were placed on a Supreme Court ordered Corporate Rescue, the MGM commencing 20 February 2020 and the Redwing Gold Mine (RGM) commencing 23 July 2020. Both Corporate Rescue proceedings were nullified on 7 October 2021 for the MGM and 5 September 2022 for the RGM.
An application to cancel court orders for the MGM were submitted on 15 February 2024 and is currently being processed. New mining contracts have been finalised in May 2024 and are currently under implementation.
Gold production from the MGM since 2018 is as follows (MMC Zimbabwe Operation Reports):
| — | 2018: 4,929 oz. |
| — | 2019: 0 oz. |
| — | 2020: 0 oz. |
| — | 2021: 171 oz. |
| — | 2022: 2,251 oz. |
| — | 2023: 5,339 oz. |
BMC Limited’s forward strategy is to produce 300,000 oz of gold per annum through expansion across all mines, and through a broader acquisition strategy across Africa.
BMC Limited is pursuing a focused expansion strategy throughout Africa, with the aim of securing prospective green minerals assets in Zimbabwe, and the Democratic Republic of Congo (DRC).
| 2.2 | Terms of reference and purpose |
The purpose of this TRS is to report Mineral Resources, and Mineral Reserves for the Property effective as of 31 December 2023. The TRS utilises:
| — | Australian English spelling. |
| — | metric units of measure. |
| — | grades presented in weight percent (wt.%). |
| — | coordinate system presented in metric units using Arc 1950/UTM zone 36S. |
| — | United States Dollars (USD). |
Summary Mineral Resources and Mineral Reserves in Table 1.1 and Table 1.2 are presented based on a BMC Limited equity ownership basis (100%).
Key acronyms and definitions used in this TRS include those items listed in Table 2.1.
| Table 2-1 | List of acronyms and abbreviations used in this TRS |
| Acronym/Abbreviation | Description | |
| AAS | Atomic Absorption Spectrometer | |
| AISC | All-In-Sustaining-Costs | |
| amsl | Above Mean Sea Level | |
| APF | Assay plan factor | |
| BCF | Block Call Factor |
| Project No PS213686 Mazowe Mine S-K 1300 Technical Report Summary Bulawayo Mining Company Limited | WSP January 2025 Page 9 |
| Acronym/Abbreviation | Description | |
| BD | Bulk density | |
| BIF | Banded Iron Formation | |
| BF | Block Factor | |
| BMC Limited | Bulawayo Mining Company Limited | |
| BMC Zimbabwe | Bulawayo Mining Company (Private) Limited Zimbabwe | |
| BRF | Break Factor | |
| CIL | Carbon-in-Leach | |
| cm | Centimetres | |
| C&M | Care and Maintenance | |
| COG | Cut-off Grade | |
| CPI | Consumer Price Index | |
| CRM | Certified Reference Material | |
| CV | Coefficient of variation | |
| ° | Degrees | |
| °C | Degrees Celsius | |
| DRC | Democratic Republic of Congo | |
| EDA | Exploratory Data Analysis | |
| EIA | Environmental Impact Assessment | |
| EMS | Environmental Management System | |
| EMP | Environmental Management Plan | |
| FOS | Factor of Safety | |
| FS | Feasibility Study | |
| g/cm3 | Grams per cubic centimetre | |
| g/t | Grams per tonne | |
| GeoPlanet | GeoPlanet Key (Pvt) Ltd | |
| GFM | Gold Fields of Mazowe (UK) Limited | |
| ha | Hectares | |
| HGM | How Gold Mine | |
| IGM | Independence Gold Mining Limited | |
| JCMC | Jumbo Gold Mining Company | |
| kg | Kilograms | |
| km | Kilometres | |
| km2 | Square kilometres | |
| koz | Thousand ounces |
| Project No PS213686 Mazowe Mine S-K 1300 Technical Report Summary Bulawayo Mining Company Limited | WSP January 2025 Page 10 |
| Acronym/Abbreviation | Description | |
| kt | Thousand tonnes | |
| ktpa | Thousand tonnes per annum | |
| ktpm | Thousand tonnes per month | |
| kVA | Kilovolt-ampere | |
| kV | Kilovolt | |
| LOM | Life of Mine | |
| m | Metres | |
| m3 | Cubic metres | |
| MAR | Mean annual runoff | |
| MCF | Mine Call Factor | |
| MGM | Mazowe Gold Mine | |
| Ml | Megalitre | |
| ML | Mining Lease | |
| MMC Zimbabwe | Mazowe Mining Company (Private) Limited | |
| mm | Millimetres | |
| Moz | Million ounces | |
| MRMR | Mineral Resources Mineral Reserves | |
| Mt | Million tonnes (metric) | |
| MVA | Megavolt-ampere | |
| OK | Ordinary Kriging | |
| oz | Ounces | |
| PFS | Pre-Feasibility Study | |
| Q | Rock mass quality | |
| QAQC | Quality Assurance Quality Control | |
| QP | Qualified Person | |
| RC | Reverse Circulation | |
| RMC Zimbabwe | Redwing Mining Company (Private) Limited Zimbabwe | |
| ROM | Run of Mine | |
| RPEE | Reasonable Prospects for Economic Extraction | |
| RTGS | Real Time Gross Settlement | |
| SAMREC | South African Mineral Resource Committee | |
| SD | Standard deviation |
| Project No PS213686 Mazowe Mine S-K 1300 Technical Report Summary Bulawayo Mining Company Limited | WSP January 2025 Page 11 |
| Acronym/Abbreviation | Description | |
| SML | S. Museka Lab. Consultancy Services (SML) | |
| SRK | SRK Consulting (UK) Ltd | |
| SRKSA | SRK Consulting (South Africa) (Pty) Ltd | |
| t | Tonnes | |
| t/m3 | Tonnes per cubic metre | |
| tph | Tonnes per hour | |
| tpm | Tonnes per month | |
| TRS | Technical report summary | |
| TSF | Tailings Storage Facility | |
| USD | United States Dollar | |
| UTM | Universal Transverse Mercator | |
| V | Volts | |
| WSP | WSP Australia Pty Limited | |
| Wt.% | Weight percent | |
| ZETDC | Zimbabwe Electricity Transmission and Distribution Company | |
| ZESA | Zimbabwe Electricity Supply Authority | |
| ZiG | Zimbabwe Gold Currency | |
| ZWL | Zimbabwean Dollar |
| 2.3 | Sources of information |
This TRS relies upon various reports and other material prepared by BMC Limited, and BMC Limited’s staff and consultants as provided to WSP. This data and information have been supplemented with information in the public domain, and through information gathered during a site inspection by WSP in May 2024 (Section 2.4).
While WSP has reviewed the data and other information contained in the reports and other material provided to it and is not aware of any reason to doubt that such data and information is complete and accurate, excluding Golder (2020), WSP was not responsible for the preparation of those reports and other material.
WSP has taken reasonable care to ensure that the information contained in this TRS is in accordance with the facts and information available to it and is unaware of any omission likely to affect its import. In this regard, the attention of any reader of the TRS is specifically directed to Section 24, and Appendix A.
| 2.4 | Personal inspection |
Information in this TRS has been prepared under the supervision of the following QPs:
| — | Aaron Radonich, Fellow of the Australasian Institute of Mining and Metallurgy (FAusIMM, Member Number 221172), Principal Geologist, WSP. Aaron is responsible for MGM Mineral Resources. The date of the last personal inspection was May 2024. |
| — | Allan Blair, Member of the Australasian Institute of Mining and Metallurgy (FAusIMM, Member Number 102240), Principal Mining Engineer, WSP. Allan is responsible for MGM Mineral Reserves. The date of the last personal inspection was May 2024. |
| Project No PS213686 Mazowe Mine S-K 1300 Technical Report Summary Bulawayo Mining Company Limited | WSP January 2025 Page 12 |
Table 2.2 presents a tabulation of the QPs, their personal inspections, and their areas of responsibility.
| Table 2-2 | List of QPs |
| QP | Qualifications/Affiliation | Date of Personal Inspection |
Areas of Responsibility | |||
| Aaron Radonich | Fellow AusIMM, PGCert Geostatistics, BSc (Hons.), BSc | May 2024 | Sections 1.1, 1.2, 1.3, 1.4, 1.7, 1.8.1, 2, 3, 4, 5, 6, 7, 8, 9.1, 11, 20, 21, 22,1, 23.1, 24 and 25. | |||
| Allan Blair | FAusIMM, MBA, BSc, BAppSc Mining Engineering | May 2024 | Sections 1.5, 1.8.2, 2, 3, 4, 5, 9.2, 9.3, 9.4, 9.5, 10, 12, 13, 14, 15, 16, 17, 18, 19, 20, 21, 22.2 and 23.2. |
| 2.5 | Previously filed Technical Report Summaries |
This is the first TRS filed for the Property and therefore does not update a previously filed TRS.
| 2.6 | WSP declaration |
The opinions of QPs in the employ of WSP contained herein and effective 31 December 2023, are based on information collected throughout the course of investigations by the QPs. The information in turn reflects various technical and economic conditions at the time of preparing the TRS. Given the nature of the mining business, these conditions can change significantly over relatively short periods of time. Consequently, actual results may be significantly more or less favourable.
This TRS may include technical information that requires subsequent calculations to derive sub-totals, totals, and weighted averages. Such calculations inherently involve a degree of rounding, and consequently introduce a margin of error. Where these occur, the QPs do not consider them to be material.
Neither WSP, nor the QPs responsible for this TRS, are insiders, associates, or affiliates of BMC Limited or any of its subsidiaries. The results of the technical review by the QPs are not dependent on any prior agreements concerning the conclusions to be reached, nor are there any undisclosed understandings concerning any future business dealings.
| Project No PS213686 Mazowe Mine S-K 1300 Technical Report Summary Bulawayo Mining Company Limited | WSP January 2025 Page 13 |
| 3 | Property description |
The Property is one of the oldest mines in Zimbabwe, with exploration and development dating back to 1890. More than 1.4 million ounces (Moz) of gold has been recovered to date. The Property covers 1,955.5 hectares (ha) of land holding ML 35. Ore is processed in a single processing plant, consisting of conventional crushing and milling and a Carbon-in-Leach (CIL) facility (GFM 2018).
The Property has a Mineral Resource and Mineral Reserve estimated and reported (as at 30 June 2018) in accordance with the 2016 Edition of the SAMREC Code.
The Mineral Resource estimates have not been updated since the MGM was placed on C&M in April 2019. WSP was informed by MMC Zimbabwe that the B.S.V. Mineral Resource is no longer included in the greater MGM Mineral Resource, hence; it was excluded. The Mineral Resource (as at 31 December 2023) contains approximately 1.2 Moz of gold, and the historical reserve contains approximately 120 thousand ounces (koz) of gold (Sections 11.3 and 1.8.2 respectively). There is no current Mineral Reserve stated for the MGM.
Mineralised zones at the Property generally comprise shear zones, which are in-filled with gold-bearing sulphides, and quartz. Mineralised zones are up to 1.0 m in width, range from 25 to 200 m along strike, generally dip between 10 and 60° to the north, and possess mean gold grades of approximately 4 to 5 grams per tonne (g/t) (GFM 2018). Gold mineralisation is associated with pyrite, pyrrhotite, and arsenopyrite. In most cases, gold is strongly associated with sulphide mineralisation, and only to a limited degree with quartz veins. Approximately 70% of the gold present occurs as ‘free gold’. More than 15 mineralised zones have been exploited to date (GFM 2018).
The Property was placed on C&M in August 2018. At that time, installed ore hoisting capacity was 19,000 tonnes per month (tpm), and milling capacity was 10,500 tpm. Total production for 2017 (the last full year of production prior to the operation being placed on C&M) was 8,625 oz of gold (GFM 2018). The mean mined gold grade was 4.20 g/t (GFM 2018). In the five full years prior to 2018 (between 2013 and 2017), gold production averaged 10,500 oz per annum.
Significant exploration potential exists at the Property, and BMC Limited’s conceptual target size for the Property is in the order of 2.5 to 3 Moz of gold to a depth of 1,000 m. The Mazowe deposit mainly comprises several sub-parallel east-striking, shear hosted narrow reefs, and has a defined strike length of approximately 3 kilometres (km). It is open both along strike, and down-dip (GFM 2018).
| 3.1 | Property location |
The Property is located in Mashonaland Central Province, Zimbabwe, approximately 50 km north of the City of Harare (latitude 17°28’S and longitude 30°55’E). A railway line passes through the Property, linking up with the regional centres of Glendale, Bindura, and Shamva (SRK 2012).
| Project No PS213686 Mazowe Mine S-K 1300 Technical Report Summary Bulawayo Mining Company Limited | WSP January 2025 Page 14 |
The location of the property and its proximity to major infrastructure is presented in Figure 3.1.
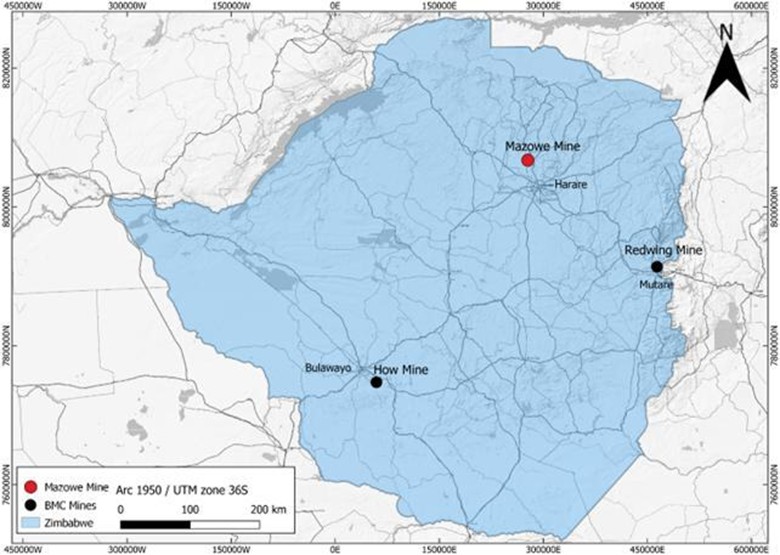
| Figure 3.1 | Property location map |
| 3.2 | Title and mineral rights |
MMC Zimbabwe currently possesses total ground holdings under ML 35 totalling 1,955.5 ha (GFM 2018).
Claims were pegged predominantly for precious metals, with 41 claims secured for base metals such as tungsten, iron, zinc, and nickel. These claims can be converted to precious metals claims as and when required (GFM 2018).
Protection is afforded by erecting concrete beacons with claim details engraved on a 200 x 200 mm aluminium plate, mounted on a metal post 600 mm above the beacon. Approximately 20% of the claim area has legally surveyed beacons (GFM 2018).
Theft of metal plates and metal posts has been a long-standing problem. GFM security is in a constant battle with illegal artisanal miners operating within the claim area (GFM 2018).
| Project No PS213686 Mazowe Mine S-K 1300 Technical Report Summary Bulawayo Mining Company Limited | WSP January 2025 Page 15 |
Figure 3.2 presents the MMC Zimbabwe claims boundary.
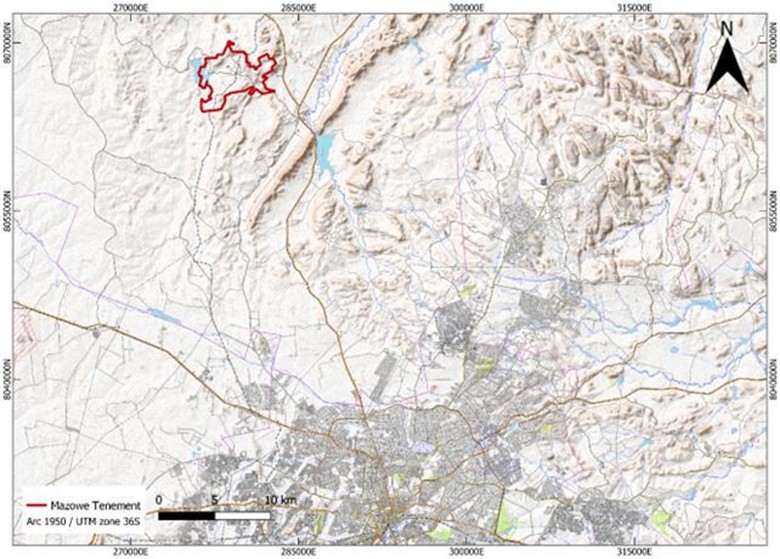
| Figure 3.2 | MMC Zimbabwe claims boundary |
While WSP has referred to tenement holdings in this TRS, such reference is for convenience only and may not be complete or accurate. WSP is not expert in tenement management and the reader should not rely on information in this TRS relating to the current ownership and legal standing of the tenements or any encumbrances impacting on those tenements. This TRS assumes that all tenements and tenement applications are in good standing and free of all encumbrances other than those set out in this TRS.
| 3.3 | Encumbrances |
There are no known significant encumbrances to the Property that would impact the current Mineral Resources or Mineral Reserves.
| 3.4 | Risks to access, title, or right to perform work |
Access to the mine site and to the ore is authorised by the applicable mining legislation, and MMC Zimbabwe’s title and mining rights (Section 3.2). Mining exploration and exploitation works conducted or to be conducted on site are authorised in accordance with the applicable legislation, and MMC Zimbabwe’s title and mining rights (Section 3.2). Other required permits and authorisations (e.g., environmental, building, etc.) are applied for by MMC Zimbabwe in accordance with the applicable legislation.
| Project No PS213686 Mazowe Mine S-K 1300 Technical Report Summary Bulawayo Mining Company Limited | WSP January 2025 Page 16 |
| 3.5 | Agreements and royalties |
In 2022, the government of Zimbabwe has promulgated new regulations through Statutory Instrument 189 of 2022 to the effect that mineral royalties are to be paid partly in kind and partly in monetary form. The mineral royalties are collected from minerals specified in terms of section 49(1)(c1) of the Reserve Bank of Zimbabwe Act [Chapter 11:15] deemed to be components of the reserves maintained by the Reserve Bank of Zimbabwe. Minerals include but are not limited to gold, diamonds, platinum group metals and lithium. These regulations have also caused timeous amendments to the Finance Act and the Reserve Bank of Zimbabwe Act to ensure the cooperation in application of legislation (BMC 2023).
In 2024, the monetary component was revised. Royalties remitted to the Zimbabwe Revenue Authority in respect of gold and those minerals specified are paid based on 50% in kind and 50% in monetary form. With regards the “in kind component”, miners submit actual minerals they would have extracted. The 50% monetary component would be paid as follows:
| — | 37.5% in the Zimbabwe Gold (ZiG) currency. |
| — | 12.5% in foreign currency (RBZ 2024). |
Prior to the promulgation of these regulations, royalties were paid only in monetary form.
A US$21 per kilogram (/kg) realisation fee is also charged for gold lodged with Fidelity Printers and Refiners (BMC 2023).
| 4 | Accessibility, climate, local resources, infrastructure and physiography |
| 4.1 | Topography, elevation, and vegetation |
The terrain across the Property is undulating ground, well treed, with frequent granitic and greenstone hills. The elevation is approximately 1,300 m above mean sea level (amsl). A system of seasonal streams, flowing east into the perennial Mazowe River, and west into the Marodzi River, provide good drainage to the area. Depending on rock types, weathering of mafic rocks has resulted in the formation of reddish soils, while felsic rocks have resulted in the formation of slighter coloured sandy loams. The area is endowed with good soils and is intensively cultivated for maize, wheat, cotton, and citrus (GFM 2018).
| 4.2 | Access |
The Property is accessible via the A11 between Harare, and Glendale. A railway line passes through the Property, linking up with the regional centres of Glendale, Bindura, and Shamva (SRK 2012).
| 4.3 | Proximity to population centres |
The MGM is located in Mashonaland Central Province, Zimbabwe, approximately 50 km north of the city of Harare, Zimbabwe (latitude 17°28’S and longitude 30°55’E), which has a population of approximately 1.5 million.
A railway line passes through the Property, linking up with the regional centres of Glendale, Bindura, and Shamva (SRK 2012).
Harare is serviced by Robert Gabriel Mugabe (RGM) International Airport, operated by the Airport Company of Zimbabwe (Private) Limited (ACZ), which has the capacity to handle 2.5 million passengers per annum (ACZ 2024). The National Railways of Zimbabwe (NRZ) provides both freight services (NRZ 2024a), and passenger services (NRZ 2024b).
| 4.4 | Climate |
The MCM operates continuously throughout the year, with no interruptions due to seasonal changes.
Temperatures are cold during winter, although frost is rare. Hot summers are experienced, with temperatures reaching 30 degrees Celsius (°C). Average annual rainfall for the area is approximately 950 millimetres (mm), though extremes of up to 1,560 mm have been recorded. The rainy season stretches from mid-November to mid-March (SRK 2012).
| Project No PS213686 Mazowe Mine S-K 1300 Technical Report Summary Bulawayo Mining Company Limited | WSP January 2025 Page 17 |
Figure 4.1 presents climate statistics for Mazowe, Zimbabwe.
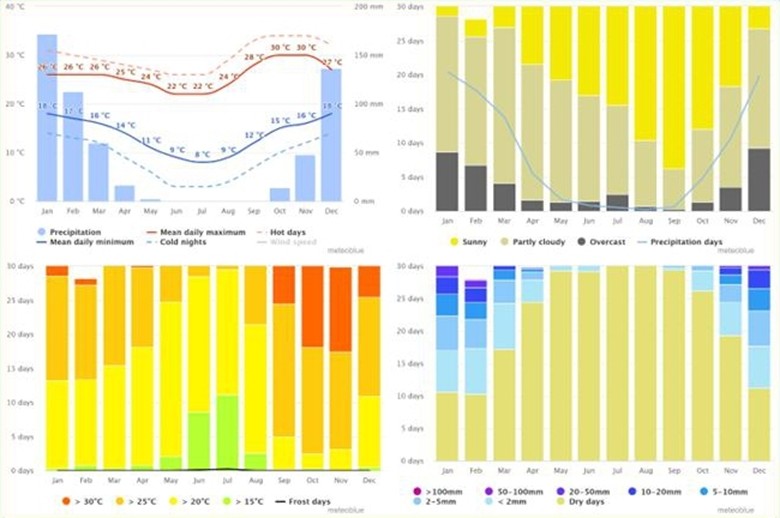
| Figure 4.1 | Climate statistics for Mazowe, Zimbabwe (Meteoblue 2024) |
| 4.5 | Local resources and existing infrastructure |
| 4.5.1 | Power supply |
MGM has access to two power supply lines, a 33 kilovolt (kV) supply and an 11 kV supply. Power supply is from the power utility company, Zimbabwe Electricity Transmission and Distribution Company (ZETDC), a subsidiary of Zimbabwe Electricity Supply Authority (ZESA) [BMC Limited].
Power is then transformed to the following voltages (BMC Operations Reports):
| — | 11 kV: Distribution voltage for CIL, underground feed, and domestic supply. |
| — | 2.2 kV: Supply voltage for compressors, village transformers supply, and underground feed. |
| — | 550 V: Supply voltage for mine plants, including underground and workshop equipment. |
| — | 380 V: Supply voltage for villages, offices, and domestic water supply. |
The following transformers are utilised by the MGM (BMC Limited Operations Reports):
| — | 2 x 750 kilovolt ampere (kVA) transformers (33kV to 550 V). |
| — | 1 x 750 kVA, which is 33 kV to 2.2 Kv. |
| — | 1 x 2 Megavolt-ampere (MVA), which is 33 kV to 11 kV. |
| — | 1 x 200 kVA 2.2 kV to 550 V located on the 22 level Ogilvy Shaft for underground supply. |
| Project No PS213686 Mazowe Mine S-K 1300 Technical Report Summary Bulawayo Mining Company Limited | WSP January 2025 Page 18 |
| 4.5.2 | Water supply |
Process water is pumped from underground (it simultaneously supplies the plant whist dewatering the mine) into water reservoirs with a capacity of more than 350 cubic metres (m3). Process water is accessed by way of gravity flow, and mechanical pumping. It is received at the mill feeds and discharge, cyclone feed sumps, VD9, and trash screen sprays, and for general plat housekeeping. Spilled water is pumped back into the system using a DTV pump. Zero water discharge at the mills is maintained through the use of another DTV pump at the CIL feed section of the plant. Overflow water from the thickener is pumped back to the main mill water tank, with any other water gravitating to the Knelson Concentrator water feed sumps.
The mine has a mine dam as a source of water. The average dam level is 80%. The dam is linked to the much larger Jumbo dam which is an alternative source of water though it has not been used as the mine dam has been sufficient.
The mine is situated in a high rainfall region with a yearly average rainfall of 950 mm though extremes of 1,560 mm have been recorded.
The mine is also flooded, and water can be recycled for processing.
| 4.5.3 | Personnel |
At the time the MGM was placed on C&M, the underground section consisted of 389 workers, against a labour budget of 514. The mine was operating with two production shifts per day (Morning Shift = 0500 hours to 1300 hours, and Night Shift = 2000 hours to 0400 hours), with labour equally distributed as the production target for each shift was the same.
Drilling was conducted on both day and night, with lashing also being conducted on both shifts. Blasting was conducted once per day between 1500 and 1600 hours, with re-entry at 2000 hours as per regulations, so as to give the mine time to adequately ventilate and expel fumes generated by blasting.
Two Mine Captains (reporting to the Underground Manager), and four Overseer Miners (three reporting to the Mine Captain production, and one to the Mine Captain development) were in place.
General labour force is available within the surrounding communities. For specialised skills, advertisements are flighted in the public press and usually they will come from any part of the country (BMC Limited).
| 4.5.4 | Suppliers |
Consumables and spares are sourced locally, with a few exceptional cases where they are imported from South Africa (BMC Limited).
| Project No PS213686 Mazowe Mine S-K 1300 Technical Report Summary Bulawayo Mining Company Limited | WSP January 2025 Page 19 |
| 5 | History |
| 5.1 | Exploration and ownership history |
The history of the MGM is largely associated with that of the Jumbo Mine. It is estimated that prior to 1980, at least 150,000 oz of gold was extracted. In 1903, the Jumbo Gold Mining Company (JCMC) was floated. This marked the first substantial development of the mine. During the period 1906/1907, a 30-stamp mill was erected, and the JCMC secured the majority of the adjoining claims, including the Jumbo NE extension, and the Ceowara claims on Amatola Farm (GFM 2018).
As the mine increased in depth, mineralised zones became shorter and further apart, hence development was ceased in 1912. Development of the mine decline continued until 1917, when milling also ceased (GFM 2018).
During 1906 to 1917, a total of 293,000 tonnes (t) of ore were treated at a recovered grade of 15.7 g/t Au, yielding approximately 147,898 oz of gold (GFM 2018).
Following closure of the JCMC in 1917, the mine was let out on tribute and was worked until 1931 (GFM 2018).
Between 1932 and 1953, the mine area was a hive of individual self-contained small-scale workings, which included the Carnbrae, Birthday, Connaught, Bojum, Bucks, and Flowing Bowl areas (GFM 2018).
In 1953, all existing tributes were terminated, and holdings were acquired by Lonrho Zimbabwe Ltd (Lonrho), which operated the area as a single entity. This was achieved using a system of cross-cuts, mined to link the various holdings. Today these cross-cuts serve as haulages (GFM 2018).
During this period, both Nucleus and Carnbrae continued to operate separately under the Murdoch Eaton brothers but were finally acquired by Lonrho in 1962. From 1962 onwards, production became steady and continuous. Production peaked between 1965 and 1973, when it averaged approximately 3,150 ounces per month (ozpm). After 1973, it declined, reaching its lowest levels in 1991. In the same year, Independence Gold Mining (Pvt) Limited (IGM) took over the mine (GFM 2018).
In 2002, BCM acquired IGM and took over GFM. Since then, post-Independence gold mining production rose from a low of 12,125 oz in 2001, to 15,050 oz in 2005. After 2005, production declined due to poor economic conditions, that prevailed until the introduction of the USD in 2009. Gold production sat at around 10–12 koz for the period 2012-2016, and declined to approximately 6 koz in 2017, and 1 koz in 2018, when the mine was placed on C&M (GFM 2018).
A Supreme Court ordered Corporate Rescue was implemented on 20 February 2020. The Corporate Rescue proceedings were nullified on 7 October 2021. An application to cancel court orders was submitted on 15 February 2024. New mining contracts were finalised in May 2024.
| 5.2 | Production history |
Total gold produced from the MGM between 1962 and 2023 is approximately 1.36 Moz.
| Project No PS213686 Mazowe Mine S-K 1300 Technical Report Summary Bulawayo Mining Company Limited | WSP January 2025 Page 20 |
Figure 5.1 presents total gold production from the MGM for the period 1962–2023.
| Figure 5.1 | MGM total gold production 1962–2023 |
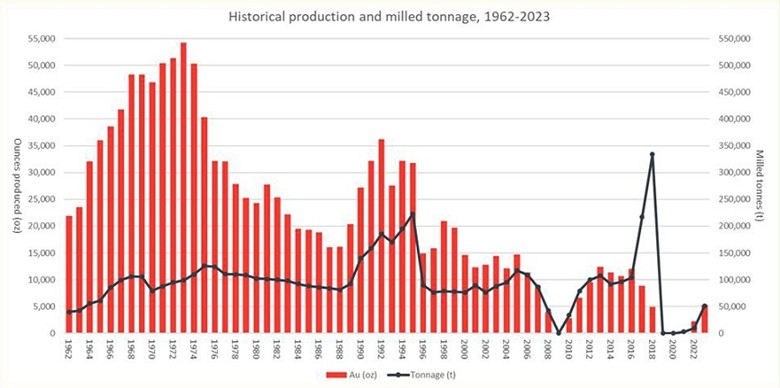
| 5.3 | Production reconciliation |
The Property’s Mineral Resources as of the end of the 2023 and 2022 fiscal years are compared in Table 5.1. While there has been no change in the resource base as the result of mining depletion, there has been minor change associated with adjustment of COG from 2.52 g/t Au in 2022 to 2.58 g/t Au in 2023. There has been no statement of Mineral Reserves for the 2022 and 2023, and therefore no requirement for comparison.
Key variances between 2022 and 2023 Mineral Resources are summarised as follows:
| — | Measured Resources: A 0.08% reduction in ounces arising from the increase in COG. |
| — | Indicated Resources: No change from the increase in COG. |
| — | Measured and Indicated Resources: Tonnage decreased by 0.07% while grade improved by 0.04% leading to a net decrease of 0.02% in contained gold arising from the COG adjustments. |
| — | Inferred Resources: A 0.27% decrease in ounces arising from COG adjustments. |
| Table 5-1 | Mineral Resource summary comparison end December 2022 to end December 2023 |
| 31 December 2022 | 31 December 2023 | Var. (%) | ||||||||||||||||||||||||||
| Category | Tonnes (kt) | Au Grade (g/t) | Au (koz) | Tonnes (kt) | Au Grade (g/t) | Au (koz) | Au (koz) | |||||||||||||||||||||
| Mineral Resources | ||||||||||||||||||||||||||||
| Measured Mineral Resources | 260 | 8.99 | 75 | 260 | 9.01 | 75 | -0.08 | % | ||||||||||||||||||||
| Indicated Mineral Resources | 910 | 7.42 | 217 | 910 | 7.42 | 217 | 0.00 | % | ||||||||||||||||||||
| Total M+I Mineral Resources | 1,170 | 7.75 | 292 | 1,170 | 7.75 | 291 | -0.02 | % | ||||||||||||||||||||
| Inferred Mineral Resources | 3,320 | 8.60 | 917 | 3,290 | 8.65 | 915 | -0.27 | % | ||||||||||||||||||||
| Total Mineral Resources | 4,490 | 8.37 | 1,209 | 4,460 | 8.41 | 1,206 | -0.21 | % | ||||||||||||||||||||
Notes: Numbers are rounded, Mineral Resources exclude Mineral Reserves, and Mineral Reserves are inclusive of dilution and ore loss.
| Project No PS213686 Mazowe Mine S-K 1300 Technical Report Summary Bulawayo Mining Company Limited | WSP January 2025 Page 21 |
| 5.4 | Aggregate fiscal year production |
Since the mine has been on C&M since April 2019, there has been no material production from Mineral Resources over the past 3 years.
| 5.5 | Exploration and development by previous owners or operators |
Previous exploration and development is discussed in Section 5.1.
| 5.6 | Liabilities |
Inspection of the draft Financial Statements for the year ended 31 December 2023 indicates MMC Zimbabwe carries substantial liabilities that total US$11.928 M comprising:
| — | Non-Current Liability for an “Environmental rehabilitation provision” for US$4.281 M. |
| — | Current Liability for “Trade and other payables” for US$7.647 M. |
| Project No PS213686 Mazowe Mine S-K 1300 Technical Report Summary Bulawayo Mining Company Limited | WSP January 2025 Page 22 |
| 6 | Geological setting, mineralisation, and deposit |
| 6.1 | Regional geology |
The MGM is situated within the Harare-Bindura-Shamva greenstone belt of the Zimbabwean (Archaean) Craton, on the margin of the Chinhamhora Batholith. The Harare-Bindura-Shamva greenstone belt comprises major metavolcano-sedimentary sequences, structurally intruded by the Chinhamhora Batholith, linking northwards through the Property area, and then eastwards along the Mazowe Valley, through the Harare-Bindura-Shamva greenstone belt (GFM 2018).
Figure 6.1 presents a simplified regional geology map of Zimbabwe, and the locations of major greenstone belts. The Harare-Bindura-Shamva greenstone belt can be seen in the top right.
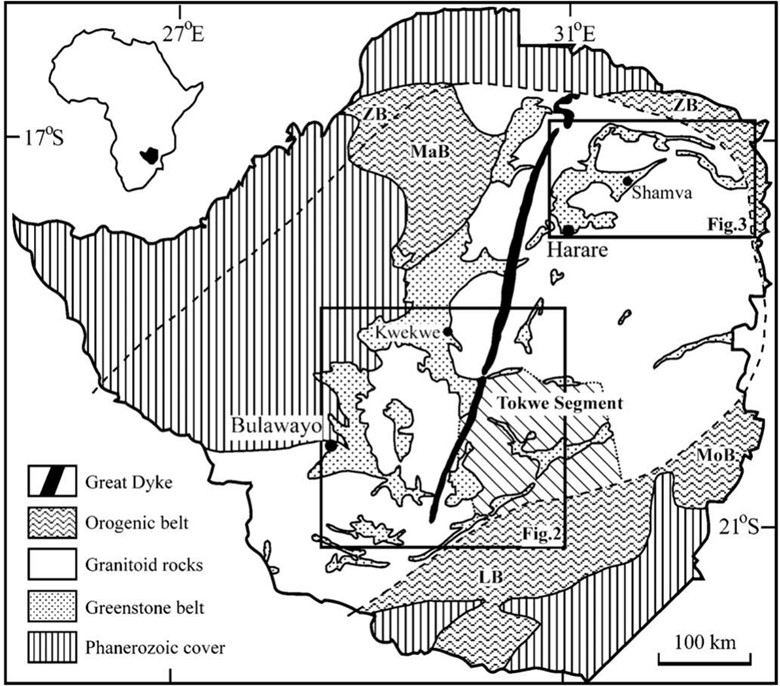
| Figure 6.1 | Regional geology of Zimbabwe showing locations of greenstone belts (Prendergast 2004) |
| Project No PS213686 Mazowe Mine S-K 1300 Technical Report Summary Bulawayo Mining Company Limited | WSP January 2025 Page 23 |
The oldest sequence within the Harare-Bindura-Shamva greenstone belt is the Iron Mask Formation, which partially surrounds the later granitoid Chinhamhora Igneous Complex. It is predominantly a succession of metamorphosed felsic volcanics; mainly dacite, with lesser amounts of meta-andesite and meta-rhyolite. It comprises lavas, breccias, and varied volcaniclastics. Included metasediments are cherty sulphide iron formation, subsidiary phyllite, meta-arenite, and quartz schists. Uppermost in the Iron Mask Formation are carbonated meta-dacites and dacitic meta-volcaniclastics with very thin graphitic phyllites (GFM 2018).
The Iron Mask Formation is overlain by tholeiitic metabasalts of the Arcturus Formation. In the east, this formation includes thick sequences of metabasalt, minor meta-andesite/dacite, Banded Iron Formation (BIF), chert bands and ultramafic schists (GFM 2018).
The Mount Hampden Formation overlies the metabasalt sequence in the central region of the greenstone belt and comprises graphitic to tuffaceous meta-argillites or phyllites. These are accompanied by Banded Iron Formation (BIF). Limestone deposits are developed in part of the succession (Passaford and Sternblick regions). The thick phyllite sequences are intimately folded or interdigitated with metabasalts at their base and with metasediments at their top (GFM 2018).
The Passaford Formation is both the uppermost and most complicated sequence within the Harare-Bindura-Shamva greenstone belt. Within the Passaford Formation, the succession is divided into two members, one predominantly comprising felsic metavolcanics, and the other comprising metasediments varying from quartzite to re-worked volcaniclastics, and wackes. The contacts between the metavolcanic and metasedimentary members are gradational, and the lithologies are often interdigitated (GFM 2018).
Metagabbro bodies of the Selby Mafic Igneous event later intruded the entire Harare-Bindura-Shamva greenstone belt sequence described above (GFM 2018).
| 6.2 | Structural setting |
The Harare-Bindura-Shamva greenstone belt is intruded and circumscribed by various granitoid complexes. To the north and northeast, the Chinhamhora Igneous Complex comprises gneissic tonalite-granodiorite plutons. To the west, the Nyabira Complex includes granitised hornblende granodiorite intrusive that has intruded into the older leucotonalite/trondhjemite gneiss. To the south, the greenstones are bound by the Harare Granite. The earliest lithology in the Harare Complex is the Chinyika Tonalite, which was also intruded by the Harare Granite. In the east lies the Chikwaka Injection Complex, which essentially comprises migmatites. This complex terrain contains numerous greenstone xenoliths, comprising amphibolite, serpentinite, and granitite schist (GFM 2018).
Minor plutons such as the Chishawasha, intrude the interior of the Harare-Bindura-Shamva greenstone belt. The Maryvale porphyritic granite, and the Jumbo Porphyry and Granodiorite (north of Mazowe) are younger sub-volcanic intrusions into the metavolcano-sedimentary sequences of the Harare-Bindura-Shamva greenstone belt (GFM 2018).
Quartz gabbro dykes fill north-northeast striking fractures, which are parallel to the Great Dyke. Later Proterozoic igneous activity led to the intrusion of differentiated ultramafic/mafic bodies of the Manyika Event. The widespread ‘dolerite’ intrusions of the Mashonaland Event followed. These sills and dykes, which generally trend northeast to southwest, comprise tholeiitic dolerite/gabbro (GFM 2018).
| 6.3 | Local and Property geology |
The typical lithology of the Mazowe Granodiorite is a coarse, crystalline quartz-rich porphyritic granodiorite. Feldspar porphyries occur in the eastern to southern parts of the mine complex. They are typically dark grey or black in colour, with pronounced white phenocrysts of quartz and feldspar. To the east of the Property, feldspar porphyries grade into metabasaltic rocks. These are intercalated with BIF in places. Thin ultramafic units/lithologies are known to occur in the footwall of the Jumbo mineralised shear zone (GFM 2018).
There are three principal dyke systems at the Mazowe. In the Connaught Section, narrow basic dykes have intruded into the mineralised shear zones, often splitting them in two. Cutting across all the principal mineralised shear zone systems is a northeast-southwest trending quartz porphyry granite dyke. dipping at a shallow angle to the southeast with a width of approximately 5 m. The youngest dyke is a dolerite intrusion, which also cuts across the principal mineralised shear zones. This 7 m thick dyke has a dome-like form and dips flatly to the west in the Connaught to Bucks area, and flatly to the south in the Nucleus to Carnbrae area (GFM 2018).
| Project No PS213686 Mazowe Mine S-K 1300 Technical Report Summary Bulawayo Mining Company Limited | WSP January 2025 Page 24 |
Figure 6.2 presents a geological plan of the Mazowe area.
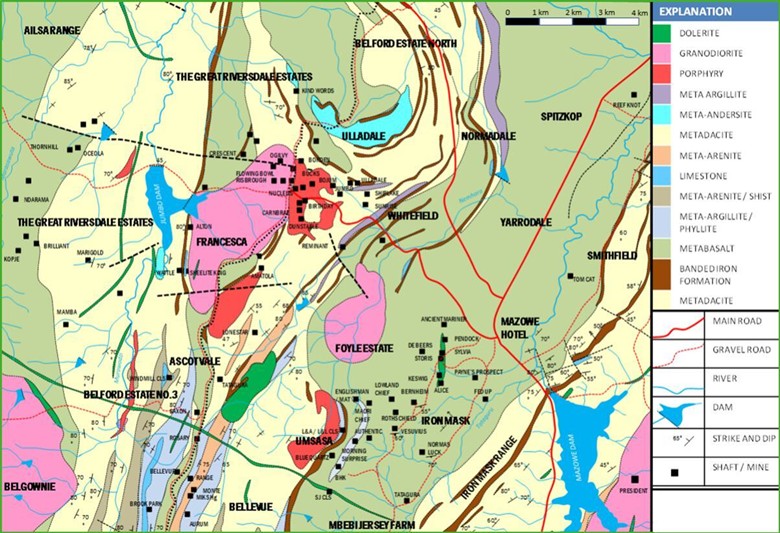
| Figure 6.2 | Local geology of the Mazowe area (GFM 2018) |
| Project No PS213686 Mazowe Mine S-K 1300 Technical Report Summary Bulawayo Mining Company Limited | WSP January 2025 Page 25 |
Figure 6.3 presents the local stratigraphy of the Mazowe area.
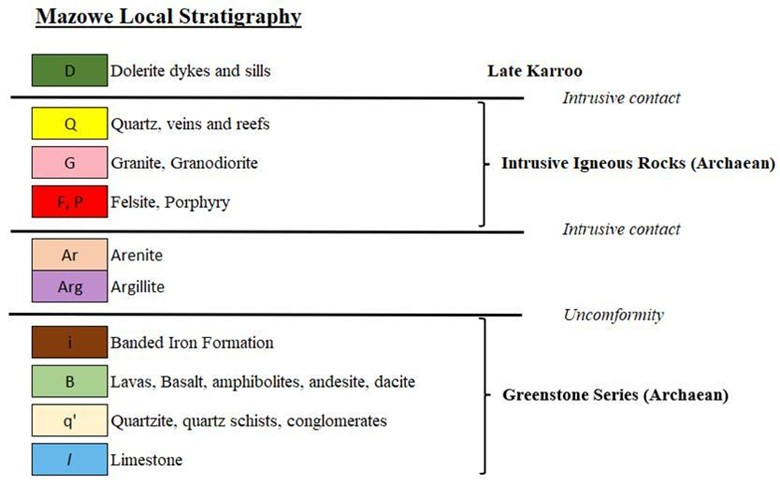
| Figure 6.3 | Local stratigraphy of the Mazowe area |
| 6.4 | Deposit type and geology |
The mineralisation at the MGM is collectively hosted by granodiorite stock and feldspar porphyries. These lithologies are host to a multitude of narrow, sub-parallel mineralised shear zones, which form an imbricate thrust shear zone system (GFM 2018).
| Project No PS213686 Mazowe Mine S-K 1300 Technical Report Summary Bulawayo Mining Company Limited | WSP January 2025 Page 26 |
To date more than 15 sub-parallel shear zones have been identified. These shear zones strike east-west and dip to the north at approximately 10 to 50° degrees. Slickenside lineations plunging 50° to the northeast are evident throughout the mine. From north to south, mining has exposed the following mineralised shear zones (GFM 2018):
| — | Flowing Bowl. |
| — | S.O.S. |
| — | Bucks. |
| — | Bojum/Wimbledon. |
| — | Connaught. |
| — | Nucleus. |
| — | Birthday. |
| — | Carnbrae. |
| — | Shear zones are generally separated by unsheared zones (lithons) of ± 30 m in width. |
These shear zones splay and link in an anastomosing pattern, along strike and down-dip, as demonstrated by the Nucleus Reef on lower levels. The east-west striking mineralised shear zones show dominantly reverse movement, with a component of sinistral oblique slip. Figure 6.4 presents a cross-section looking west through the main Property reefs.
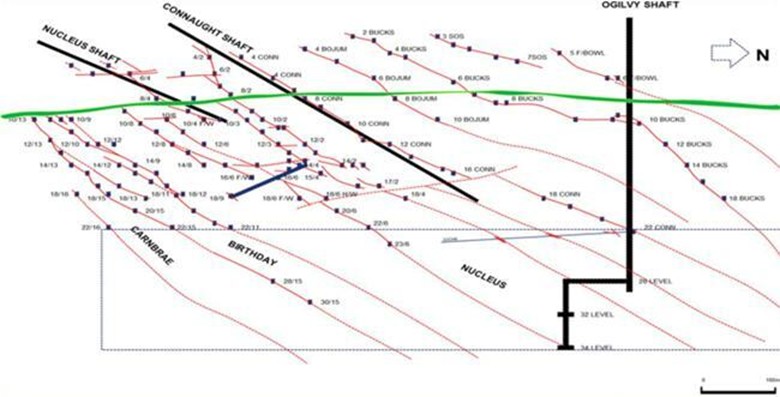
| Figure 6.4 | Cross-section looking west through the main Property reefs (GFM 2018) |
More recently, it has been noted that mineralised shear zones dip to the south at 5 to 25°. The north dipping mineralised shear zones are either displaced, or apparently terminated against the south dipping mineralised shear zones, suggesting that the latter are later features (GFM 2018).
The only major faults that displace the mineralised shear zones are strike-slip faults, one of which terminates the Nucleus and Birthday reefs at their eastern extremities. This fault has a sinistral reverse sense of displacement, indicating a strong likelihood that extensions to the Nucleus, and Birthday reefs may be present east of the fault (GFM 2018).
| Project No PS213686 Mazowe Mine S-K 1300 Technical Report Summary Bulawayo Mining Company Limited | WSP January 2025 Page 27 |
| 6.5 | Mineralisation |
The mineralisation at the MGM is collectively hosted by granodiorite stock, concentrated around the northeastern tip and extending eastwards into the feldspar porphyries, both with a similar style of mineralisation (GFM 2018).
Mineralisation varies somewhat with the type of country rock through which the mineralised shears zones pass. In most cases, gold is strongly associated with sulphide mineralisation and only to a limited degree with quartz veins. Typical quartz-pyrite mineralisation widths vary from less than 1 centimetre (cm) to approximately 20 cm, in shear zones of widths of ± 1 m (GFM 2018).
In the granodiorite, the principal sulphide is pyrite, which occurs in white to grey quartz. Scheelite, pyrrhotite and arsenopyrite also occur. Two ages of pyrite mineralisation are apparent, the oldest being a coarse crystalline pyrite, which is heavily fractured and intruded by younger quartz and pyrite. The younger pyrite is fine-grained or massive and contains myriads of quartz inclusions. Wall rock alteration of the east-west striking mineralised shear zones in the granodiorite is generally minor. Where shear zone splaying or anastomosing occurs however, the granodiorite is brecciated and saussuritised to a dark grey colour (GFM 2018).
In the porphyries, pyrrhotite becomes more abundant than pyrite and quartz is less common. Where sheared and mineralised, the feldspar porphyry is bleached and altered to a brownish colour (GFM 2018).
It is thought that the ore zones were formed by pulsating hydrothermal solutions, migrating along structurally controlled channels resulting from reverse dextral shearing in an imbricate thrust shear zone system (duplex) [GFM 2018].
| 7 | Exploration |
| 7.1 | Diamond drilling |
| 7.1.1 | Underground drilling |
Underground diamond core drilling is the primary drilling method employed at the MGM. Diamond drill core is logged and sampled, with sample length dictated by the width of the mineralised shear zone. One sample each of the barren hanging wall and footwall is also taken and submitted for assay (GFM 2018).
Core size drilled at the MGM is AXT (35.51 mm core diameter), with full core being sampled (GFM 2018).
All underground diamond drill holes are collar and downhole surveyed (GFM 2018).
Underground diamond drill holes and channel sample locations are located using offsets from survey pegs with a known location (GFM 2018).
| Project No PS213686 Mazowe Mine S-K 1300 Technical Report Summary Bulawayo Mining Company Limited | WSP January 2025 Page 28 |
Plan views of channel sample and drill hole collars are provided in Figure 7.1 and Figure 7.2 respectively.
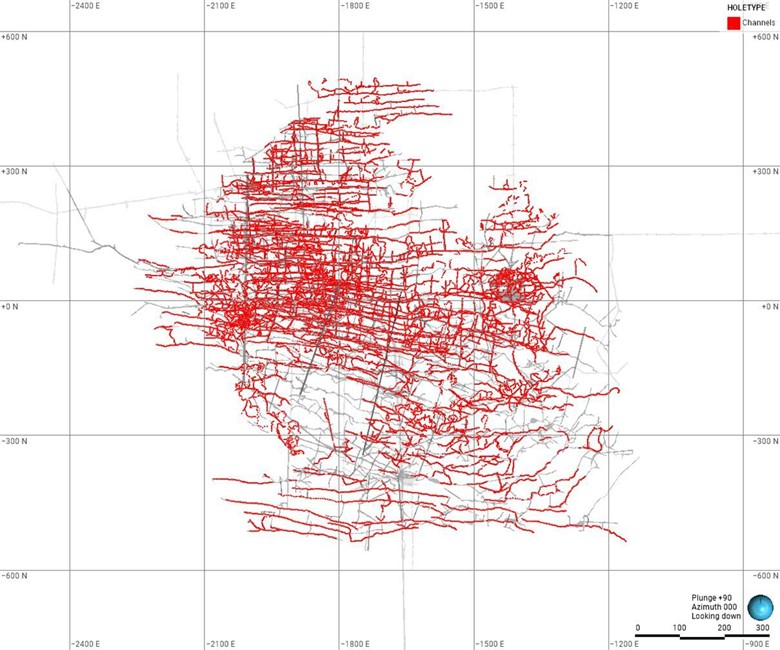
| Figure 7.1 | Plan view of channel samples and existing mine development |
| Project No PS213686 Mazowe Mine S-K 1300 Technical Report Summary Bulawayo Mining Company Limited | WSP January 2025 Page 29 |
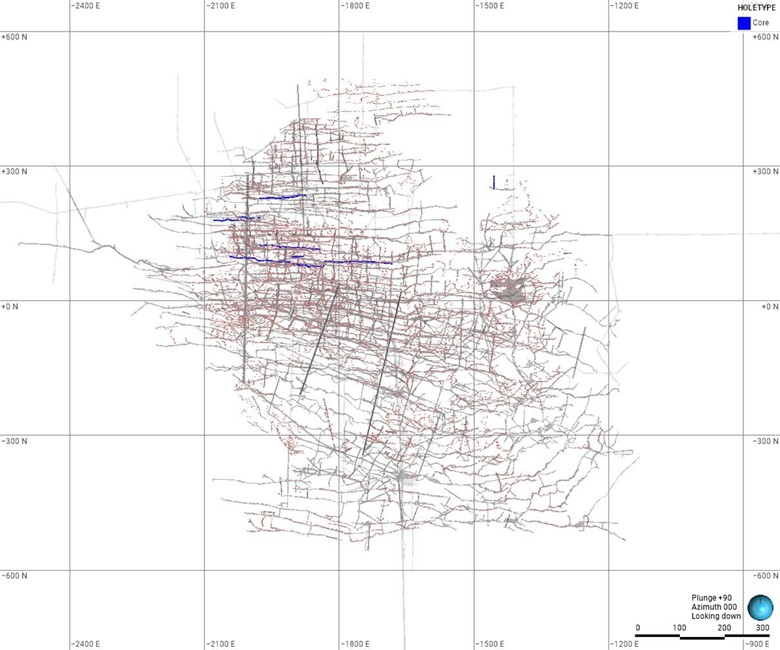
| Figure 7.2 | Plan view of drill hole collars and existing mine development |
| 7.1.2 | Surface drilling |
Wide spaced surface diamond drilling to explore near to and above 10 Level expressions of shear zones/reefs in the Jumbo East area was previously conducted. The drill holes completed were spaced at over 100 m.
| 7.2 | Amatola surface exploration |
Surface exploration consisting of a ground magnetic survey and Reverse Circulation (RC) drilling at was conducted on the Amatola Prospect during 2016 aimed at exploring the near surface gold resources with the potential for open pit mining (GFM 2016).
| Project No PS213686 Mazowe Mine S-K 1300 Technical Report Summary Bulawayo Mining Company Limited | WSP January 2025 Page 30 |
| 7.2.1 | Ground magnetic survey |
A high-resolution ground magnetic survey was conducted on the whole of Mazowe mining lease, starting with the area SW of Mazowe Mine, covering Carnbrae and Amatola old workings. The BIF situated in the central part of the survey area (through Amatola area) is the source of most of the magnetic readings (GFM 2016). Interpretations of the magnetic survey are shown in Figure 7.3 and Figure 7.4.
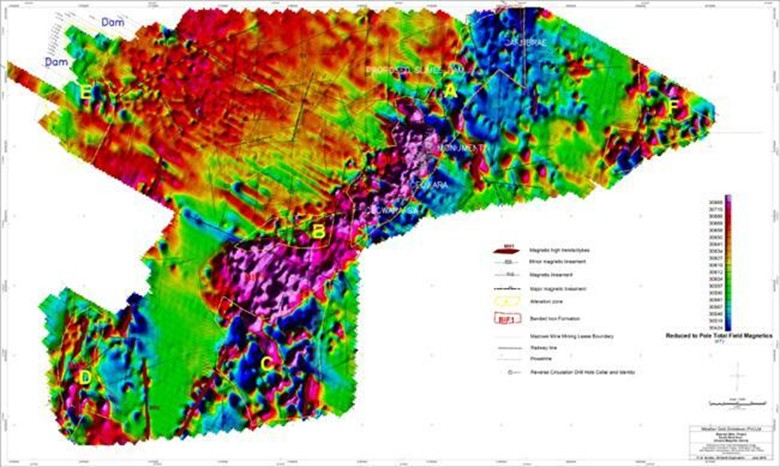
| Figure 7.3 | Mazowe SW reduced to pole total field magnetics with interpretation |
| Project No PS213686 Mazowe Mine S-K 1300 Technical Report Summary Bulawayo Mining Company Limited | WSP January 2025 Page 31 |
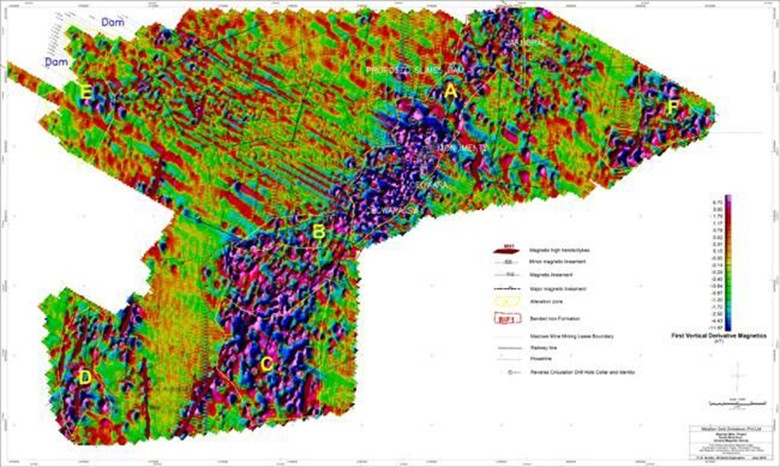
| Figure 7.4 | Mazowe SW first vertical derivative magnetics image with interpretation |
| Project No PS213686 Mazowe Mine S-K 1300 Technical Report Summary Bulawayo Mining Company Limited | WSP January 2025 Page 32 |
| 7.2.2 | RC drilling |
RC drilling was conducted on a grid design of 25 m on strike spacing by 20 m on dip spacing with infill drilling conducted depending on the style of mineralisation in order to fully evaluate the Prospects (GFM 2016).
| Table 7.1 | Summary of RC drilling |
| Prospect | Number of drill holes | Total meterage (m) | ||||||
| Monument | 42 | 1,701 | ||||||
| Ceowara | 57 | 2,280 | ||||||
| Ceowara SW | 47 | 2,197 | ||||||
Assay results from the Monument drilling were not favourable and the Prospect was considered not economically viable. Assay highlights from Ceowara and Ceowara SW are presented in Table 7.2 and Table 7.3.
| Table 7.2 | Assay highlights from Ceowara Prospect |
| DHID | Section | From (m) | To (m) | Intercept | Description | |||||
| CRC01 | CW10 | 10 | 13 | 3 m @ 28.7 g/t | Contact zone between fractured, oxidised banded iron formation and kaolinised felsite. | |||||
| 20 | 22 | 2 m @ 2.5 g/t | Ferruginised felsite showing some strong oxidation. | |||||||
| CRC03 | CW08 | 15 | 22 | 7 m @ 1.0 g/t | Contact zone between fractured, oxidised banded iron formation and strongly kaolinised felsite. | |||||
| CRC04 | CW07 | 21 | 23 | 2 m @ 1.3 g/t | Contact zone between altered banded iron formation and ferruginised felsite. | |||||
| CRC11 | CW11 | 20 | 22 | 2 m @ 1.4 g/t | Medium grained silicified felsitic unit with dense sulphide mineralisation plus chloritic alteration. | |||||
| 26 | 30 | 4 m @ 1.7 g/t | Strongly oxidised and fractured limonitic banded iron formation. Slightly chloritic. | |||||||
| CRC12 | CW09 | 15 | 20 | 5 m @ 1.5 g/t | Oxidised, fractured and limonitic banded iron formation. | |||||
| 24 | 25 | 1 m @ 3.7 g/t | Strongly kaolinised felsite. | |||||||
| CRC18 | CW07 | 21 | 24 | 3 m @ 1.7 g/t | Contact zone between altered banded iron formation and ferruginised felsite. | |||||
| CRC21 | CW06 | 21 | 26 | 5 m @ 1.9 g/t | Contact zone between altered banded iron formation and ferruginised felsite. | |||||
| CRC22 | CW08 | 18 | 23 | 5 m @ 1.6 g/t | Strongly ferruginised felsite. | |||||
| 27 | 28 | 1 m @ 1.2 g/t | Felsite. Silicified and chloritic where fractured. | |||||||
| 31 | 33 | 2 m @ 2.0 g/t | Felsite. Silicified and chloritic where fractured. Galena mineralisation. | |||||||
| CRC29 | CW04 | 0 | 10 | 10 m @ 1.5 g/t | Strongly oxidised and fractured limonitic banded iron formation. Slightly chloritic. | |||||
| 13 | 20 | 7 m @ 1.0 g/t | Strongly oxidised and fractured limonitic banded iron formation. Slightly chloritic. | |||||||
| CRC30 | CW08 | 14 | 16 | 2 m @ 1.4 g/t | Oxidised and moderately fractured banded iron formation. Slightly chloritic. | |||||
| CRC31 | CW07 | 18 | 30 | 12 m @ 1.6 g/t | Moderately to strongly oxidised, fractured and limonitic banded iron formation. | |||||
| CRC28 | CW04 | 12 | 25 | 13 m @ 3.4 g/t | Moderately to strongly oxidised, fractured and limonitic banded iron formation. | |||||
| CRC24 | CW06 | 9 | 14 | 5 m @ 18.0 g/t | Moderately to strongly oxidised, fractured and limonitic banded iron formation. | |||||
| 18 | 26 | 8 m @ 5.6 g/t | Moderately to strongly oxidised, fractured and limonitic banded iron formation. | |||||||
| CRC25 | CW06 | 12 | 15 | 3 m @ 1.0 g/t | Moderately to strongly oxidised silicified banded iron formation. | |||||
| 25 | 27 | 2 m @ 2.8 g/t | Contact zone between altered banded iron formation and ferruginised felsite. | |||||||
| CRC32 | CW06 | 15 | 19 | 4 m @ 1.2 g/t | Moderately to strongly oxidised, fractured and limonitic banded iron formation. | |||||
| 35 | 42 | 7 m @ 1.4 g/t | Moderately to strongly oxidised, fractured and limonitic banded iron formation. | |||||||
| CRC26 | CW05 | 18 | 21 | 3 m @ 2.5 g/t | Strongly ferruginised felsite. |
| Project No PS213686 Mazowe Mine S-K 1300 Technical Report Summary Bulawayo Mining Company Limited | WSP January 2025 Page 33 |
| Table 7.3 | Assay highlights from Ceowara SW Prospect |
| DHID | Section | From (m) | To (m) | Intercept | Description | |||||
| CRC27 | CW05 | 14 | 21 | 7 m @ 2.0 g/t | Moderately to strongly oxidised, fractured and limonitic banded iron formation. | |||||
| CRC34 | CW03 | 0 | 9 | 9 m @ 1.2 g/t | Moderately to strongly oxidised, fractured and slightly limonitic banded iron formation. | |||||
| CRC33 | CW07 | 34 | 35 | 1 m @ 1.0 g/t | Sheared and weathered slightly ferruginised felsites. | |||||
| CRC37 | CW10 | 21 | 28 | 7 m @ 1.6 g/t | Moderately to strongly oxidised, fractured and slightly limonitic banded iron formation. | |||||
| CRC41 | CW09 | 20 | 25 | 5 m @ 2.7 g/t | Moderately to strongly oxidized and fractured banded iron formation. | |||||
| 28 | 31 | 3 m @ 1.0 g/t | Moderately to strongly oxidised, fractured and slightly limonitic banded iron formation. | |||||||
| CRC40 | CW05 | 15 | 18 | 3 m @ 2.9 g/t | Strongly ferruginised and altered felsite. | |||||
| 35 | 42 | 7 m @ 1.9 g/t | Moderately to strongly oxidized and fractured banded iron formation. | |||||||
| CRC45 | CW06 | 0 | 9 | 9 m @ 1.3 g/t | Ferruginised felsite showing some strong oxidation and weakly limonitic. | |||||
| CRC39 | CW04 | 0 | 7 | 7 m @ 2.7 g/t | Moderately to strongly oxidised, fractured and slightly limonitic banded iron formation. | |||||
| 28 | 31 | 3 m @ 1.5 g/t | Silicified and slightly oxidised banded iron formation. | |||||||
| 36 | 38 | 2 m @ 1.0 g/t | Contact zone between altered banded iron formation and felsites with sulphide mineralisation. | |||||||
| CRC47 | CW08 | 21 | 28 | 7 m @ 6.6 g/t | Banded iron formation. Strongly oxidised, altered, moderately fractured, chloritic and weakly limonitic | |||||
| CRC48 | CW06 | 36 | 42 | 6 m @ 3.3 g/t | Banded iron formation. Strongly silicified and altered. Weakly fractured and chloritic in places. | |||||
| CRC49 | CW05 | 31 | 41 | 10 m @ 1.7 g/t | Strongly altered and oxidised banded iron formation. Moderately limonitic and silicified. | |||||
| CRC50 | CW09 | 24 | 33 | 9 m @ 5.1 g/t | Silicified and altered banded iron formation. Weakly limonitic and in contact with completely weathered and kaolinised felsite. | |||||
| CRC51 | CW10 | 4 | 9 | 5 m @ 1.1 g/t | Felsite. Completely weathered and oxidised. | |||||
| 25 | 34 | 9 m @ 74.1 g/t | Moderately to strongly silicified and oxidised banded iron formation. Fractured and limonitic. | |||||||
| CRC53 | CW11 | 35 | 38 | 3 m @ 4.9 g/t | Completely weathered and kaolinised felsite. Chloritic. | |||||
| CRC54 | CW11 | 22 | 23 | 1 m @ 1.3 g/t | Moderately to strongly silicified and oxidised banded iron formation. Fractured and limonitic. | |||||
| CWRC07 | CWSW03 | 2 | 6 | 4m @ 4g/t | Silicified felsite. Weakly to moderately ferruginised and slightly limonitic. | |||||
| 10 | 14 | 4m @ 1.7g/t | Felsite. Strongly oxidised and weakly to moderately kaolinised. | |||||||
| 18 | 31 | 13m @ 1.0g/t | Felsite. Sheared in places. Strongly oxidised and moderately limonitic. Slightly kaolinised in places. | |||||||
| 51 | 52 | 1m @ 4.4g/t | Strongly silicified felsite. Chloritic plus sulphide mineralisation. | |||||||
| CWRC08 | CWSW02 | 5 | 9 | 4m @ 1.0g/t | Contact from ferruginous schist going into moderately to strongly oxidised, fractured and slightly limonitic banded iron formation. | |||||
| 29 | 34 | 5m @ 1.1g/t | Fine to medium grained felsite. Moderately ferruginous and kaolinised in places. | |||||||
| 46 | 47 | 1m @ 3.5g/t | Silicified felsite. Sericitised and moderately ferruginous. | |||||||
| CWRC04 | CWSW04 | 0 | 6 | 6m @ 6.7g/t | Felsite. Oxidised and slightly fractured. Slightly sheared and chloritic. | |||||
| 55 | 60 | 5m @ 53.5g/t | Silicified felsite. Strongly chloritic plus sulphide mineralisation. White quartz inclusions at 57-58m with suphide mineralisation. | |||||||
| CWRC02 | CWSW06 | 8 | 11 | 3m @ 1.5g/t | Medium grained felsite. Sheared, sericitised and chloritic. | |||||
| CWRC09 | CWSW01 | 45 | 53 | 8m @ 3.2g/t | Strongly sheared and oxidised felsite. Chloritic and slightly limonitic in places. | |||||
| CWRC10 | CWSW03 | 25 | 26 | 1m @ 3.3g/t | Felsite. Slightly sheared and weakly kaolinised. |
| Project No PS213686 Mazowe Mine S-K 1300 Technical Report Summary Bulawayo Mining Company Limited | WSP January 2025 Page 34 |
| Table 7.3 | Assay highlights from Ceowara SW Prospect |
| DHID | Section | From (m) | To (m) | Intercept | Description | |||||
| CWRC15 | CWSW04 | 20 | 21 | 2m @ 1.1g/t | Moderately to strongly oxidised, fractured and slightly limonitic banded iron formation. | |||||
| 35 | 36 | 1m @ 1.9g/t | Moderately to strongly oxidised, fractured and slightly limonitic banded iron formation. | |||||||
| CWRC17 | CWSW06 | 12 | 17 | 5m @ 2.1g/t | Felsite. Sheared and ferruginous in fractured zones. Moderately limonitic. | |||||
| CWRC11 | CWSW02 | 40 | 43 | 3m @ 3.0g/t | Moderately altered and silicified felsite. Slightly chloritic. | |||||
| CWRC13 | CWSW00 | 10 | 11 | 1m @ 1.3g/t | Metabasalt. Strongly chloritic and silicified. | |||||
| 48 | 54 | 6m @ 2.3g/t | Completely weathered and oxidized metabasalt plus quartz veining at 51-82m. | |||||||
| 57 | 63 | 6m @ 2.1g/t | Completely weathered plus moderately altered and fractured metabasalt with sulphide mineralisation. | |||||||
| CWRC20 | CWSW06 | 13 | 15 | 2m @ 1.3g/t | Strongly oxidised and moderately ferruginised felsite. Weakly limonitic and fractured in places. | |||||
| 20 | 24 | 4m @ 1.2g/t | Strongly silicified felsite. Slightly chloritic. | |||||||
| CWRC23 | CWSW01 | 3 | 16 | 13m @ 1.3g/t | Moderately to strongly altered and weathered metabasalt. Chloritic plus quartz veining in places. | |||||
| 27 | 35 | 8m @ 7.5g/t | Strongly sheared and chloritic metabasalt. Strongly altered. | |||||||
| CWRC25 | CWSW04 | 0 | 4 | 4m @ 2.9g/t | Strongly oxidised and fractured banded iron formation plus silicified and kaolinised felsite in places. | |||||
| 43 | 50 | 7m @ 11.5g/t | Sheared and silicified banded iron formation. Chloritic and moderately limonitic. | |||||||
| CWRC28 | CWSW06 | 42 | 45 | 3m @ 3.0g/t | ||||||
| CWRC31 | CWSW08 | 0 | 10 | 10m @ 2.6g/t | Sheared weakly to moderately ferruginised felsite. Slightly limonitic and fractured in places. | |||||
| 25 | 32 | 7m @ 2.2g/t | Weakly to moderately ferruginised felsite. Slightly limonitic and fractured in places. Oxidised. | |||||||
| CWRC32 | CWSW07 | 3 | 11 | 8m @ 3.4g/t | Felsite. Moderately oxidized plus chloritic alteration. Weakly limonitic and ferruginous. | |||||
| 19 | 20 | 1m @ 1.1g/t | Sheared felsite. Moderately chloritic and kaolinised. | |||||||
| 23 | 43 | 20m @ 5.6g/t | Weakly to moderately ferruginised felsite. Moderately limonitic and fractured in places. Oxidised. | |||||||
| CWRC33 | CWSW08 | 0 | 8 | 8m @ 1.0g/t | Strongly silicified banded iron formation. Altered in places. In contact with sheared and oxidized felsite. | |||||
| CWRC38 | CWSW05 | 12 | 19 | 7m @ 1.1g/t | Completely weathered and kaolinised chloritic felsite. | |||||
| CWRC39 | CWSW01 | 9 | 11 | 2m @ 14.1g/t | Massive metabasalt. Chloritic and epidotised. | |||||
| 28 | 35 | 7m @ 2.8g/t | Ferruginised felsite. Oxidised, sericitised and limonitic. | |||||||
| CWRC40 | CWSW07 | 25 | 28 | 3m @ 5.19g/t | Silicified, chloritic and epidotised felsite plus pyrite mineralisation. | |||||
| 48 | 49 | 1m @ 7.78g/t | strongly silicified and moderately chloritic felsite plus minor sulphide mineralisation in places. | |||||||
| CWRC41 | CWSW08 | 0 | 9 | 9m @ 1.0g/t | Silicified felsite. Moderately limonitic and chloritic. Weakly ferruginised. | |||||
| 23 | 24 | 1m @ 1.1g/t | Silicified felsite plus strong sulphide mineralisation. Dark greyish. | |||||||
| CWRC42 | CWSW06 | 3 | 10 | 7m @ 2.7g/t | Moderately to strongly silicified and oxidised banded iron formation. Fractured and limonitic. | |||||
| CWRC43 | CWSW05 | 9 | 14 | 5m @ 0.1g/t | ||||||
| CWRC46 | CWSW01 | 14 | 16 | 2m @ 3.3g/t | Strongly sheared, oxidised and altered metabasalt. Completely weathered and oxidised in places. |
| Project No PS213686 Mazowe Mine S-K 1300 Technical Report Summary Bulawayo Mining Company Limited | WSP January 2025 Page 35 |
| 7.3 | QP’s opinion |
The QP considers the data collected including method of collection and storage to be appropriate for the preparation of geological models and Mineral Resources estimates, and that the data has been considered during resource classification. Historical mining areas adopted a combination of limited drilling and resource definition by level, raise and winze development, channel sampling, face sampling and mapping.
| 8 | Sample preparation, analyses, and security |
| 8.1 | Sampling techniques |
The following types of samples are used at the MGM for Mineral Resources estimation (GFM 2018)
| 8.1.1 | Core sampling |
Gold content data is obtained from AXT drill core (35.51 mm core diameter) samples. Underground exploration drilling is used to confirm the up and down-dip extensions of the mineralised shear zones as well as lateral extensions of parallel mineralised shear zones (GFM 2018).
For underground exploration drill holes intersecting mineralised shear zones, full core is sampled and sent for assay, with sample length dictated by the width of the mineralised shear zone. Sample lengths vary between a minimum length of 6 cm and a maximum length of 60 cm. One sample each of the barren hanging wall and footwall is also taken and submitted for assay (GFM 2018).
In the event of a thin stringer being intersected, a sample is taken to include both hangingwall and footwall contacts. Assay results are documented on the drill hole log sheets where a composite value is calculated for this type of intersection. The information is then transferred onto 1:500 scale survey/geology plans (GFM 2018).
Mineral Resource estimation for the high-nugget gold style mineralisation present at the Property is not based solely on diamond drill hole samples. The Property’s technical staff have found that diamond drill hole samples are widely spaced, small in size (sometimes less than 10 cm), and at times the diamond drill hole may have actually missed the reef it was planned to intersect, due to complexities caused by vein structure and geometry etc. Hence the additional dependency on channel samples, which are generally closely spaced along strike when compared to diamond drill holes (GFM 2018).
| 8.1.2 | Channel sampling |
The estimated gold content of the mineralised shear zone is ascertained by way of diamond saw samples cut 2 cm x 2 cm over lengths dictated by the width of the mineralised shear zone, with a minimum of 2 cm and a maximum of 60 cm. This technique was initiated to replace older chip sampling techniques with what is considered a more reliable method (GFM 2018).
In drives and sub-levels, channels are cut at a 2 m interval perpendicular to the mineralised shear zone strike, on the southern side wall/footwall of the development. Haulages/cross-cuts are all sampled at a 2 m interval (GFM 2018).
Often 2 cm depth is not achieved, and the channel being cut is uneven. Due to the nature of the mineralisation being characterised by a high nugget effect, a large sample is required for samples to be representative. To this end, a larger sample can be achieved through increasing the channel width to 4 cm (GFM 2018).
The sampling protocol also focusses on quality rather than quantity only of the samples taken. The geological contacts are sharp, hence, sample lengths along the channel are determined according to geology. Additional data is added through sampling where required (GFM 2018).
Gold assays returned from the laboratory are reported to two decimal places, with the lowest reported value being 0.04 g/t Au. Values less than 0.04 g/t Au are reported as half detection limits. Only composite channel values are transferred onto assay plans (GFM 2018).
| Project No PS213686 Mazowe Mine S-K 1300 Technical Report Summary Bulawayo Mining Company Limited | WSP January 2025 Page 36 |
| 8.1.3 | Grab samples |
Grab samples are taken from box holes, tramming level tips and chutes. Scoops of broken material are collected from the centre and four corners of each cocopan. Samples collected are put into a container and at the end of the shift, each sample is mixed, quartered and submitted for assay as part of a grade monitoring program. These samples are not used for Mineral Resource estimation but for validation purposes (GFM 2018).
| 8.1.4 | Sample security |
Underground channel, diamond drill core, and grab samples from loading chutes and cars are taken to the on-site assay laboratory, which is situated in the security-controlled area of the mine (GFM 2018).
| 8.1.5 | Dry bulk density determination |
MMC Zimbabwe determined dry bulk density (BD) by collecting and analysing stope samples. A total of 103 samples were collected and analysed. Samples were analysed in the MGM on-site assay laboratory using Archimedes’ Principle (GFM 2018). Full results are presented in GFM (2018).
The method used was as follows (GFM 2018):
| — | Samples roasted in a drier to remove moisture. |
| — | Samples weighed, and the mass of the sample determined, using an electronic balance (scale). |
| — | Samples tied to a thin, strong length of string, and lowered gradually into water in a measuring cylinder until entirely submerged. |
| — | Displaced volume of water calculated by subtracting the initial reading from the final reading. |
| — | BD = Weight of Sample/Volume of Water Displaced by the Sample. |
Mean values returned a BD value of 2.90 grams per cubic centimetre (g/cm3) for Mazowe. These values were utilised for Mineral Resource estimation. Since Q2 2003, BD values have also been determined from diamond drill core reef intersections (GFM 2018).
| 8.2 | Sample preparation, analyses, and procedures |
The MGM on-site assay laboratory is capable of assaying 150 samples per day, which translates to 210 fusions. Fusions are treated in batches of 35, known as a “fire”, thus translating to a total of six fires per day. Other assays completed daily include 30 solutions and 10 carbons using Atomic Absorption Spectrometer (AAS) [Varian SpectrAA 50B] (GFM 2018).
The following analyses are completed: carbon assaying, solution samples analysis, and bullion assaying (GFM 2018).
Once sample preparation is complete, dependent on the sample type being assayed, the following procedures are undertaken: crushing, pulverising, fluxing, fusion, cupellation, parting, washing, and annealing (GFM 2018).
| 8.3 | Quality Assurance Quality Control |
High-grade internal standards are produced from representative mill feeds, whilst low-grade internal standards are produced from CIL tails and waste rock. These samples were sent to S. Museka Lab. Consultancy Services (SML), Harare, Zimbabwe, where they were thoroughly and homogeneously mixed and split. Representative samples were then sent to different laboratories to determine assay values, which are then averaged. Samples from these standards are regularly sent through the assay stream for the purpose of monitoring the performance of the assay process. In addition, blanks are put into the stream to monitor contamination (GFM 2018).
External standards are procured from ROCKLABS New Zealand and other reputable sources. These standards are also into our systems for the purpose of monitoring the performance of the assay process. Internally, reference materials acquired from various sources are also used (GFM 2018).
| Project No PS213686 Mazowe Mine S-K 1300 Technical Report Summary Bulawayo Mining Company Limited | WSP January 2025 Page 37 |
The following Quality Assurance Quality Control Analysis (QAQC) procedures are utilised at the MGM (GFM 2018):
| 8.3.1 | Channel sampling |
| — | Once CRM sample (either a standard or a blank) is inserted for every bench sampled or one in every twelve samples. |
| — | All CRM samples are tested for compliance to set tolerance ranges, typically ± 2 SD from the designated mean value. |
| — | Assay batches that are rejected are subjected to either re-assay or discarded with appropriate qualifications e.g., contamination, sample ticket mix up and transcription errors etc. |
| — | Channel sampling assay data is routinely subjected to validation by way of scatter and regression plots. |
| 8.3.2 | Core sampling |
| — | For every 10 samples of diamond drill core, at least one Certified Reference Material (CRM) sample (either a standard or a blank) is inserted into the sampling stream. |
| — | Core being sampled is halved, with one half of the core taken for assay and the other half being stored in the core library as a duplicate. For cases where the core splitter is not functioning, full core is sampled, and the resultant pulp is stored in the core library as a duplicate. |
| — | If the tenth drill core sample is a blank, then the twentieth sample becomes a standard and the thirtieth becomes a duplicate. This cycle is on occasion rotated to avoid predictability of results. |
| — | All CRM samples are tested for compliance to set tolerance ranges, typically ± 2 standard deviations (SD) from the designated mean value. |
| — | Assay batches that are rejected are subjected to either re-assay or discarded with appropriate qualifications e.g., contamination, sample ticket mix up and transcription errors etc. |
| — | Core drilling assay data is routinely subjected to validation by way of scatter and regression plots. |
| 8.3.3 | Grab sampling |
| — | At least one CRM sample (either a standard or a blank) is inserted per day for each main tramming level. |
| — | All CRM samples are tested for compliance to set tolerance ranges, typically ± 2 SD from the designated mean value. |
| — | Assay batches that are rejected are subjected to either re-assay or discarded with appropriate qualifications e.g., contamination, sample ticket mix up and transcription errors etc. |
| — | Grab sampling assay data is routinely subjected to validation by way of scatter and regression plots. |
| 8.3.4 | General guidelines |
| — | A minimum of fifteen CRM samples (standards and/or blanks) are submitted every month. |
| — | All standards, blanks and duplicates are recorded in the site QAQC book along with the sampling date, mean value, assay value and SD. |
| — | The Section Geologist compiles a QAQC report as part of the site weekly report. |
| — | All assay data is subjected to QAQC iterations i.e., line graphs and regression plots and is analysed for compliance with the set tolerance ranges, typically ± 2 SD from the designated mean value. |
| — | For any other sampling projects carried out on surface or underground, outside of the normal sampling processes, CRM samples are inserted and analysed for compliance with set tolerance ranges, typically ±2 SD from the designated mean value. Anomalous results are handled in the same manner that core drilling, grab sample and channel samples are handled. |
| 8.4 | QP’s opinion on adequacy |
The QP considers the QAQC, and security protocols used at the Property to be appropriate in regard to the data used in the preparation of Mineral Resources estimates, and that the data has been considered during resource classification.
| Project No PS213686 Mazowe Mine S-K 1300 Technical Report Summary Bulawayo Mining Company Limited | WSP January 2025 Page 38 |
| 9 | Data verification |
| 9.1 | Mineral Resources verification |
| 9.1.1 | Data verification conducted by MMC Zimbabwe |
Data validation conducted by MMC Zimbabwe was done so using Microsoft Excel, inbuilt Vulcan™ software validation tools, physical checks, and correction of any erroneous input data to ensure completeness, and integrity of captured data. Transcription errors were checked, identified, and corrected through direct comparison of captured data with data sources such as assay plans, and diamond drill core log sheets. Drill hole collar locations and elevations were inspected, verified and corrected in Vulcan™. MMC Zimbabwe staff also conducted visual validation of the block models developed (GFM 2018).
| 9.1.2 | Data verification conducted by WSP |
The QP has validated the following geological and Mineral Resources estimation data:
| — | Drill hole collar locations. |
| — | Drill hole downhole survey. |
| — | Sampling techniques. |
| — | Development wireframes. |
| — | Resource wireframes. |
| — | Block models. |
| — | Mineral Resource tonnages and grades. WSP selected a number of wireframes (and accompanying block models) with the highest contained metal content for spot checks. Tonnages and grades were extracted using Vulcan™ tools, and the results were compared with tonnages and grades contained within the MGM block listing Excel workbook provided MMC Zimbabwe. |
Some errors were identified in drill hole locations, survey, validity of the wireframes, and cases of missing blocks within resource wireframes, shown in Table 9.1 and Figure 9.1.
Table 9-1 Summary of drill hole database errors
| Drill hole Errors | Number of Errors | |
| No co-ordinates | 825 drill holes | |
| Duplicate drill holes | 1,271 drill holes | |
| Same survey location | 25 drill holes | |
| No downhole survey data | 550 drill holes | |
| Samples with no to/from depths | 3,628 samples | |
| From depth ≥ to depth | 4 samples | |
| Sample depth exceeds collar max-depth | 2 samples | |
| Overlapping intervals | 198 samples |
| Project No PS213686 Mazowe Mine S-K 1300 Technical Report Summary Bulawayo Mining Company Limited | WSP January 2025 Page 39 |
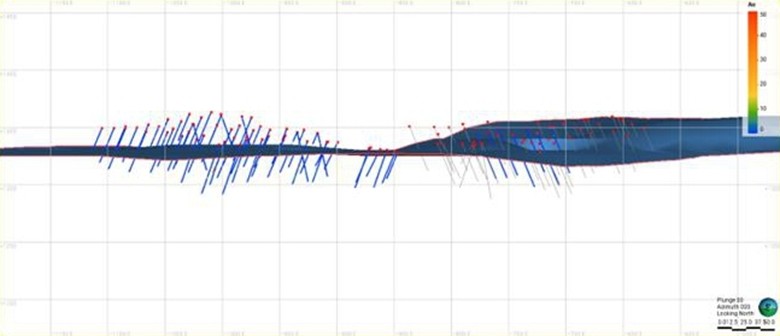
| Figure 9.1 | Section showing all drill holes above the MGM topographic surface |
| 9.1.3 | Limitations on Mineral Resources data verification |
The QP was not directly involved in the exploration drilling, and sampling programs that formed the basis for collecting the data used in the geological modelling and Mineral Resources estimates for the Property, and was unable to observe drilling, sampling, and sample preparation methods at the MGM during the personal inspection (Section 2.4).
The QP is not aware of any other limitations on nor failure to conduct appropriate data verification.
The QP has validated the data presented in Section 9.1, including collar survey, down hole geological data and observations, sampling, analytical, and other test data underlying the information or opinions contained in the written disclosure presented in this TRS. The QP has presented information relating to uncertainty in the estimates of Inferred, Indicated, and Measured Mineral Resources (Section 11.5), and opinions on factors likely to influence the prospect of economic extraction. A comprehensive list of Mineral Resources interpretations and conclusions, and Mineral Resources recommendations have also been presented in Sections 22.1, and 23.1 respectively.
Notwithstanding these matters, the QP considers the data used is acceptable for the purposes of geological modelling and Mineral Resources estimation.
| 9.2 | Mining and Mineral Reserves data verification |
While MGM has been under C&M since 2018, using the data provided by MMC Zimbabwe, the following has been conducted as spot checks on the June 2018 historical reserve estimate:
| — | Six stopes with the highest declared reserves have been selected for spot checks. Tonnage and grade were extracted through interrogation of Reserves Wireframes and Block Model provided using Deswik mining software. Some inconsistencies in reported estimates were noted, judged as not material to the total estimate. |
| — | Dilution was also estimated through the provided Mineral Reserve Excel block listing. |
| — | The QP considers the data suitable for the purposes of preparing the mine design, mine schedule, and Mineral Reserves estimate. |
| 9.3 | Geotechnical data verification |
Based on the documentation supplied to WSP, no geotechnical logging, or sampling has been conducted.
| Project No PS213686 Mazowe Mine S-K 1300 Technical Report Summary Bulawayo Mining Company Limited | WSP January 2025 Page 40 |
Large rockfalls occurred on 28 October 2014 and 21 January 2015, prompting a rock engineering review conducted by SRK Consulting (South Africa) (Pty) Ltd (SRKSA) in 2015. This review included the calculation of a Q rating using the Barton’s Q-system for rock mass classification. The Q rating for the typical host rock at MGM can be estimated as follows (SRKSA 2015):
| — | Rock Quality Designation (RQD) = 100. |
| — | Number of joint sets (Jn) = 0.5 to 2. |
| — | Roughness of the most unfavourable joint or discontinuity (Jr) = 2 to 4. |
| — | Degree of alteration or filling along the weakest joint (Ja) = 1. |
| — | Water inflow (Jw) = 1. |
| — | Stress condition given as the stress reduction factor (SRF) = 1. |
The Q rating for typical host rock ranges between 100 and 800 (Class A, extremely good to exceptionally good) [SRKSA 2015].
In the opinion of the QP, the geotechnical data used to inform design parameters is of adequate quality for the Property and its material types and for the purposes used in this TRS.
| Project No PS213686 Mazowe Mine S-K 1300 Technical Report Summary Bulawayo Mining Company Limited | WSP January 2025 Page 41 |
| 9.4 | Hydrology and hydrogeology data verification |
No specific hydrological or hydrogeological studies have been undertaken by MMC Limited for the MGM. The following is a general characterisation of the MGM area.
The MGM is located within the Upper Mazowe Sub-Catchment of the Mazowe Catchment. Figure 9.2 shows the various Zimbabwe catchments, and Figure 9.3 shows the mean annual rainfall within the Mazowe catchment.
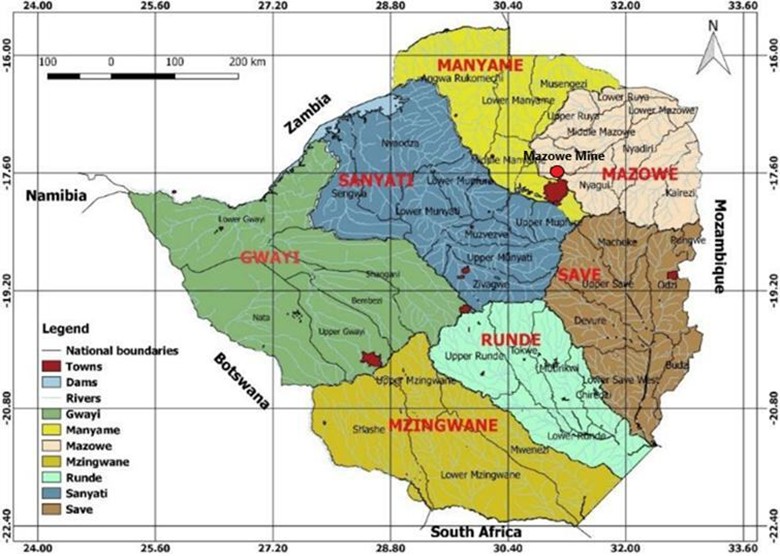
| Figure 9.2 | Catchment boundaries of Zimbabwe (BMC Limited) |
| Project No PS213686 Mazowe Mine S-K 1300 Technical Report Summary Bulawayo Mining Company Limited | WSP January 2025 Page 42 |
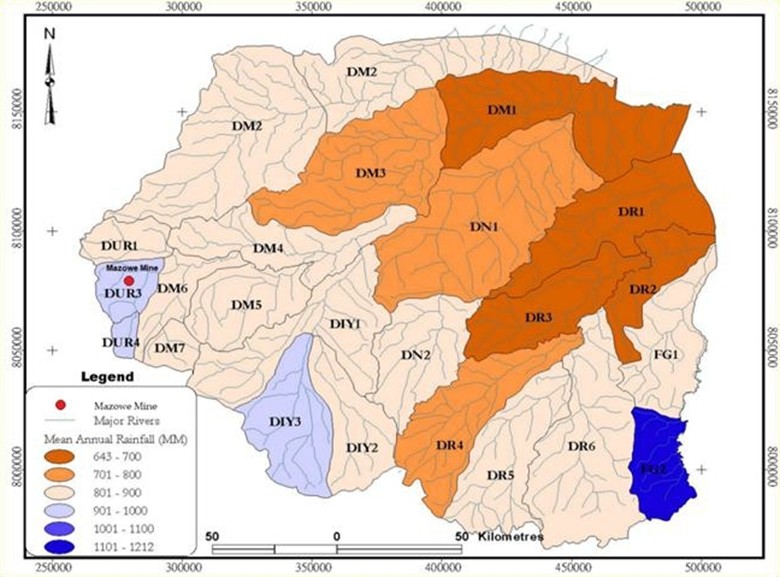
| Figure 9.3 | Mean annual rainfall within the Mazowe catchment (Waterkings 2014) |
| 9.4.1 | Hydrology |
The MGM is located within the hydrological sub-zone DUR3 of Upper Mazowe sub-catchment of Mazowe catchment. The area has a Mean Annual Run-off (MAR) of 164 mm and a Coefficient of Variation (CV) of 90%, thus there is a great variation in the run-off that is experienced from year to year. The mine is upstream of the Jumbo dam that has a capacity of 20,941 megalitres (Ml). The Jumbo dam is along the Murowodzi River. Murowodzi River drains into Mazowe River after Glendale. Annual rainfall at Jumbo is around 850 mm and is characterised by mid-season dry spells. Maximum temperatures average 27°C and evaporation is 1,800 mm per annum (Waterkings 2014).
Drainage within the area is characterised by a system of seasonal streams, flowing east into the perennial Mazowe River and west into the Murowodzi River. The Mazowe and Murowodzi drainage systems are separated by a watershed that has a general north to south trend. To the North, the Murowodzi River cuts at right angles across the general north and south trend of the country and flows eastwards to join the Mazowe River, this easterly trend continuing for over 64 km to Shamva. The Murowodzi, together with its main tributaries the Garumapudzi, Marasauta and Watakai rivers, show a rather striking easterly turn in their lower courses. The Murowodzi River flows through a relatively broad valley, the eastern part of which is studded with irregular hills standing 90 to 120 m above the valley level. On the western side the Mashavi hills separate the Murowodzi from the Garumapudzi drainage. Small tributary streams have cut back into the Mashavi hills and subsequent streams have still further helped to dissect the range, creating several longitudinal valleys (Waterkings 2014).
| Project No PS213686 Mazowe Mine S-K 1300 Technical Report Summary Bulawayo Mining Company Limited | WSP January 2025 Page 43 |
To the south of the northern boundary of Riversdale Estate, the Watakai River cuts a fairly well-defined gorge through a low gap in the hills and flows eastwards, with the Marasauta River joining from the south, to the Murowodzi River. Both these streams follow a northerly course before reaching the gorge. The Marasauta River is separated from the Murowodzi by rather low hills, but the hills separating the Watakai and Marasauta rivers attain an altitude of over 1,440 m. West of the Mashavi hills the land slopes rather gradually to the Garumapudzi River, in the valley of which the granite contact lies. In the extreme north-west, a spur projects from the Mashavi hills towards the highest point, Nsorodoni, and the Guramapudzi River makes quite a narrow gorge between them. The river then makes its sharp turn to the east and continues in that direction to the Murowodzi River (Waterkings 2014).
| 9.4.2 | Hydrogeology |
The Mazowe River rises 14 km north of Harare at an altitude of approximately 530 amsl. It flows in a northerly direction until its confluence with the Murodzi River 59 km downstream. Thereafter it flows in a general north-easterly direction until it crosses the border with Mozambique at an altitude of approximately 400 amsl. The river has a catchment area of 20,774 km2 and thus occupies the bulk of the area under consideration (Waterkings 2014).
The geology of Mazowe catchment is primarily crystalline basement rocks that typically have a low primary permeability and low porosity. The groundwater occurrence in the catchment is either structurally controlled or confined to weathered overburden. The average regolith thickness is generally less than 20 m (Waterkings 2014). Groundwater in the regolith is under unconfined conditions and the aquifers are frequently laterally discontinuous and highly heterogeneous. The saprolite that is produced by the chemical weathering of granites can have porosities of between 15-30% and is generally not a suitable aquifer due to low permeabilities (Waterkings 2014).
Fracturing, faulting and weathering control the groundwater occurrence. In general, the amount of fracturing decreases with depth (Waterkings 2014). Potential groundwater development of Mazowe Catchment formations are presented in Table 9.2.
| Table 9-2 | Groundwater development potential of formations occurring in the Mazowe Catchment |
| Lithology | Groundwater Development Potential |
Water Table Depth (m) |
Borehole Yield (m3/day) | |||
| Gneiss and young intrusive granite on the African surface | Low | < 10 | 50–100 | |||
| Gneiss and young intrusive granite on post African and Pliocene surface | Low | < 10 | 10–50 | |||
| Mafic metavolcanics (Greenstone) | Moderate | 10-20 | 10–250 | |||
| Acid metavolcanics (Greenstone) | Low | < 10 | 10–25 | |||
| Dolerite dykes and sills | Moderate | < 10 | 25–100 |
Source: Interconsult A/S 1984 (Waterkings 2014).
In the opinion of the QP, the data used to inform the groundwater models is of adequate quality.
In the opinion of the QP, this data is adequate for use in the mine design and mine schedules, and for the purposes used in this TRS.
| 9.5 | Processing and recovery methods data verification |
The process plant remains on C&M. Process historical data and performance are provided under Section 10.
In the opinion of the QP, the processing and recovery methods data used to inform product predictions are adequate for the purposes used for this TRS.
| Project No PS213686 Mazowe Mine S-K 1300 Technical Report Summary Bulawayo Mining Company Limited | WSP January 2025 Page 44 |
| 10 | Mineral processing and metallurgical testing |
Not applicable since this TRS is an Initial Assessment and no Mineral Reserves have been estimated.
Any future estimation of Mineral Reserves and potential recommencement of operations will require the support of an additional drilling and resource definition campaign and at least a pre-feasibility to feasibility level of evaluation.
Recommencement of the underground ore process operations will require as feasibility study prior to significant refurbishment, upgrade and/or replacement of the existing underground ore processing plant.
Disputed ownership of the sand process facility will need to be resolved prior to recommencement of operations. A feasibility study and significant refurbishment and capital upgrades will also be required to address significant underperformance when previously operated in 2017-2018.
| 10.1 | Nature and extent of mineral processing and metallurgical testing |
The MGM underground ore processing plant, which was commissioned in the 1950s (and following various modifications), comprises a single processing facility with two separate sections, these being an underground ore processing section with design capacity of 132 ktpa and a low-grade dump or sands re-processing facility. Extraction is via crushing and milling, leading to gravity concentration, conventional cyanidation and adsorption, prior to elution, electro-winning and smelting (SRK 2012). Refer to the plant flowsheet provided in Figure 14.1.
The low-grade dump or sands re-processing facility (the subject of a legal ownership dispute) is a flotation plant commissioned in 2017 which has a capacity to process 780 ktpa when the plant is operating optimally, however, this rate has not been realized (Virimai 2018). This process adopts flotation of sulphides which are then directed to cyanide leach. Refer to the plant flowsheet provided in Figure 10.1.
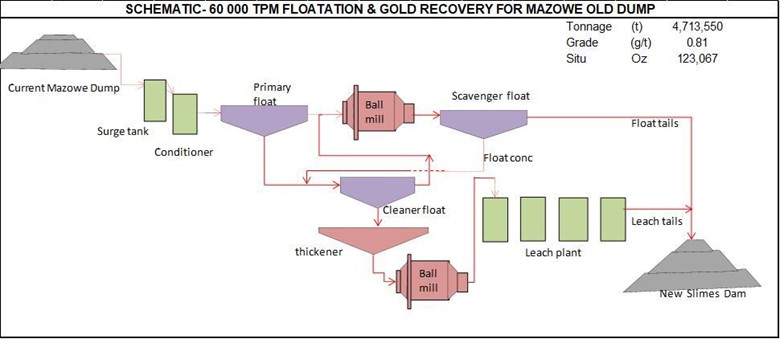
| Figure 10.1 | MGM Sands flotation and CIL plant flowsheet |
| Project No PS213686 Mazowe Mine S-K 1300 Technical Report Summary Bulawayo Mining Company Limited | WSP January 2025 Page 45 |
For calendar year 2018 (the MGM was placed on C&M in August 2018), the MGM underground ore processing plant processed approximately 16 kt at a grade of 2.69 g/t Au to produce 706 oz of gold and 545 oz of silver. Gold metallurgical recovery recorded for the period was 100.0% as the result of positive reconciliation due to plant clean up. Historically the underground ore processing plant has averaged 80-85%. The underground ore processing section is old and in poor condition. It will require significant refurbishment prior to any recommencement of operations.
Construction and commissioning of the 780 ktpa gold concentrator and associated facilities was undertaken by Baldmin SA and handed over to MMC in September 2017. In October 2017, Gold Fields of Mazowe contracted Suntech Geomet Laboratories to assist in optimisation of the circuit so as to improve gold recoveries which had dropped to below 50% against a target above 70% (Suntech, 2017). The optimisation program was designed to tackle challenges within the comminution and flotation circuits and identified reasons for poor plant performance due to:
| — | Poor grind of the sands which were sometimes as low as 40% passing 75 μm versus a target of 80% passing 75 μm. |
| — | Poor cyclone efficiencies because of low slurry pressure caused by numerous 90°. |
| — | Inefficient trash removal prior to flotation. |
| — | Poor mechanical agitation. |
| — | Low plant availabilities due to recurring breakdowns and slurry pipe blockages – blockages were a result of poor pipe design as well as misplacement of valves and the pumps. |
| — | Poor slurry rheology creating blockages due to poor discharge pipe design. |
| — | Insufficient flotation stages on secondary rougher cells where only 3 stages are installed but where 4 flotation stages are required. |
The Sands plant poor recoveries of less than 50% at less than half plant design throughput contributed to the decision to place MGM on care on maintenance in August 2018. The plant and associated dump were sold off by the business administrator but are currently the subject of litigation to secure ownership. As a consequence, the Sands plant was not inspected by the QP during the May 2024 site visit, but it is likely that it will require significant refurbishment.
At the time the MGM was placed on C&M, the TSF was near capacity and nearing decommissioning, hence, a new TSF will be required if the MGM is to be taken off C&M and production is resumed (Virimai 2018).
| 10.2 | Metallurgical sampling representativity |
| 10.2.1 | Underground ore testwork |
The QP considers that the historical operation of the underground ore process plant provides a guide to future recovery at the rate of 80-85% that is reasonably representative of ore types processed. This recovery might be improved with construction of a new plant with a finer grind size and modern technology. No recent metallurgical testwork relating to underground ore was available for review.
| 10.2.2 | Sands testwork |
Testwork was undertaken for the Sands process plant which demonstrated potential recoveries ranging from 81% to 92% at target grind sizes of 80% passing 75 μm.
| Project No PS213686 Mazowe Mine S-K 1300 Technical Report Summary Bulawayo Mining Company Limited | WSP January 2025 Page 46 |
Samples for the flotation pilot trials was collected from the dump sites at Mazowe plant and Arcturus mine metallurgical laboratory. These samples were homogenised before sampling for head grade and the rest of the sample was used in the testwork. A total of 21 trials was conducted in different stages:
| — | Concentrate production (laboratory). |
| — | Scouting tests (laboratory). |
| — | Field pilot tests optimisation (at mine). |
Results from the testing are shown in Table 10.1.
| Table 10-1 | Test conditions and results for flotation |
| Scouting | Optimisation Grind | |||||||||||||||
| Item | Unit | Concentrate Production |
Current Arising |
Thickener Underflow |
New Reagents |
70% | 75% | 80% | ||||||||
| Date | 20/09/2013 | 24/09/2013 | 26/09/2013 | 16/09/2013 | 16/09/2013 | 16/09/2013 | 16/09/2013 | |||||||||
| Milling Time | mins | 41 | 25 | 25 | 41 | 20 | 31 | 41 | ||||||||
| Condition time | mins | 3 | 3 | 8 | 3 | 3 | 3 | 3 | ||||||||
| Rougher float 1 | 8 | 8 | 8 | 8 | 8 | 8 | 8 | |||||||||
| Rougher float 2 | 20 | 20 | 20 | 15 | 15 | 15 | 15 | |||||||||
| Cleaner float | - | - | - | 25 | - | - | - | |||||||||
| No. of tests | 7 | 5 | 3 | 3 | 1 | 1 | 1 | |||||||||
| Reagents used | A, B, C* | A, B, C, D | A, B, C | A, B, C, E, F, G, H, I | A, B, C, D | A, B, C, D | A, B, C, D | |||||||||
| Overall weight | Kg | 56 | 40 | 24 | 96 | 16 | 16 | 16 | ||||||||
| Ph | 8.5 | 8.5 | 8.5 | 8.5 | 8.5 | 8.5 | 8.5 | |||||||||
| Grind < -75µm | % | 80 | 80 | 80 | 80 | 70 | 75 | 80 | ||||||||
| Head assay | g/t | 0.92 | 0.39 | 2.21 | 1.29 | 1.29 | 1.29 | 1.29 | ||||||||
| Conc. grade | g/t | 4.38 | 2.06 | 12.32 | 14.70 | 10.81 | 4.07 | 4.50 | ||||||||
| Residue grade | g/t | 0.19 | 0.09 | 0.17 | 0.10 | 0.55 | 0.15 | 0.13 | ||||||||
| Conc. Mass pull | % | 16.79 | 15.60 | 14.48 | 2.05 | 10.08 | 18.40 | 19.60 | ||||||||
| Recovery | % | 82.75 | 81.13 | 92.32 | 92.47 | 68.97 | 86.08 | 89.09 | ||||||||
Notes: All assays are based on Performance laboratory which is an ISO certified independent laboratory.
* Key: A = SNPX, B = SK 42, C = XP 200, D = FeSO4, E = FLOAT, F = SK 49, G = UNICOL, H = AERO 3418A, I = OREPREP 501, J = OREPREP 515, K = AREO 3302, L = XP 2A, M = CuSO4.
The total of 21 trials conducted have produced excellent results with recoveries as high as 92%. The dump also upgraded well from an average head grade of 1.32 g/t to a concentrate grade of over 10g/t. The grind optimisation process also improved concentrate grades from around 86% at 70% passing -75 µm to nearly 90% at 80% passing -75 µm. Workable mass pulls ranging from 10% to nearly 20% also rendered the results favourable. The new reagents combination which improved overall floatability recovery to between 91-95% was used in the production plant.
| 10.3 | Details of analytical or testing laboratories |
Sample analysis for underground ore mining and processing was completed at the onsite laboratory located at Mazowe (refer to Section 8.2).
The entire testwork programme for Sands re-processing was supervised and coordinated with Suntech Geomet Lab in Johannesburg (South Africa). For laboratory tests, samples collected from the dump were couriered to their laboratory in Johannesburg.
| Project No PS213686 Mazowe Mine S-K 1300 Technical Report Summary Bulawayo Mining Company Limited | WSP January 2025 Page 47 |
| 10.4 | Recovery estimates |
The QP considers that the old underground ore process plant delivers recoveries that have historically averaged 80–85% as a guide to potential future process recovery. No deleterious elements have been highlighted for underground sourced ore. A finer grind size and circuit operating efficiencies may improve recoveries.
The previous Sands process plant (2017–18) achieved recoveries of less than 50% at only 50% of target throughput. Originally, the process plant targeted 60 thousand tonnes per month (ktpm) at an average 80% recovery over the LOM. The predicted recoveries and throughputs for any restart of Sand processing will need to be reviewed in line with the commissioning report undertaken by Suntech in 2017.
In both cases, a feasibility study followed by significant plant refurbishment and/or replacement will also be necessary.
| 10.5 | QP’s opinion on adequacy of the data collected |
The QP considers that historical operation provides a guide to anticipated recoveries and throughputs; however, the adequacy of projected recoveries and throughput rates will require confirmation prior to any recommencement of process operations, including:
| — | A feasibility study prior to significant refurbishment, upgrade and/or replacement of the existing underground ore processing plant. |
| — | Legal resolution of the disputed ownership of the sand process facility and sands dump. |
| — | Additional metallurgical testwork may be required as part of the feasibility evaluation. |
| Project No PS213686 Mazowe Mine S-K 1300 Technical Report Summary Bulawayo Mining Company Limited | WSP January 2025 Page 48 |
| 11 | Mineral Resource estimates |
| 11.1 | Key assumptions, parameters, and methods |
| 11.1.1 | Care and maintenance |
There has been no mining or exploration conducted since the mine was placed on C&M in April 2019. In the interim, the mine has flooded to approximately 50 m below surface. Therefore, in the QP’s opinion the 2018 assumptions regarding definition of the Mineral Resource base remain current.
| 11.1.2 | Resource database |
Data captured in Vulcan™ includes the following (GFM 2018):
| — | Survey data (drives, stopes, raises and pegs). Survey data acquisition is by way of a total station, in the Lo29 grid. |
| — | Orebody outlines digitised from assay plans. |
| — | Assay values, sample lengths, and co-ordinates (channel, drill core and sludge samples). |
| 11.1.3 | Geological interpretation |
Mineralised shear zones at the MGM are clearly distinguishable as zones of quartz-sulphide mineralisation with well-defined, sharp, and discrete contacts. None of these features are present in the country rock (GFM 2018).
| 11.1.3.1 | Geological modelling – Vulcan™ |
Polygons were generated and digitised on screen from level and/or sub-level plans, based on channel and drilling assay information and knowledge of the characteristics of the mineralised shear zones at the time of reporting. The generated polygons were then used to create three-dimensional (3D) shapes (GFM 2018).
A minimum width of 0.87 m for Mazowe (GFM 2018).
| 11.1.4 | Data preparation |
Assay data from the geological database was regularised through data compositing in Vulcan™ to provide a consistent sample support. Compositing followed a two-staged approach. Data was initially coded using geological reef interpretation and composited geologically using the interpreted reef zone. The majority of the composited reef samples were less than 0.80 m wide (0.80 m is the historically achievable minimum minable width). The second stage of data compositing involved adjusting the composited samples to at least the minimum minable width (dilution grading 0.0 g/t Au was used in the width adjustments). Data compositing reduced the inherent variability that existed within the population, and also generated sample lengths more appropriate to the scale of the mining method (GFM 2018).
| 11.1.5 | Exploratory data analysis |
To reflect/account for the variation in distribution of assay information, estimates were prepared for each individual reef. Samples within a specific reef were analysed using statistical methods in Microsoft Excel. The major source of data used in the estimates were channel samples. Like many gold deposits, generally, the Mazowe assay data display a near-lognormal distribution with a positive skew, implying that the sample data consists of relatively fewer but significant high-grade assay values. The bulk of samples sit in the medium to lower grade range. COG were determined using statistical methods (GFM 2018).
| Project No PS213686 Mazowe Mine S-K 1300 Technical Report Summary Bulawayo Mining Company Limited | WSP January 2025 Page 49 |
| 11.1.5.1 | Univariate statistics |
A summary of the statistical analysis performed on the samples within the economic mineralisation envelope is presented in Table 11.1.
| Table 11-1 | Univariate statistics for samples within the economic mineralisation envelope (GFM 2018) |
| Reef | Mean | Median | SD | Skewness | Min | Max | Count | CV | Threshold | |||||||||
| 8ConnHW | 28.48 | 13.89 | 49.25 | 6.80 | 0.01 | 579.01 | 261 | 1.73 | 126.99 | |||||||||
| 4-19L Conn Main | 13.91 | 5.00 | 24.72 | 4.17 | 0.01 | 263.66 | 5,071 | 1.78 | 63.36 | |||||||||
| 6-3ConnHW3 | 8.81 | 3.90 | 15.06 | 4.03 | 0.03 | 105.63 | 2.94 | 1.71 | 38.92 | |||||||||
| 4ConnHW1 | 14.48 | 8.03 | 18.29 | 2.45 | 0.20 | 98.80 | 192 | 1.26 | 51.07 | |||||||||
| 10ConnFW | 9.67 | 4.34 | 14.62 | 3.46 | 0.05 | 96.96 | 145 | 1.51 | 38.91 | |||||||||
| 4-9LBirthday | 14.28 | 3.65 | 35.19 | 6.01 | 0.01 | 372 | 458 | 2.46 | 84.66 | |||||||||
| 10-18Birthday13 | 19.68 | 8.05 | 37.50 | 6.30 | 0.01 | 529.20 | 912 | 1.91 | 94.68 | |||||||||
| 18-30Birthday15 | 19.20 | 7.47 | 40.1 | 7.26 | 0.01 | 651 | 1,416 | 2.09 | 99.41 | |||||||||
| 18LBirthday15FW | 7.91 | 3.30 | 11.21 | 2.76 | 0.01 | 83.01 | 308 | 1.42 | 30.34 | |||||||||
| Birthday11 12L_18L | 9.45 | 5.08 | 11.61 | 2.43 | 0.09 | 86.91 | 569 | 1.23 | 32.67 | |||||||||
| Birthday12 14L-18L | 11.10 | 5.94 | 14.95 | 3.15 | 0.09 | 103.42 | 577 | 1.35 | 41.00 | |||||||||
| Birthday9-6L-7L | 9.00 | 3.60 | 14.42 | 3.08 | 0.26 | 80.90 | 183 | 1.60 | 37.84 | |||||||||
| 4-7SOS | 9.66 | 4.51 | 14.97 | 3.66 | 0.01 | 126.97 | 604 | 1.55 | 39.60 | |||||||||
| 5-14L Nucleus2 | 20.65 | 7.05 | 37.68 | 4.42 | 0.01 | 451.21 | 1,972 | 1.82 | 96.02 | |||||||||
| 6-13L Nucleus3 | 17.04 | 6.05 | 26.76 | 2.87 | 0.01 | 180.30 | 627 | 1.57 | 70.56 | |||||||||
| 17L Nucleus2 HW1 | 10.05 | 6.50 | 10.59 | 1.58 | 0.01 | 46.31 | 77 | 1.05 | 31.24 | |||||||||
| 6-18Nucleus4 | 17.58 | 6.47 | 34.92 | 4.88 | 0.01 | 357.48 | 1,192 | 1.99 | 87.42 | |||||||||
| Nucleus4 16_18FW1 | 7.47 | 4.30 | 10.13 | 7.07 | 0.50 | 137.47 | 339 | 1.36 | 27.73 | |||||||||
| Nucleus6 12_23L | 14.26 | 5.15 | 27.57 | 4.84 | 0.01 | 297.19 | 4,647 | 1.93 | 69.41 | |||||||||
| Nucleus6 14-17FW2 | 16.72 | 6.96 | 24.98 | 2.80 | 0.18 | 155.78 | 493 | 1.49 | 66.67 | |||||||||
| Nucleus6 14-16FW | 14.47 | 6.40 | 19.93 | 2.70 | 0.19 | 120.00 | 241 | 0.73 | 54.34 | |||||||||
| Nucleus2 HW | 24.43 | 10.34 | 37.46 | 3.01 | 0.01 | 256.30 | 391 | 1.53 | 99.35 | |||||||||
| Nucleu2-16L-17L | 6.43 | 3.81 | 6.97 | 1.82 | 0.01 | 37.73 | 140 | 1.08 | 20.37 | |||||||||
| 4Main Bucks | 15.54 | 5.80 | 18.97 | 1.51 | 0.15 | 79.08 | 70 | 1.22 | 53.49 | |||||||||
| 5Main Bucks | 28.77 | 8.55 | 37.08 | 1.40 | 0.01 | 168.76 | 146 | 1.29 | 102.93 | |||||||||
| 4BucksHW | 13.09 | 5.14 | 17.47 | 1.89 | 0.01 | 81.19 | 190 | 1.33 | 48.03 | |||||||||
| 6L-8L Bucks FW | 1026 | 6.02 | 13.31 | 3.45 | 0.01 | 128.98 | 978 | 1.30 | 36.89 | |||||||||
| 4-10L Bucks E8 | 22.14 | 7.70 | 41.26 | 5.48 | 0.01 | 612.56 | 1,223 | 1.86 | 104.66 | |||||||||
| 1-18Old Bucks | 12.27 | 3.80 | 21.05 | 3.60 | 0.01 | 194.69 | 2,986 | 1.72 | 54.37 |
| Project No PS213686 Mazowe Mine S-K 1300 Technical Report Summary Bulawayo Mining Company Limited | WSP January 2025 Page 50 |
| Reef | Mean | Median | SD | Skewness | Min | Max | Count | CV | Threshold | |||||||||
| 4-8L Wimbledon Main | 6.69 | 2.52 | 11.36 | 3.50 | 0.01 | 82.56 | 397 | 1.70 | 29.40 | |||||||||
| 4_6L Wimbledon FW | 8.52 | 5.11 | 9.25 | 1.88 | 0.01 | 48.74 | 188 | 1.09 | 27.02 | |||||||||
| 8WimbledonEx-Conn | 5.10 | 2.96 | 6.17 | 2.07 | 0.01 | 26.71 | 54 | 1.21 | 17.44 | |||||||||
| 3-10L Bojum | 33.01 | 6.48 | 96.39 | 5.72 | 0.01 | 1,009.1 | 1,679 | 2.92 | 225.79 | |||||||||
| 8Bojum West | 7.12 | 4.92 | 7.36 | 1.83 | 0.01 | 33.06 | 63 | 1.03 | 21.84 | |||||||||
| 5-6L Bojum HW | 17.43 | 12.82 | 17.04 | 1.59 | 0.09 | 79.97 | 203 | 0.98 | 51.51 | |||||||||
| Southerly Reef | 13.16 | 6.03 | 20.64 | 3.75 | 0.01 | 168.74 | 190 | 1.57 | 54.44 | |||||||||
| 7Flowing Bowl HW | 1096 | 4.89 | 16.03 | 2.64 | 0.01 | 93.88 | 362 | 1.46 | 43.02 | |||||||||
| 4L Commonwealth | 8.68 | 4.80 | 10.96 | 3.51 | 0.01 | 92.65 | 311 | 1.26 | 30.59 | |||||||||
| Canbrea Reef | 13.36 | 6.89 | 16.65 | 2.5 | 0.01 | 123.78 | 338 | 1.26 | 46.48 |
| 11.1.5.2 | Geostatistical analysis |
Experimental semi-variograms in the three mutually perpendicular directions (strike, dip and plunge) were prepared using individual reef datasets and modelled to derive estimation parameters (BMC Limited).
| 11.1.5.3 | High-grade cutting |
Table 11.2 presents the top-cut thresholds applied to gold grades, which are based on the 95th percentile of the sample population. MMC Zimbabwe established these values by conducting statistical analysis and generating cumulative frequency histograms for all reefs estimated (Golder 2020).
| Table 11-2 | Top-cut grades applied by MMC Zimbabwe |
| Reef | 95% Top-Cut Grade (Au g/t) | Sampling Methodology | ||
| Nucleus 2 | 400 | Diamond saw sampling | ||
| Nucleus 3 | 340 | Diamond saw sampling | ||
| Nucleus 4 | 140 | Chip sampling | ||
| Nucleus 5 | 65 | Chip sampling | ||
| Nucleus 6 | 90 | Diamond saw sampling | ||
| Birthday | 385 | Diamond saw sampling | ||
| Connaught | 195 | Diamond saw sampling | ||
| G/Williams | 75 | Diamond saw sampling | ||
| H/Chief | 35 | Diamond saw sampling | ||
| Vesuvius | 40 | Diamond saw sampling |
| Project No PS213686 Mazowe Mine S-K 1300 Technical Report Summary Bulawayo Mining Company Limited | WSP January 2025 Page 51 |
| 11.1.6 | Dry bulk density |
MMC Zimbabwe determined dry BD by collecting and analysing stope samples. A total of 103 samples were collected and analysed. Samples were analysed in the MGM on-site assay laboratory using Archimedes’ Principle (GFM 2018). Full results are presented in GFM (2018).
The method used was as follows (GFM 2018):
| — | Samples roasted in a drier to remove moisture. |
| — | Samples weighed, and the mass of the sample determined using an electronic balance (scale). |
| — | Samples tied to a thin, strong length of string, and lowered gradually into water in a measuring cylinder until entirely submerged. |
| — | Displaced volume of water calculated by subtracting the initial reading from the final reading. |
| — | BD = Weight of Sample/Volume of Water Displaced by the Sample. |
Mean values returned a BD value of 2.90 grams per cubic centimetre (g/cm3) for Mazowe. These values were utilised for Mineral Resource estimation. Since Q2 2003, BD values have also been determined from diamond drill core reef intersections (GFM 2018).
| 11.1.7 | Block models |
A total of 40 non-rotated block models were developed. Table 11.3 presents the block dimension schemes for the 30 June 2018 block models.
| Table 11-3 | Block dimension schemes for 30 June 2018 block models (GFM 2018) |
| Parent block dimensions | Sub-block dimensions | |||||||||||||||||||||||
| Reef | X (m) | Y (m) | Z (m) | X (m) | Y (m) | Z (m) | ||||||||||||||||||
| 8ConnHW | 4 | 2 | 4 | 2 | 2 | 2 | ||||||||||||||||||
| 4-19L Conn Main | 4 | 2 | 4 | 2 | 1 | 2 | ||||||||||||||||||
| 6-3ConnHW3 | 4 | 2 | 4 | 2 | 2 | 2 | ||||||||||||||||||
| 4ConnHW1 | 4 | 2 | 4 | 2 | 2 | 2 | ||||||||||||||||||
| 10ConnFW | 4 | 2 | 4 | 2 | 2 | 2 | ||||||||||||||||||
| 4-9LBirthday | 2 | 2 | 2 | 2 | 1 | 1 | ||||||||||||||||||
| 10-18Birthday13 | 2 | 2 | 2 | 1 | 1 | 0.5 | ||||||||||||||||||
| 18-30Birthday15 | 2 | 2 | 2 | 1 | 1 | 1 | ||||||||||||||||||
| 18LBirthday15FW | 4 | 2 | 4 | 1 | 1 | 1 | ||||||||||||||||||
| Birthday11 12L_18L | 4 | 2 | 4 | 1 | 1 | 1 | ||||||||||||||||||
| Birthday12 14L-18L | 4 | 2 | 4 | 1 | 1 | 1 | ||||||||||||||||||
| Birthday9-6L-7L | 2 | 2 | 2 | 1 | 1 | 1 | ||||||||||||||||||
| 4-7SOS | 4 | 2 | 4 | 2 | 2 | 2 | ||||||||||||||||||
| 5-14L Nucleus2 | 2 | 2 | 2 | 1 | 1 | 0.5 | ||||||||||||||||||
| 6-13L Nucleus3 | 4 | 2 | 4 | 1 | 1 | 1 | ||||||||||||||||||
| Project No PS213686 Mazowe Mine S-K 1300 Technical Report Summary Bulawayo Mining Company Limited | WSP January 2025 Page 52 |
| Parent block dimensions | Sub-block dimensions | |||||||||||||||||||||||
| Reef | X (m) | Y (m) | Z (m) | X (m) | Y (m) | Z (m) | ||||||||||||||||||
| 17L Nucleus2 HW1 | 4 | 2 | 4 | 2 | 1 | 2 | ||||||||||||||||||
| 6-18Nucleus4 | 2 | 2 | 2 | 1 | 1 | 0.5 | ||||||||||||||||||
| Nucleus4 16_18FW1 | 4 | 2 | 4 | 1 | 1 | 1 | ||||||||||||||||||
| Nucleus6 12_23L | 4 | 2 | 4 | 2 | 1 | 2 | ||||||||||||||||||
| Nucleus6 14-17FW2 | 4 | 2 | 4 | 2 | 1 | 2 | ||||||||||||||||||
| Nucleus6 14-16FW | 4 | 2 | 4 | 2 | 1 | 2 | ||||||||||||||||||
| Nucleus2 HW | 2 | 2 | 2 | 1 | 1 | 0.5 | ||||||||||||||||||
| Nucleu2-16L-17L | 4 | 2 | 4 | 2 | 1 | 2 | ||||||||||||||||||
| 4Main Bucks | 4 | 2 | 4 | 1 | 1 | 1 | ||||||||||||||||||
| 5Main Bucks | 4 | 2 | 4 | 2 | 2 | 2 | ||||||||||||||||||
| 4BucksHW | 4 | 2 | 1 | 2 | 1 | 2 | ||||||||||||||||||
| 6L-8L Bucks FW | 4 | 2 | 4 | 1 | 1 | 1 | ||||||||||||||||||
| 4-10L Bucks E8 | 4 | 2 | 4 | 1 | 1 | 1 | ||||||||||||||||||
| 1-18Old Bucks | 4 | 2 | 4 | 1 | 1 | 1 | ||||||||||||||||||
| 4-8L Wimbledon Main | 4 | 2 | 4 | 2 | 2 | 2 | ||||||||||||||||||
| 4_6L Wimbledon FW | 2 | 2 | 2 | 1 | 1 | 0.5 | ||||||||||||||||||
| 8WimbledonEx-Conn | 4 | 2 | 4 | 2 | 1 | 2 | ||||||||||||||||||
| 3-10L Bojum | 2 | 2 | 2 | 1 | 1 | 0.5 | ||||||||||||||||||
| 8Bojum West | 2 | 2 | 2 | 1 | 1 | 1 | ||||||||||||||||||
| 5-6L Bojum HW | 4 | 2 | 4 | 2 | 1 | 2 | ||||||||||||||||||
| Southerly Reef | 4 | 2 | 4 | 1 | 1 | 1 | ||||||||||||||||||
| 7Flowing Bowl HW | 2 | 2 | 2 | 1 | 1 | 0.5 | ||||||||||||||||||
| 4L Commonwealth | 2 | 2 | 2 | 1 | 1 | 0.5 | ||||||||||||||||||
| Carnbrae Reef | 4 | 2 | 4 | 2 | 2 | 2 | ||||||||||||||||||
| 8ConnHW | 4 | 2 | 4 | 2 | 2 | 2 | ||||||||||||||||||
| 11.1.8 | Grade interpolation parameters |
Ordinary Kriging (OK), using parameters obtained from the modelling of semivariograms was used for grade estimation. Mining blocks, pillars, and remnants tonnages and grades were reported using constraining triangulations (GFM 2018).
Table 11.4 presents a summary of the kriging parameters used for block grade estimation.
| Project No PS213686 Mazowe Mine S-K 1300 Technical Report Summary Bulawayo Mining Company Limited | WSP January 2025 Page 53 |
| Table 11-4 | Grade interpolation parameters for 30 June 2018 block models (GFM 2018) |
| Reef | No.
of Structures | Type
of Structure | Nugget | Sill Differential | Major Radius (m) | Semi- major Radius (m) | Minor Radius (m) | Z’ Rotation (bearing) [º] | Y’ Rotation (plunge) [º] | ||||||||||||||||||||||||||
| 8ConnHW | 1 | spherical | 11.6 | 22.6 | 14 | 7 | 2 | 271 | 0.8 | ||||||||||||||||||||||||||
| 4-19L Conn Main | 1 | spherical | 52 | 39.4 | 13 | 10 | 2 | 274 | 1 | ||||||||||||||||||||||||||
| 6-3ConnHW3 | 1 | spherical | 5.86 | 5.02 | 17 | 14 | 2 | 276 | 1.2 | ||||||||||||||||||||||||||
| 4ConnHW1 | 2 | spherical | 20.6 | 21.7 | 13 | 15 | 2 | 278 | -0.7 | ||||||||||||||||||||||||||
| spherical | 0.122 | 14 | 12 | 2 | 91 | -1.0 | |||||||||||||||||||||||||||||
| 10ConnFW | 1 | spherical | 2.21 | 29.6 | 16 | 8 | 2 | 270 | -2 | ||||||||||||||||||||||||||
| 4-9LBirthday | 1 | spherical | 4.18 | 3.56 | 17 | 15 | 2 | 267 | 0.3 | ||||||||||||||||||||||||||
| 10-18Birthday13 | 3 | spherical | 140 | 87 | 25 | 15 | 2 | 267 | -1 | ||||||||||||||||||||||||||
| 17 | 15 | 2 | 269 | -1 | |||||||||||||||||||||||||||||||
| 17 | 15 | 2 | 268 | 0 | |||||||||||||||||||||||||||||||
| 18-30Birthday15 | 1 | spherical | 74 | 49.3 | 15 | 12 | 2 | 269 | 0.5 | ||||||||||||||||||||||||||
| 18LBirthday15FW | 1 | spherical | 46.2 | 83 | 17 | 15 | 2 | 270 | 0.4 | ||||||||||||||||||||||||||
| Birthday11 12L_18L | 1 | spherical | 42.6 | 30 | 16 | 9 | 2 | 259 | -1.2 | ||||||||||||||||||||||||||
| Birthday12 14L-18L | 1 | spherical | 124 | 99.6 | 13 | 8 | 2 | 269 | -0.3 | ||||||||||||||||||||||||||
| Birthday9-6L-7L | 1 | spherical | 2.84 | 39.4 | 17 | 8 | 2 | 271 | 1.5 | ||||||||||||||||||||||||||
| 4-7SOS | 1 | spherical | 18.7 | 41.8 | 19 | 9 | 2 | 242 | -0.5 | ||||||||||||||||||||||||||
| 5-14L Nucleus2 | 1 | spherical | 112 | 68.2 | 12 | 11 | 2 | 270 | -0.5 | ||||||||||||||||||||||||||
| 6-13L Nucleus3 | 2 | spherical | 141 | 170 | 12 | 9 | 2 | 92 | 0 | ||||||||||||||||||||||||||
| spherical | 0.1 | 13 | 8 | 2 | 265 | 0 | |||||||||||||||||||||||||||||
| 17L Nucleus2 HW1 | 1 | spherical | 27.8 | 25.7 | 17 | 8 | 2 | 93 | 0 | ||||||||||||||||||||||||||
| 6-18Nucleus4 | 1 | spherical | 107 | 79 | 17 | 10 | 2 | 96 | 0 | ||||||||||||||||||||||||||
| Nucleus4 16_18FW1 | 1 | spherical | 10.7 | 16.7 | 15 | 12 | 2 | 280 | -0.1 | ||||||||||||||||||||||||||
| Nucleus6 12_23L | 2 | spherical | 87.5 | 48.1 | 13 | 15 | 2 | 289 | -1.6 | ||||||||||||||||||||||||||
| spherical | 1.1 | 14 | 15 | 2 | 270 | -0.3 | |||||||||||||||||||||||||||||
| Nucleus6 14-17FW2 | 1 | spherical | 108 | 64.6 | 13 | 12 | 2 | 277 | 0 | ||||||||||||||||||||||||||
| Nucleus6 14-16FW | 1 | spherical | 70.3 | 73.8 | 13 | 11 | 2 | 272 | 0 | ||||||||||||||||||||||||||
| Nucleus2 HW | 1 | spherical | 250 | 220 | 6 | 10 | 2 | 90 | -1 | ||||||||||||||||||||||||||
| Nucleu2-16L-17L | 1 | spherical | 8.91 | 4.67 | 16 | 11 | 2 | 100 | -1 | ||||||||||||||||||||||||||
| 4Main Bucks | 1 | spherical | 22.7 | 46.6 | 17 | 12 | 2 | 270 | -0.3 | ||||||||||||||||||||||||||
| 5Main Bucks | 1 | spherical | 1.13 | 7.16 | 10 | 10 | 2 | 116 | -2 |
| Project No PS213686 Mazowe Mine S-K 1300 Technical Report Summary Bulawayo Mining Company Limited | WSP January 2025 Page 54 |
| Reef | No. of Structures | Type of Structure | Nugget | Sill Differential | Major Radius (m) | Semi- major Radius (m) | Minor Radius (m) | Z’ Rotation (bearing) [º] | Y’ Rotation (plunge) [º] | ||||||||||||||||||||||||||
| 4BucksHW | 1 | spherical | 8.59 | 29 | 12 | 11 | 2 | 267 | 0 | ||||||||||||||||||||||||||
| 6L-8L Bucks FW | 1 | spherical | 15.8 | 46.8 | 12 | 9 | 2 | 108 | 1 | ||||||||||||||||||||||||||
| 4-10L Bucks E8 | 1 | spherical | 29.3 | 126 | 14 | 13 | 2 | 90 | 0.5 | ||||||||||||||||||||||||||
| 1-18Old Bucks | 1 | spherical | 30.4 | 17.8 | 17 | 14 | 2 | 276 | 0 | ||||||||||||||||||||||||||
| 4-8L Wimbledon Main | 1 | spherical | 6.87 | 6.23 | 9 | 7 | 2 | 335 | 0.4 | ||||||||||||||||||||||||||
| 4_6L Wimbledon FW | 2 | spherical | 17.9 | 47.9 | 15 | 30 | 2 | 180 | 0.5 | ||||||||||||||||||||||||||
| spherical | 0.3 | 15 | 25 | 2 | 189 | 0.5 | |||||||||||||||||||||||||||||
| 8WimbledonEx-Conn | 1 | spherical | 2.16 | 21.4 | 15 | 11 | 2 | 307 | -3 | ||||||||||||||||||||||||||
| 3-10L Bojum | 1 | spherical | 117 | 98.6 | 12 | 15 | 2 | 279 | -0.9 | ||||||||||||||||||||||||||
| 8Bojum West | 1 | spherical | 6.03 | 8.27 | 13 | 10 | 2 | 267 | -0.7 | ||||||||||||||||||||||||||
| 5-6L Bojum HW | 1 | spherical | 79.4 | 84.8 | 10 | 9 | 2 | 90 | -1.4 | ||||||||||||||||||||||||||
| Southerly Reef | 1 | spherical | 2.83 | 118 | 20 | 18 | 2 | 73 | 1.5 | ||||||||||||||||||||||||||
| 7Flowing Bowl HW | 1 | spherical | 15.9 | 11.8 | 15 | 19 | 2 | 278 | -1.5 | ||||||||||||||||||||||||||
| 4L Commonwealth | 1 | spherical | 19.8 | 19.3 | 12 | 11 | 2 | 112 | -1.2 | ||||||||||||||||||||||||||
| Canbrea Reef | 1 | spherical | 24 | 96.8 | 9 | 8 | 2 | 260 | -1.1 | ||||||||||||||||||||||||||
| 11.1.9 | Grade estimation |
Mineral Resource estimation at the MGM is a combination of manual, and computer based digital estimation (conducted in Vulcan™). Mazowe has successfully been transitioned to computer-based estimation, with only a small number of Inferred Mineral Resources blocks still outstanding. MMC Zimbabwe aimed to ensure full computer-based estimation of the Mineral Resource and Mineral Reserve prior to 30 June 2018.
| 11.1.9.1 | Manual estimation |
Manual estimation of a mining block included development and stope channel samples. The cross-sectional area of a block is measured in vertical projection using a planimeter. Dip long sections are used so there is no need for a dip factor. Individual sample assays are cut to the 95th percentile (defined from historical levels generated for individual reefs, and not currently updated with new data). Channel samples are composited, and a minimum of 20 cm of zero grade dilution is added to bring channel widths up to a minimum mining width of 1.07 m. The grade and thickness of the block is derived using length weighted averaging.
A density of 2.9 tonnes per cubic metre (t/m3) has been used (calculated from rolling sample averages produced using Archimedes’ Principle). No significant difference in densities between granodiorite and porphyry hosted mineralisation has been encountered.
| Project No PS213686 Mazowe Mine S-K 1300 Technical Report Summary Bulawayo Mining Company Limited | WSP January 2025 Page 55 |
| 11.1.10 | Model validation |
| 11.1.10.1 | Visual comparisons conducted by MMC Zimbabwe |
A visual comparison between estimated block grades, and original drill hole assay data was conducted in Vulcan™. In addition, sections were cut along and across strike to check the block model fit and general continuity of the estimates within the pre-defined constraining envelopes (the orebody wireframes) [GFM 2018].
| 11.1.10.2 | Visual comparisons conducted by WSP |
No figures of the visual comparisons were presented in GFM 2018. WSP conducted visual comparisons in Vulcan. A section, looking east, comparing the Nucleus 3 block model grades and the drill hole assay results is presented in Figure 11.1.
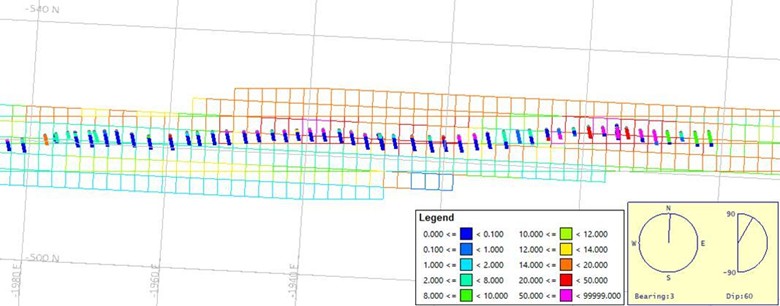
| Figure 11.1 | Nucleus 3 block grade and drill hole comparison |
| 11.2 | Mineral Resources classification |
Mineral Resource classification for Measured, Indicated and Inferred Mineral Resources is conducted as presented in Sections 11.2.1, to 11.2.3.
| 11.2.1 | Measured Mineral Resources |
Measured Mineral Resources are defined where (GFM 2018):
| — | Ore blocks are fully exposed on at least three adequately sampled sides in adjoining drives, raises, winzes or stopes, with a separation not exceeding 30 m and one or two levels/sub-levels are developed at intervals not exceeding 25 m centres. |
| — | Channel sampling in development ends is at no more than 2 m centres. |
| — | Returning assay values are above the lower Mineral Resource COG of 0.80 g/t Au. This COG is based on 80% of the MMC Zimbabwe cost structure of US$550/oz, a tails grade of 0.25 g/t Au, and a Mine Call Factor (MCF) of 100%. |
| — | Mining dilution is included, i.e., the minimum mining width is 0.87 m. |
| Project No PS213686 Mazowe Mine S-K 1300 Technical Report Summary Bulawayo Mining Company Limited | WSP January 2025 Page 56 |
| 11.2.2 | Indicated Mineral Resources |
Indicated Mineral Resources are defined where any combination of the following applies (GFM 2018):
| — | Ore blocks are fully exposed on two adequately sampled sides in adjoining drives, raises winzes or stopes, with a separation not exceeding 30 m and one or two levels/sub-levels are developed at intervals not exceeding 25 m centres. |
| — | Ore blocks are fully exposed and sampled on one level and fall within the geological boundaries of an ore shoot confirmed by one or more drill holes. |
| — | Diamond or RC drilling completed at a regular and consistent spacing, intersects mineralisation indicating geological continuity along strike and up-dip, and where a mining model has been applied: |
| — | For Mazowe, such continuity is defined by diamond or RC drilling at a maximum spacing of 30 m along strike, and 25 m up and down-dip. |
| — | Such continuity is defined by diamond or RC drilling at a maximum spacing of 30 m along strike and 25 m up and down-dip. |
| — | Channel sampling in development ends are at no more than 2 m centres. |
| — | Returning assay values are above a lower Mineral Resource COG, calculated without considering Mine Call Factor (MCF). |
| — | Mining dilution is included i.e., the minimum mining width is 0.87 m. |
| 11.2.3 | Inferred Mineral Resources |
Inferred Mineral Resources are defined where (GFM 2018):
| — | Exposure of the mineralised zone on a single level is extrapolated up or down-dip, to a maximum of four levels. |
| — | Extensions of blocks beyond Measured/Indicated Mineral Resources and Proved/Probable Reserves categories. |
| — | Where there is a mineralised zone beyond the boundaries of Measured/Indicated Mineral Resources, Inferred Mineral Resources are defined as exposure of a mineralised zone extrapolated up or down-dip to a maximum of 50% of the exposed strike extent. |
| — | Extensions of blocks beyond Measured/Indicated Mineral Resources along strike to the limits of the advanced exposure. |
| 11.3 | Cut-off grade, price, and justification |
GFM (2018) states that a lower Mineral Resources COG of 0.80 g/t Au was applied to the 2018 Mineral Resources.
A new COG for 2023 was calculated based on the 3-year trailing average gold price at December 2023 (with a gold price multiplier of 30%), applicable mill recovery, and revised operating and sustaining capital costs. Applied COGs are based on a marginal cost analysis assuming direct unit operating costs (C1) only.
| Project No PS213686 Mazowe Mine S-K 1300 Technical Report Summary Bulawayo Mining Company Limited | WSP January 2025 Page 57 |
Table 11.5 presents the parameters applied for definition of the 31 December 2023 Mineral Resource on an in-situ basis.
| Table 11.5 | 31 December 2023 Mineral Resource COG parameters |
| Parameter | Mineral Resources (ROM) |
Comment | ||
| Au COG (g/t) | 2.58 | Estimated based on Au Price +30% (US$2,340/oz Au), applicable mill recovery, operating and sustaining capital costs. | ||
| Plant Residual Value (g/t Au) | 0.46 | Fixed tails grade basis, equating to a 94% process recovery considering an average grade of 7.77 g/t for the MI MR. A lower recovery of 88% is assumed for cashflow modelling based on recent historical production 2021-23 at lower grade plant throughput. | ||
| Direct Operating Cost (C1) [US$/t] | 87.81 | 2023 value terms. | ||
| Indirect Operating Cost (US$/t) | 7.45 | Long term average at December 2023. | ||
| Sustaining Capital Cost (US$/t) | 9.92 | Long term average at December 2023. | ||
| Exchange Rate | N/A | |||
| Tonnage for Pay Limit (t) | 45,000 | Estimated throughput for fixed and variable cost components. | ||
| SG (t/m3) | 2.90 | Average estimation to two decimals recommended. | ||
| Assay Plan Factor (APF) [%] | 63.94 | 3-year trailing monthly average. | ||
| Block Factor (BF) [%] | 98.16 | 3-year trailing monthly average. | ||
| Au Price (USD/oz) | 1,800 | Pricing based on the 3-year trailing average Au price. | ||
| Au Price +30% (USD/oz) | 2,340 | 30% uplift on the 3-year trailing average Au price. |
Notes: Applied COGs are based on a marginal cost analysis assuming direct operating costs only.
11.3.1 Tonnage-grade factors
The Mineral Resource conversion parameters presented in Section 11.3 are explained as follows:
11.3.1.1 Assay plan factor
The APF was derived from 3 years of historical data and refers to gold content and is defined as the relationship between gold accounted for versus gold called for by the mine and accounted for. The factor is used in the modification of Mineral Resource block grades to Mineral Reserve (GFM 2018).
The APF is calculated as follows (GFM 2018):
APF = Au Content Accounted (Recovery + Residue) x 100% / Au Content Called for Based on Sampling
11.3.1.2 Block factor
The BF was derived from 3 years of historical data. It is defined as the ratio, expressed as a percentage, of the Au content of the ore broken from a Mineral Reserve block as indicated by sampling results versus the estimated Mineral Reserve block Au content. The BLF is not used in the modification of Mineral Resource blocks to Mineral Reserve blocks (GFM 2018).
The BF is calculated as follows (GFM 2018):
BF = Au Content Based on Sampling x 100% / Estimated Block Au Content
11.3.1.3 Block call factor
A Block Call Factor (BCF) was calculated from the APF and BF. This factor refers to gold content and not grade and is defined as the total specific mineral content of the ore broken from a Mineral Reserve block as indicated by the current sampling results adjusted by the APF versus the estimated Mineral Reserve block content (gold content called for). This factor was applied to the grade only.
BCF = BF x APF x 100% (by block)
| Project No PS213686 Mazowe Mine S-K 1300 Technical Report Summary Bulawayo Mining Company Limited | WSP January 2025 Page 58 |
11.3.1.4 Mine Call Factor
A Mine Call Factor (MCF) for Mazowe of 62.97% was calculated as an average for all mining blocks based on 3 year trailing monthly average data excluding +10% outliers and non-production months, whereby:
MCF = BF x APF x 100% (all blocks)
11.3.2 Cut-off Grade
The COG is calculated using the following formula:
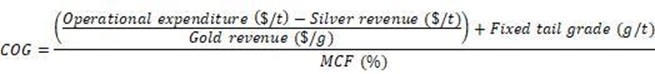
| 11.4 | Mineral Resources statement |
The basis of the Property’s Mineral Resources estimate and how it is generated are summarised below. The Mineral Resources estimate for the Property is reported herein in accordance with the requirements detailed in S-K 1300. For estimating the Mineral Resources, the following definition of Mineral Resource as set forth in S-K 1300 is applied:
“Mineral resource is a concentration or occurrence of material of economic interest in or on the Earth’s crust in such form, grade or quality, and quantity that there are reasonable prospects for economic extraction. A mineral resource is a reasonable estimate of mineralisation, taking into account relevant factors such as cut-off grade, likely mining dimensions, location or continuity, that, with the assumed and justifiable technical and economic conditions, is likely to, in whole or in part, become economically extractable. It is not merely an inventory of all mineralisation drilled or sampled.”
The Mineral Resources estimate has been defined, classified and reported according to the guiding principles and minimum standards set out in SAMREC (2016). WSP’s view is that there are no material differences between SAMREC (206), and S-K 1300 requirements for the reporting of Mineral Resources.
For the purposes of demonstrating capacity to exploit the Mineral Resource base as required under S-K 1300, the QPs have reviewed a high-level cashflow model provided by MMC Zimbabwe and are satisfied that the scale of the Mineral Resource and free cashflow after operating costs are sufficient to cover the cost of re-establishing access to the underground mine workings, dewatering the underground mine workings, surface infrastructure, and plant refurbishment/replacement.
A new COG for 2023 was calculated, as detailed in Section 11.3. WSP was informed by MMC Zimbabwe that the B.S.V. Mineral Resource is no longer included in the greater MGM Mineral Resource, hence; it was excluded.
The Mineral Resources estimate (exclusive of Mineral Reserves) for the Property in presented in Table 11.6 and Table 11.7.
The effective date of the Mineral Resources estimates is 31 December 2023.
Mineral Resources are reported on an in-situ basis.
The Mineral Resource comprises:
| — | 1.17 Mt at 7.77 g/t Au, for approximately 291 koz of gold (underground Measured and Indicated Mineral Resources). |
| — | 3.29 Mt at 8.65 g/t Au, for approximately 815 koz of gold (underground Inferred Mineral Resources). |
| Project No PS213686 Mazowe Mine S-K 1300 Technical Report Summary Bulawayo Mining Company Limited | WSP January 2025 Page 59 |
Table 11.6 presents the underground Measured and Indicated Mineral Resources (exclusive of Mineral Reserves) reported as at 31 December 2023.
| Table 11-6 | MGM underground Measured and Indicated Mineral Resources estimate as at 31 December 2023 |
| Category | Tonnage (Mt) | Au grade (g/t) | Au metal (koz) | |||||||||
| Measured Resources | 0.26 | 9.01 | 75 | |||||||||
| Indicated Resources | 0.91 | 7.42 | 217 | |||||||||
| Grand Total | 1.17 | 7.77 | 291 | |||||||||
Notes: Mt = Million tonnes; Au Grade g/t = gold grams per tonne; koz = thousand ounces.
Table 11.7 presents the underground Inferred Mineral Resources (exclusive of Mineral Reserves) reported as at 31 December 2023.
| Table 11-7 | MGM underground Inferred Mineral Resources estimate as at 31 December 2023 |
| Category | Tonnage (Mt) | Au grade (g/t) | Au metal (koz) | |||||||||
| Inferred Resources | 3.29 | 8.65 | 815 | |||||||||
| Grand Total | 3.29 | 8.65 | 815 | |||||||||
Notes: Mt = Million tonnes; Au Grade g/t = gold grams per tonne; koz = thousand ounces.
It should be noted that the Mineral Resources estimate for the Property is reported exclusive of Mineral Reserves. The Property does not have a current Mineral Reserve.
It should be noted that the sands (tailings) Mineral Resources estimate for the Property is not included as part of the Mineral Resources for the Property, as the ownership of the sands (tailings) material itself, and the accompanying sands (tailings) processing facility is currently under dispute, with legal proceedings ongoing.
The Mineral Resources presented in this Section are not Mineral Reserves, and do not reflect demonstrated economic viability. The reported Inferred Mineral Resources are considered too speculative geologically to have the economic considerations applied to them that would enable them to be categorised as Mineral Reserves. There is no certainty that all or any part of this Mineral Resource will be converted into Mineral Reserve.
| Project No PS213686 Mazowe Mine S-K 1300 Technical Report Summary Bulawayo Mining Company Limited | WSP January 2025 Page 60 |
All figures are rounded to reflect the relative accuracy of the estimates and totals may not add correctly.
Based on the geological results presented in this TRS, supported by the assumptions made by MMC Zimbabwe (presented in Section 11.3), it is the QP’s opinion that the Mineral Resources have RPEE.
Further exploration and technical studies are required to confirm the economic feasibility of the Property, and to allow the estimation and reporting of a Mineral Reserve (Section 5.6).
| 11.5 | Uncertainty in the estimates of Inferred, Indicated, and Measured Mineral Resources |
The QP is satisfied that the stated Mineral Resources classification reflects the appropriate level of confidence and considers those factors relevant to the deposit. The application of resource categories appropriately considers the relevant factors used in the classification process.
Some examples of specific factors that can influence the risk and uncertainty of the Mineral Resources estimates that are considered in the resource classification include:
| — | Interpretation of the mineralisation boundary. |
| — | Drill hole spacing and adequacy in defining geology, mineralisation, structure, and grade. |
| — | Quality of samples, assays, and geological information. |
| — | A COG for the Amatola surface resources will be required. |
| — | Pay limits are average block cut-off gold grades used to filter stoping blocks as either economic, or sub-economic. |
| — | The COG applied to the 2018 MRMR for the MGM is 4.82 g/t Au. The basis for these estimates is not adequately explained but is understood to generally correspond with the “upper” COG to achieve breakeven, inclusive of the cost of all mine development, stoping, process, and administration costs. WSP notes that these pay limits (COG) are considerably higher than the average stope production grade of 3.69 g/t Au over the past nine years of operation, and recommends they be reviewed. |
| — | The Mineral Resources estimates have been estimated to two decimal places for gold grade, and to the nearest tonne for tonnage, but have been reported to one decimal place for gold grade, to the neatest ounce for metal content, and to the nearest thousand tonnes for tonnage when reported in summary tables in the MRMR technical report (GFM 2018). |
| — | The Mineral Resource estimation has only been subjected to visual validation by MMC Zimbabwe staff. Standard industry practice is to conduct both visual, and statistical validation. |
The Mineral Resources have addressed RPEE, and have considered mining, metallurgical, and environmental factors.
Mineral Resources confidence is also assessed via independent reviews and internal peer reviews conducted at key stages of the Mineral Resources estimation process.
The Mineral Resources presented are not Mineral Reserves, and do not reflect demonstrated economic viability. The level of geological uncertainty associated with the reported Inferred Mineral Resources is considered too speculative to apply relevant economic, and technical factors to have the economic considerations applied that would enable these to be categorised as Mineral Reserves. There is no certainty that all or any part of the Inferred Mineral Resources will be converted into Mineral Reserves. All figures are rounded to reflect the relative accuracy of the estimates and totals may not sum exactly as a consequence.
| Project No PS213686 Mazowe Mine S-K 1300 Technical Report Summary Bulawayo Mining Company Limited | WSP January 2025 Page 61 |
| 11.6 | QP’s opinion on factors likely to influence the prospect of economic extraction |
The main factors likely to influence the prospect of economic extraction include:
| — | Orebody definition. |
| — | Assigned dry BD. |
| — | Unconstrained estimate. |
| — | Commodity pricing. |
| — | Interpretations of fault geometries. |
| — | Geotechnical conditions. |
| — | Dilution considerations. |
The estimate of Mineral Resources may be materially affected by environmental, permitting, legal, title, socio-political, marketing, or other relevant issues including risks set forth in this TRS.
In the QP’s opinion, all of these factors are adequately considered for the Mineral Resources reported. Based on the body of technical studies completed across the Property, it is the QP’s opinion that the Mineral Resources have RPEE.
In the QP’s opinion, all issues relating to all relevant technical and economic factors likely to influence the prospects for economic extraction, can be resolved with the recommendations for further work outlined in Section 23.1.
| 12 | Mineral Reserves estimates |
Not applicable since this TRS is an Initial Assessment and no Mineral Reserves have been estimated.
Any future estimation of Mineral Reserves and potential recommencement of operations will require the support of an additional drilling and resource definition campaign and at least a pre-feasibility to feasibility level of evaluation.
| Project No PS213686 Mazowe Mine S-K 1300 Technical Report Summary Bulawayo Mining Company Limited | WSP January 2025 Page 62 |
| 13 | Mining methods |
| 13.1 | Introduction |
This section is included to inform an Initial Assessment for the estimation of Mineral Resources.
No current Mineral Reserve estimates exist for the Mazowe mine, only historical estimates dating to June 2018 since the mine has been mothballed on care and maintenance since 2018. WSP consider that in order to comply with S-K 1300 requirements, at least a Pre-Feasibility Study (PFS) level study will be required to estimate current Mineral Reserves.
The mining inventories at the MMC Zimbabwe include material from the Mazowe underground mine, and a sand tailings retreatment project. Operations were suspended in August 2018 due to poor performance and economic conditions. Mazowe experienced low stope grade reconciliation, while the sand tailings processing plant did not meet throughput or gold recovery targets.
Mazowe underground mining operation has historically used traditional narrow vein mining methods with labour-intensive handheld techniques, rail transport, and shaft hoisting. The mine is pneumatic powered with rail haulage via lead acid battery powered locomotives hauling rail cars to a shaft where it is hoisted to surface. Mining is conducted using conventional drilling and blasting techniques using handheld jackhammer machines. Minimal support is used, and explosives are manually initiated. Scrapers and hand lashing are used to move muck into passes and chutes, with fines swept and bagged for transport to the plant.
The mine comprises an aggregation of multiple historical small scale mines targeting predominantly narrow vein reefs (19) that dip at 10° to 58° to the north, utilizing the random room and pillar mining method. There are two main sections Mazowe and Jumbo East, separated by a central fault zone striking approximately 045°. Mineralisation widths average 1.0m while average plan stope widths average 1.2 m and vary between 0.9 and 1.9 m over an extensive 2.75 km of strike, with gold mineralization occurring in sheared granodiorite stock or feldspar porphyry. The minimum stope width is set at 0.9 m while achieved stope widths likely vary between 1.5 and 1.8 m. Some north-south striking steeply dipping orebodies occur on the periphery with larger widths of 15–28 m that may be amenable to larger scale long hole benching methods.
Operations were halted in August 2018, and efforts to resume are underway. Due to this pause, flooding of the mine to approximately 50 m below surface meant that underground workings could not be inspected during the site visit, but details were obtained from inspection of surface facilities, technical studies, plans, and discussions with mine personnel.
| 13.2 | Parameters relevant to the design and schedule |
| 13.2.1 | Geotechnical |
MMC Zimbabwe have very competent ground consist of competent granodiorite with the reef horizon composed of sheared granodiorite which contains the mineralization of pyrite, pyrrhotite and gold with associated silification. This is manifested underground random room and pillar stopes which have been mined for hundreds of metres along strike and up-dip with very little support in the form of in-situ pillars. Exceptions occur where shear zones merge or splays/offshoots take off into the hanging-wall or footwall, or where shear zones occur within proximity. A poor choice of stope width in such a case leads to slabbing of the hanging-wall or footwall contacts of the shear zones. Routine monitoring of ground conditions in operating stopes is carried out by both the mining and geology staff.
Support protocols on the mine employ the use of pillars, matt packs, and cluster props to support areas of weak ground. A second access in between solid pillars to be used as main access is also recommended. Timber props are used where ground conditions are poor in the open stopes. The density of the pillars, matt packs and props is increased whenever ground conditions become unstable and for depths of 500–750 m below surface.
| Project No PS213686 Mazowe Mine S-K 1300 Technical Report Summary Bulawayo Mining Company Limited | WSP January 2025 Page 63 |
Historical geotechnical assessments have included:
| — | SRK, 2015, Mazowe Mine, Multi-reef Intersection Mining Presentation – a site visit inspection and recommendations for pillar design and support. |
| — | Kersten R.W.O., April 2014, Mazowe Mine: Rock Mechanics Review – a South African consultant report that reviewed the mining method and provided recommendations. |
| 13.2.2 | Hydrogeological |
The MGM is currently flooded up to the 3 Level approximately 50 m below surface from the 14 Level when operations and mine dewatering were ceased in 2018.
Approximately 33% of the current Mineral Resource base is located below the 14 Level, hence dewatering of the mine is critical to any future ramp-up plans (Virimai 2018).
Dewatering of Mazowe is proposed to be conducted in two stages as follows (BMC Limited Operations Reports):
| — | Stage 1 – Dewatering conducted from the 14 Level to the 22 Level by way of stage pumping using multi-stage KSB pumps. |
| — | Stage 2 – Dewatering conducted from the 22 Level to the 30 Level, by way of stage pumping using multi-stage KSB pumps. |
The total volume of water required to be pumped is 400 Ml. The discharge rates of the KSB pumps used at the MGM are 100 cubic metres per hour (m3/hr) [BMC Limited Operations Reports].
It is estimated that dewatering from the 14 Level to the 22 Level will take approximately three months (Stage 1) and dewatering from the 22 Level to the 30 Level will also take approximately three months (Stage 2) [BMC Limited Operations Reports].
Since no dewatering of the mine is currently undertaken, with water levels 50 m below surface, the dewatering requirements to regain access down to the 22 Level will need to be re-estimated, but it is likely that this will require at least 12 months.
| 13.3 | Production parameters |
| 13.3.1 | Production rates |
Production rates for the purpose of an initial assessment have been drawn from a history of previous operation and the QP’s assessment of what is technically achievable. A ramp-up study has been undertaken by Virimai (2018) and estimated an optimal underground mining production rate at 44 ktpm over a mine life of 7.5 years by applying Taylor’s formula.
| 13.3.2 | Expected mine life |
Using the production rate mentioned above, the initial assessment has considered a potential mine life of 5 years or more.
| 13.3.3 | Mining model |
MMC Zimbabwe applies a standard minimum stope width of 0.87 m at MGM for the purpose of defining stope envelopes for estimating the Mineral Reserve. This is asserted to be based on recent historical experience and decided in consultation with the mining department at MGM. Given recent stope reconciliation discrepancies, WSP recommends a detailed review of actual stope widths estimated from survey and stope reconciliation. It is likely that achieved stope widths are higher than plan leading to increased dilution and lower grades.
| Project No PS213686 Mazowe Mine S-K 1300 Technical Report Summary Bulawayo Mining Company Limited | WSP January 2025 Page 64 |
| 13.3.4 | Mining dilution and recovery factors |
A width of 20 cm (at 0 g/t) is applied to the composite value of the channel as dilution, over and above the minimum stoping width which is 87 cm for Mazowe and Bernheim.
| e.g., |  |
This 20 cm dilution represents over break and or slabbing dilution during stoping.
In instances where the width of the shear zone is above the required minimum stoping width, an extra 20 cm (at 0 g/t) is added as dilution to the measured width.
| e.g., |  |
This dilution is calculated for each individual sample channel (section) where applicable.
| 13.4 | Mining fleet, machinery, and personnel requirements |
Historical 2018 monthly production targeted 9,000 t of ore and 1,040 t of waste from development. Ten jackhammers are used for stoping, aiming for 300 t per day. The underground section has 389 workers across two shifts, each lasting eight hours. Two Mine Captains and four Overseer Miners manage production and development.
| 13.5 | Scheduling process |
Prior to closure in 2018, BMC Limited was planning a project development and ramp-up for MGM. The plan, based on a financial model from August 2018, included sand mining and retreatment at 60 ktpm in 2019 and underground operations at 65 ktpm starting January 2022. Production forecasts for Mazowe were outlined, with surface mining planned for 2021. The plan extended to 2032; however, WSP views it as preliminary and calls for detailed feasibility evaluation to ensure historical outcomes and future plans align. Tonnage, gold grade, and recovery estimates appear optimistic based on historical performance. Further details on the conceptual planning for restart and ramp-up were provided.
| 13.6 | Scheduling results |
This TRS is an initial assessment for the purpose of estimating Mineral Resources for which mining schedules supported by at least a pre-feasibility or feasibility study have not been prepared.
| Project No PS213686 Mazowe Mine S-K 1300 Technical Report Summary Bulawayo Mining Company Limited | WSP January 2025 Page 65 |
| 13.7 | Mining unit dimensions |
MMC Zimbabwe have produced a range of 40 separate resource models with parent block sizes ranging from 4 mE x 2 mN x 4 mRL down to 2 mE x 2 mN x 2 mRL and sub-blocked down to 1 mE x 1 mN x 0.5 mRL, representing sufficient spatial resolution for grade interpolation and estimation of resource and mining inventories. This is regarded as reasonable for reserve estimation provided a partial percentage of block volume approach is adopted for reporting within defined stope wireframes.
For resources and reserves that are still estimated by manual techniques to estimate resource mineralisation and stope block reserves by multiplying average respective widths by plan area to determine volumes and by diluting mineralised widths at zero grade as a function of the increase mining widths. These methods are also appropriate.
A minimum stope width of 0.87 m has been applied for narrow vein stoping while dilution of larger open stopes has been estimated by expanding mineralisation wireframes by 0.2 m. This has resulted in planned stope widths ranging from 0.9 m to 1.9 m for the narrow vein shallow to moderately dipping reefs (10° to 58° dip north) and average 1.2 m.
The mining dimensions are consistent with the mining methods proposed; however, the QP’s experience is that plan average widths of 1.2 m will be difficult to sustain for shallow dipping reef systems and could range upwards of 1.5 m leading to increased dilution and reduction in grades by a further 25%. Active management is required to sustain narrow mining widths within design parameters.
| 13.8 | Mine layout |
The orebody at the MGM is accessed by a number of shafts, which are a combination of inclined and vertical shafts sunk to various depths. The three most important and active shafts are the Connaught, Ogilvy and Nucleus shafts (Virimai 2018). An isometric plan showing the main shafts and primary underground access level development is provided in Figure 13.1 while a long projection looking west showing the Measured and Indicated blocks, mined out blocks and shafts is provided in Figure 13.2. A list of the main shafts (9 in total) is provided in Table 13-1 together with dimensions, depths and inclination.
The mine currently has access to the 3 Level on the Connaught underlay shaft and has just commenced pumping water from the Ogilvy vertical shaft for use in a small CIP plant adjacent the Ogilvy shaft. The small CIP plant is rated at 10 tonnes per hour (tph) and will be used to retreat tailings.
| Project No PS213686 Mazowe Mine S-K 1300 Technical Report Summary Bulawayo Mining Company Limited | WSP January 2025 Page 66 |
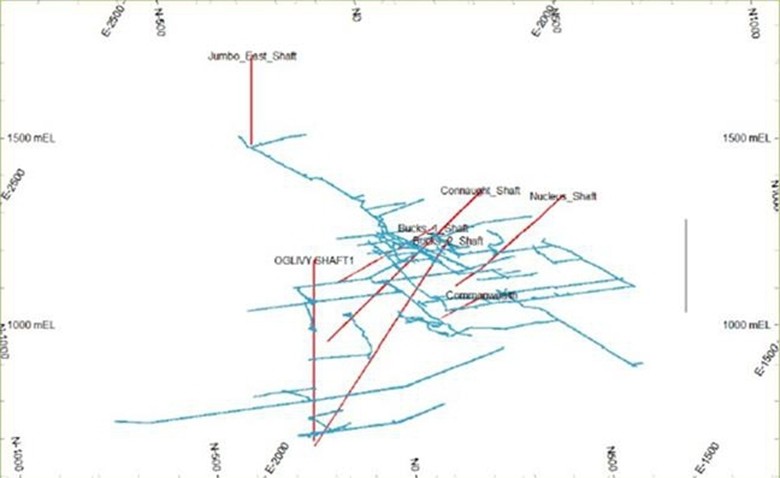
| Figure 13.1 | MGM underground mine access shafts and general mine layout (Virimai 2018) |
Operations are planned to recommence at Connaught Shaft but limited to levels above the Level 3 due to flooding. Future mining plans will require dewatering of lower levels.
| Project No PS213686 Mazowe Mine S-K 1300 Technical Report Summary Bulawayo Mining Company Limited | WSP January 2025 Page 67 |
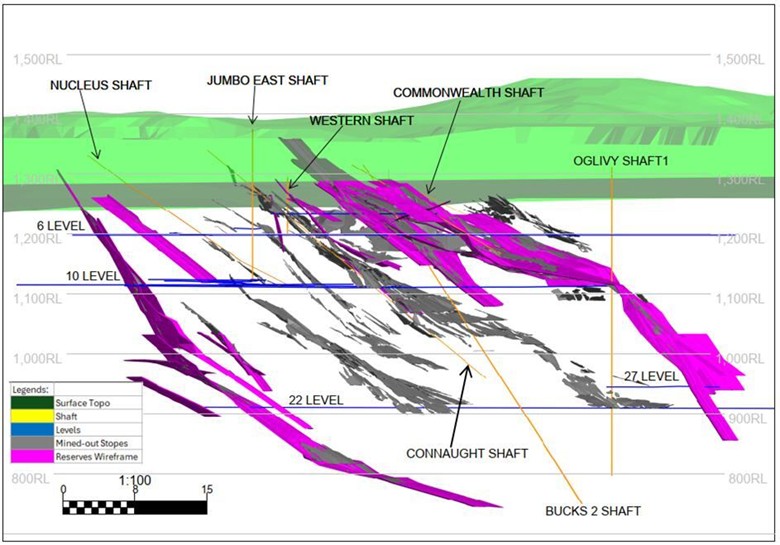
| Figure 13.2 | MGM layout – projection looking east |
| Table 13-1 | MGM shaft list – dimensions, depths and inclination |
| SHAFT NAME | SIZE (m) | INCLINED DISTANCE (m) |
DEPTH (m) |
REMARKS | ||||||||
| OGILVY | 5.0 | x | 1.8 | Vertical | 524 | Surface down to 29 LEVEL-VERTICAL | ||||||
| CONNAUGHT | 1.5 | x | 2.7 | 594 | 373 | Surface down to 18 LEVEL @ -39ᴼ | ||||||
| JUMBO EAST | 1.5 | x | 1.6 | Vertical | 180 | Surface down to 10 LEVEL VERTICAL | ||||||
| BATEMAN | 1.4 | x | 1.9 | 161 | 90 | Surface down to 5 LEVEL @ -34ᴼ | ||||||
| S.O.S | 1.8 | x | 1.3 | 190 | 79 | Surface down to 6 LEVEL @ -25ᴼ | ||||||
| NUCLEUS | 2.0 | x | 1.5 | 398 | 217 | Surface down to 10 LEVEL @ -33ᴼ | ||||||
| WESTERN | 1.9 | x | 3.2 | Vertical | 100 | Surface down to 6 LEVEL- VERTICAL | ||||||
| COMMONWEALTH | 1.5 | x | 1.6 | 190 | 104 | Surface down to 6 LEVEL -INCLINE | ||||||
| VENTILATION | 1.5 | x | 1.6 | Vertical | 109 | Surface down to 6 LEVEL -VERTICAL | ||||||
| Project No PS213686 Mazowe Mine S-K 1300 Technical Report Summary Bulawayo Mining Company Limited | WSP January 2025 Page 68 |
| 14 | Processing and recovery methods |
| 14.1 | Processing methodologies and flowsheets |
This section is included to inform an Initial Assessment for the estimation of Mineral Resources.
The processing plant at the Property as shown in Figure 14.1, commissioned in the 1950s with subsequent modifications, consists of two sections:
| — | An underground ore process plant located on surface with a design capacity of 132 ktpa. |
| — | A low-grade dump or sands re-processing facility. |
Both circuits involve crushing, milling, gravity concentration, cyanidation, adsorption, elution, electro-winning, and smelting. The low-grade dump or sands re-processing facility is a floatation plant with a nominal capacity of 780 ktpa, although this rate has not yet been achieved. In 2018, the processing plant processed approximately 16 kt of ore, producing 706 oz of gold and 545 oz of silver at a recovery rate of 100.0%. The Tailings Storage Facility (TSF) was nearing capacity at the time of the Property’s placement on care and maintenance, necessitating the construction of a new TSF for potential resumption of production.
Site inspection of the underground ore process plant indicates that it is in a poor condition and will require re-evaluation of the merits of upgrade or replacement prior to restart. The sands re-processing plant and tailings ownership currently resides with another party following auction and disposal by the receiver, now the subject of legal dispute in progress. Consequently, it was not possible to inspect this plant.
Some small-scale processing of artisanal miner ore is still conducted at Mazowe, formerly under the supervision of a business administrator. Part of the existing crushing system has been modified for crushing, roll grinding, and gravity separation. Discharge to a tailings dam adjacent the plant near the Connaught Shaft is planned to be retreated at a small 10 tph CIP plant located at the Ogilvy shaft. Some vat leaching operations adjacent the main plant are also conducted for artisanal miner ore. These operations are not regarded as material to future operations planned but have helped fund care and maintenance operations.
| Project No PS213686 Mazowe Mine S-K 1300 Technical Report Summary Bulawayo Mining Company Limited | WSP January 2025 Page 69 |
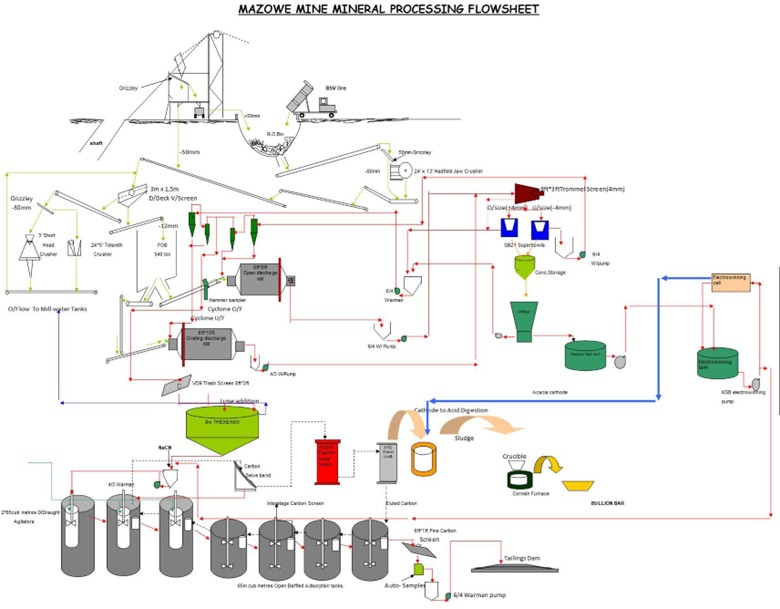
| Figure 14.1 | MGM processing flowsheet |
| 14.2 | Processing plant throughput and characteristics |
Processing plant throughput is rated at 14.5 tph and characteristics mentioned in Section 14.3.
| 14.3 | Primary and secondary crushing |
Minus 200 mm Run of Mine (ROM) ore is extracted from a 400 t Rough Ore Bin and fed onto a conveyor belt to a 14’ x 24’ Telsmith Jaw Crusher via a 50 mm static grizzly. The undersize from the grizzly combines with the crusher product and is conveyed to a Double Deck Vibrating Screen with apertures of 12 mm x 19 mm (bottom deck) and 25 mm x 25 mm (top deck). The oversize from the screen is fed to a 50 mm grizzly, serving as the feed for Secondary crushing in a 5’ x 24’ Telsmith Jaw Crusher, while the undersize is directed to a 3’ Symons Cone Crusher for Tertiary crushing. The Secondary Crushing plant operates in a closed-circuit setup with the Double Deck Screen, and the minus 12 mm ore is conveyed into a 540 t Fine Ore Bin.
| 14.4 | Product sampling |
ROM ore is drawn at an average of 14.5 t per hour (tph) from the Fine Ore Bin over Weightometer and Automatic Hammer Samplers into a 6’ x 8’ Grate discharge Ball Mill (+/-6 tph) and a 6’x10’ Overflow mill (+/-8.5 tph) operating in parallel.
| Project No PS213686 Mazowe Mine S-K 1300 Technical Report Summary Bulawayo Mining Company Limited | WSP January 2025 Page 70 |
| 14.5 | Product stockyard |
MMC Zimbabwe has no product stockyard.
| 14.6 | Energy and water process materials requirements |
| 14.6.1 | Mine power plant |
Power is provided by ZESA at 33 kilovolts (kV) with a capacity of 4.25 megavolt ampere (MVA). This power is then transformed into various voltages for different purposes:
| — | 11 kV: used for distribution to CIL, underground feed, and domestic supply. |
| — | 2.2 kV: utilised for compressors, village transformers supply, and underground feed. |
| — | 550 V: employed for mine plants, including underground and workshop equipment. |
| — | 380 V: utilised for villages, offices, underground feed, and domestic water supply. |
Different transformers are employed:
| — | 2 x 750 kilovolt ampere (kVA) transformers (33kV to 550 V). |
| — | 1 x 750 kVA transformer (33 kV to 2.2 kV). |
| — | 1 x 2 MVA transformer (33 kV to 11 kV). |
| — | 1 x 200 kVA transformer (2.2 kV to 550 V) located on the 22 level Ogilvy Shaft for underground supply. |
| 14.6.2 | Mine water management system |
Sump and settler systems are used for Mazowe. Pumping of the mine is achieved by a total of five pump stations, four of which are at the Ogilvy Shaft. These stations are cascading, with the 6 Level pump discharging on surface. The other three are located at the Connaught Shaft.
| 14.7 | QP’s opinion |
The existing underground ore process plant is in poor condition and will require re-evaluation of the merits of upgrade or replacement prior to restart.
The sands re-processing plant and tailings ownership currently resides with another party following auction and disposal by the receiver, now the subject of legal dispute in progress. It will be necessary to successfully resolve legal proceedings to establish ownership and future potential.
The mine appears to lack a capital equipment inventory for the C&M operation which will require reconciliation as part of valuation and future feasibility assessment.
| Project No PS213686 Mazowe Mine S-K 1300 Technical Report Summary Bulawayo Mining Company Limited | WSP January 2025 Page 71 |
| 15 | Infrastructure |
This section is included to inform an Initial Assessment for the estimation of Mineral Resources.
| 15.1 | Rail access |
A railway line passes through the mine linking up with the regional centres of Glendale, Bindura, and Shamva.
| 15.2 | Port access |
No port access to MGM.
| 15.3 | Roads |
Access to the mine from Harare is by a wide tarred road 42 km to Mazowe Hotel, followed by 8 km of narrow tar, to the west of the Harare-Bindura Road.
| 15.4 | Camp |
Due to the mine being on care and maintenance since 2018, scant information regarding the camp in the mine is available. WSP understands that residential ownership was provided to mine workers as compensation for outstanding salaries on closure.
| 15.5 | Tailings |
The Mazowe sand tailings retreatment project, initiated in 2017, faced challenges with throughput rate and gold recovery, leading to its suspension in October 2018.
Despite providing a site layout and TSF view, WSP’s inspection could not inspect the tailings retreatment process plant due to ongoing litigation as to ownership of the plant and tailings dam. Mining operations involved accessing portions of the sands, prompting the need for a new TSF due to capacity concerns. If ownership status is successfully resolved in MMC Zimbabwe’s favour or a deal can be struck, the QP recommends a feasibility study to assess the economic merits of recommencing treatment. This should include a thorough review of metallurgical performance and reconciliation to address issues with throughput, head grade, and gold recovery, along with reassessing resource estimates and optimising mining approaches.
| Project No PS213686 Mazowe Mine S-K 1300 Technical Report Summary Bulawayo Mining Company Limited | WSP January 2025 Page 72 |
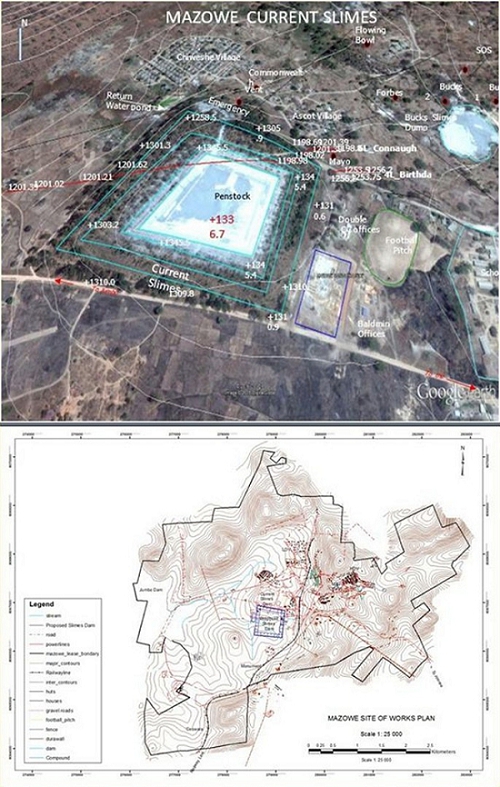
| Figure 15.1 | MGM site layout showing processing and TSF |
| Project No PS213686 Mazowe Mine S-K 1300 Technical Report Summary Bulawayo Mining Company Limited | WSP January 2025 Page 73 |
| 15.6 | Potable water and wastewater |
Portable water requirements are delivered from the water supply system installed at the mine. Wastewater and sewerage systems are installed at the mine.
| 15.7 | Accommodation and offices |
The project site is located within the MGM mining lease area isolated from the surrounding Mazowe farming areas. The mine will make use of accommodation and offices already onsite. No landowners are affected as this is an existing mine.
| 15.8 | Non-process infrastructure |
No Non-process Infrastructure (NPI) is installed on the project site.
| 15.9 | Information and communications technology systems |
The mine currently has telecommunications and IT systems supplying the site offices. These may require upgrade on recommencement of operations.
| 15.10 | Other support facilities and utilities |
An assay laboratory is installed on site that will require refurbishment prior to recommencement of operations. This laboratory is in use for management of artisanal mined ore and retreatment of electrum.
The project area is fenced and manned security provisions are in place.
First aid and ambulance are available on site.
| Project No PS213686 Mazowe Mine S-K 1300 Technical Report Summary Bulawayo Mining Company Limited | WSP January 2025 Page 74 |
| 16 | Market studies |
This section is included to inform an Initial Assessment for the estimation of Mineral Resources.
| 16.1 | Nature and material terms of agency relationships |
MGM is 100% owned by BMC Limited, with no agency relationships applicable.
| 16.2 | Results of relevant market studies |
No recent formal market studies have been completed. Gold and silver are sold according to open market prices as mandated by the Zimbabwean government. Analysis is based on historical pricing using a 3-year trailing average, combined with industry forecasts for exchange rate and inflation.
| 16.3 | Commodity price projections |
Pricing assumptions for gold and silver are based on historical spot pricing in an open market for precious metals, government mandated terms for payment, foreign exchange, and inflation recent history.
Trailing 3-year average daily gold and silver prices have been used as the basis for the gold price assumed for pay limit and revenue assumptions, as provided in Figure 16.1. At end December 2023, this averaged US$1,848/oz for gold and US$21/oz for silver. Silver in doré is not a material contributor to pay limit revenue estimation. As of May 2024, gold was expected to trade at US$2,410/oz. by the end of June 2024, according to Trading Economics global macro models and analysts’ expectations. Looking forward, it is estimated to trade at US$2,484/oz by the end of June 2025.
A gold price assumption of US$1,850/oz is reasonable and supportable for planning purposes, given spot pricing of US$2,330/oz (May 2024) and the 3-year trailing average price of US$1,848/oz (end December 2023, World Gold Council). A silver price assumption of US$21/oz is also reasonable given the spot price for silver is currently US$24.47/oz whilst the 3-year trailing average price is US$23.56/oz, indicating room to increase assumed pricing. Silver represents approximately 10–15% of doré and 0.2% of value and therefore is not material to revenue.
| Project No PS213686 Mazowe Mine S-K 1300 Technical Report Summary Bulawayo Mining Company Limited | WSP January 2025 Page 75 |
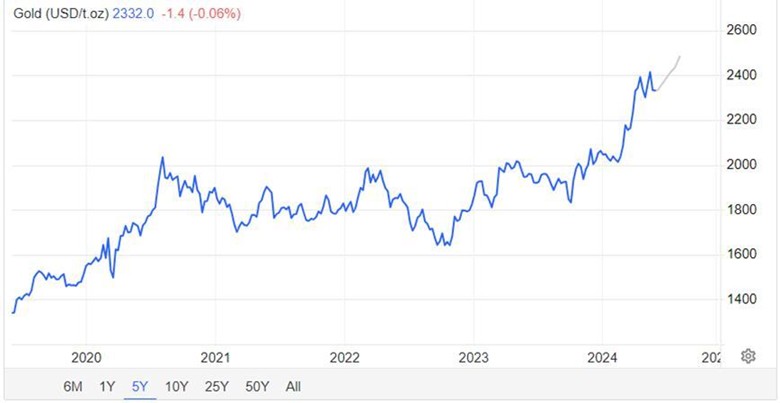
| Figure 16.1 | Historical (blue) gold spot price and forecast (grey) in US$/oz (Trading Economics 30 May 2024) |
Gold proceeds are paid 75% in USD and 25% in local currency with effect from February 2023 (previously 60% USD and 40% in local currency). Sale of gold under these terms has been mandated by the Zimbabwean Government since the start of 2020. The impact of Government controls on gold and silver sales with respect to foreign currency retentions must be considered for the LOM plan. The local ZiG currency was only introduced 5 April 2024, is gold backed and supported by strict monetary policy controls.
The local currency component of revenue has been employed for in country expenses, but this value is subject to high inflation (57.5%, April 2024, Table 16.1) and exchange rate risk (Figure 16.2). Under these circumstances prompt expenditure of local currency is warranted.
| Table 16-1 | Zimbabwean inflation rate and economic indicators (Trading Economics, 30 May 2024) |
| Indicator | Last | Previous | Highest | Lowest | Units | Date | ||||||||||||||
| Currency | 13.3 | 13.28 | 13.82 | 0 | May-24 | |||||||||||||||
| Stock Market | 102 | 100 | 2962052 | 1.13 | Points | May-24 | ||||||||||||||
| GDP Annual Growth Rate | 4.5 | 6.5 | 22.57 | -17.2 | percent | Dec-23 | ||||||||||||||
| Unemployment Rate | 9.1 | 9.3 | 10.8 | 4.4 | percent | Dec-23 | ||||||||||||||
| Inflation Rate | 57.5 | 55.3 | 786 | -7.5 | percent | Apr-24 | ||||||||||||||
| Interest Rate | 20 | 20 | 200 | 15 | percent | Apr-24 | ||||||||||||||
| Balance of Trade | -184 | -81.4 | 293 | -3958 | USD Million | Mar-24 | ||||||||||||||
| Current Account | 305 | 348 | 920 | -2750 | USD Million | Dec-22 | ||||||||||||||
| Current Account to GDP | 1 | 2.9 | 4.1 | -19.3 | percent of GDP | Dec-22 | ||||||||||||||
| Government Debt to GDP | 92.6 | 66.9 | 248 | 48.44 | percent of GDP | Dec-22 | ||||||||||||||
| Government Budget | -0.9 | -1.7 | 1.3 | -11.2 | percent of GDP | Dec-22 | ||||||||||||||
| Corporate Tax Rate | 24.72 | 24.72 | 30.9 | 24 | % | Dec-23 | ||||||||||||||
| Personal Income Tax Rate | 41.2 | 41.2 | 51.5 | 36.05 | % | Dec-23 | ||||||||||||||
| Project No PS213686 Mazowe Mine S-K 1300 Technical Report Summary Bulawayo Mining Company Limited | WSP January 2025 Page 76 |
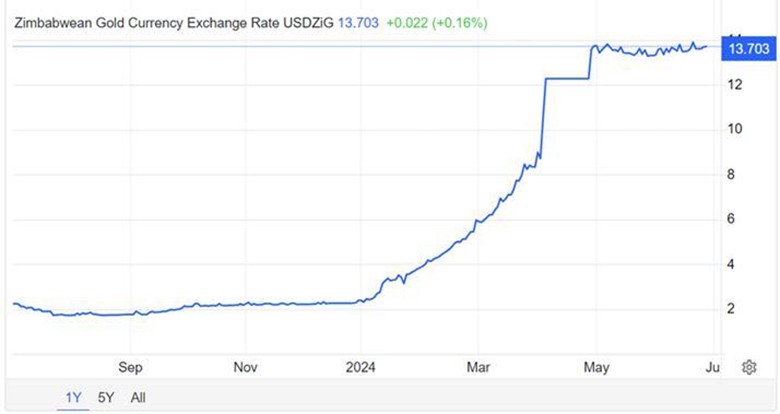
| Figure 16.2 | Zimbabwean gold currency exchange rate ZiG/USD (Trading Economics, 1 July 2024) |
Discounting current gold spot pricing of approximately US$2,350/oz to account for high inflation of 57.5% (April 2024) yields an estimated real value of US$1,936/oz while discounting for exchange rate movements in 2024 (USD:ZiG 2.34 to 13.304) yields an estimated real value of US$1,853/oz. The 12-month forecast price of US$2,484/oz yields discounted values of US$2,061/oz to US$1,971/oz respectively.
This evaluation indicates that the gold pricing assumption of US$1,850/oz for mine planning COG assessment purposes and cashflow modelling is reasonable, provided that inflation and related exchange rate movements for the local currency can be constrained to, or reduced from, current levels and local currency disposed of promptly to cover local costs.
| 16.4 | Mining and processing |
Future mining and processing at MGM are proposed to be conducted on an owner operator basis, consistent with previous practice.
Contract artisanal mining arrangements in place under the previous business administrator have been rescinded and are not material to future plans.
| 16.5 | Product transport and handling |
A gold and silver doré is produced for sale to the Zimbabwean government nominated agent, Fidelity. Gold generally averages 87% by weight. The product is transported by a private professional security company to Fidelity, a government owned refining facility, via the Mutapa Investment Fund (sovereign fund). Gold and silver is valued at spot pricing under the RTGS system on receipt of the doré with Fidelity stipulating allowances for refining charges (US$0.65/oz Au) and government royalty (5%).
| 16.6 | Hedging arrangements |
No hedging arrangements are currently in place.
| 16.7 | Forward sales contracts |
No forward sales contracts are currently in place.
| 16.8 | Contracts with affiliated parties |
No contracts with affiliated parties are currently in place with respect to gold sales.
| Project No PS213686 Mazowe Mine S-K 1300 Technical Report Summary Bulawayo Mining Company Limited | WSP January 2025 Page 77 |
| 17 | Environmental studies, permitting, and plans, negotiations, or agreements with local individuals or groups |
This section is included to inform an Initial Assessment for the estimation of Mineral Resources.
| 17.1 | Introduction |
MGM is located 50 km north of the city of Harare, in the Mashonaland Central Province of Zimbabwe. The location is at an altitude of about 1,300 m above sea level, ward 22 of Mazowe district under the jurisdiction of the Mazowe Rural District Council, Mashonaland Central Province. The area is accessible off Mazowe–Harare Road, turning right before Mazowe hotel turnoff then proceeding with the road to MGM commonly known as Jumbo mine.
| 17.2 | Project context |
The mine is owned by MMC Zimbabwe and the proponent was granted mining rights. The proponent is proposing to restart legal mining operations and ensure sustainable mining development.
| 17.3 | Project permitting |
The following permits/licenses were provided:
| — | Environmental Impact Assessment (EIA) Certificate – Expires 13 September 2025. |
| 17.4 | Environmental and Social Impact Assessment |
Gold Fields of Mazowe obtained ISO 14001:2004 certification for its Environmental Management System in April 2016 and is now aligning it with the ISO 14001:2015 standard. The mine regularly evaluates and manages new environmental risks, implementing appropriate management programs. Every 2 years, Environmental Management Plans (EMP) are submitted to the Environmental Management Agency, and Environmental Impact Assessments are conducted for all new projects to mitigate environmental impacts. The most recent and current EMP for Mazowe Mine was prepared by Metallon Gold Zimbabwe (Pvt) Ltd in 2013-14. Provisions are in place for Mine Closure Liability, ensuring sufficient financial resources are allocated for addressing environmental concerns upon mine closure, adhering to legal requirements and BMC Limited best practice.
| 17.4.1 | Biodiversity and natural resources |
Zimbabwe boasts abundant natural resources, including rich mineral deposits, wildlife, and arable lands. In the working areas of the project, vegetation will be cleared to facilitate shaft sinking and the establishment of milling plants. This vegetation comprises grasses, shrubs, herbaceous plants, and trees. Clearing will be selective, focusing only on necessary areas, and conservative methods will be employed to minimise disturbance. Excavated areas will be backfilled according to decommissioning and rehabilitation plans to allow for vegetative regrowth.
| Project No PS213686 Mazowe Mine S-K 1300 Technical Report Summary Bulawayo Mining Company Limited | WSP January 2025 Page 78 |
| 17.4.2 | Managing impacts on water |
The main concern for the MGM would be pollution from effluent and runoff containing suspended solids. All wastewater is to be managed in a closed system thru lining of wastewater facilities.
| 17.4.3 | Acid and metalliferous drainage (AMD) |
The nearby major river system Muroodzi River is approximately 5.5 km south from the project site. There is no direct influence on the river by the project activities since the only possible minimum contribution of surface rainfall will be contained.
| 17.4.4 | Erosion and protection of soils |
Soil erosion at the project site will be prominent during the wet season when the area experiences runoff after heavy rains. Regular movement of equipment and vehicles loosens soil making it susceptible to soil erosion. This is likely to happen before re-profiling and revegetation of the area becomes effective.
| 17.4.5 | Noise and vibration |
The noise survey mainly focused on the project area and potentially affected surroundings. Noise levels shall be kept within acceptable levels of NSSA and ILO (International Labor Organisation) standards.
| 17.4.6 | Air quality |
Mining and milling activities can produce significant dust and release various gases into the environment. This exposes both employees and local communities to air pollution, including dust, gases, and noise, which can negatively impact human health and wellbeing over time. The primary sources of air pollution are dust generated by vehicles transporting ores and dust from the milling process.
| 17.4.7 | Local climate impacts |
The proposed site lies within Natural Ecological Region two (II) which is characterised by warm and temperate climate. When compared with winter, the summers have much more rainfall. The warmest month of the year is December, with an average temperature of 21.0°C. At 13.9°C on average, July is the coldest month of the year. The driest month is August, with 8 mm of rainfall. In January, the precipitation reaches its peak, with an average of 213 mm.
| 17.4.8 | Greenhouse gas emissions |
Not currently addressed as the Property is currently on C&M.
| 17.4.9 | Resources use and non-mineral waste |
No resources use and non-mineral waste provided for review.
| 17.5 | Property standards |
No project standards provided for review.
The QP assumes that similar quality assurance standards as adopted by BMC Zimbabwe at the How Gold Mine (HGM) will be implemented for future operations, including:
| — | Quality Management Systems: | ZWS ISO 9001-2015 |
| — | Environmental Management: | ZWS ISO 1401-2015 |
| — | Mining and Quarrying: | IAF Code 2. |
| Project No PS213686 Mazowe Mine S-K 1300 Technical Report Summary Bulawayo Mining Company Limited | WSP January 2025 Page 79 |
| 17.6 | Stakeholder engagement |
| 17.6.1 | Stakeholder engagement plan |
Stakeholder consultation employed various methods, including questionnaires, interviews, focus group discussions, and community meetings, utilising a triangulation approach as needed. Stakeholder involvement occurred in four primary ways:
| — | Informing: Providing project details from the proponent and consultant to affected communities and stakeholders, facilitating one-way information flow. |
| — | Consulting: Creating a two-way flow of information between the proponent or consultant and affected communities, allowing the public to express views on the proposal. |
| — | Participating: Engaging in interactive exchanges between the proponent and the community, involving shared analysis, agenda setting, and the development of agreed positions on the proposal and its impacts. |
| — | Negotiating: Facilitating face-to-face discussions between the proponent and key stakeholders to establish consensus and reach mutually acceptable resolutions on issues, such as impact mitigation measures and compensation. |
| 17.6.2 | Consultation |
In line with international good practice as well as the requirements of the EMA Act (20:27), the proponent and GeoPlanet Key (Pvt) Ltd (GeoPlanet) held extensive consultations with the communities affected by the project and authorities at both central and local government levels. Although the public participation process continues throughout the EIA study, it is at its highest intensity during the Scoping exercise and the EIA Report stages.
| 17.7 | Cultural, economic, and social conditions |
| 17.7.1 | Cultural heritage |
The area to be constructed on has no known sites of cultural and historical importance. Resources that will be uncovered during construction activities will be reported to the National Museums and Monuments of Zimbabwe.
| 17.7.2 | Local landscape |
Change in landform and geomorphological features within the area will not be very significant given the gradient is gentle and the project area is not very large in terms of spatial coverage. Also, the land is a designated mining area.
| 17.7.3 | Contributing to the national and local economy |
The proponent has also identified the need to provide more employment and process more minerals to serve the nation at large. Zimbabwe defined in a series of short- and medium-term plans, which seeks the restoration and transformation of capacities for sustainable socio-economic growth. The project therefore seeks to better economic transformation of the country. The project will contribute to socio-economic development of both the local and national level through enhancing infrastructural development.
| 17.7.4 | Establishing a social management framework |
No social management framework provided for review.
| 17.7.5 | Impacts on land use and access |
The MGM has minimal impacts on land use and access since it is in C&M since 2018.
| Project No PS213686 Mazowe Mine S-K 1300 Technical Report Summary Bulawayo Mining Company Limited | WSP January 2025 Page 80 |
| 17.7.6 | Protecting community health and safety |
MMC Zimbabwe has assessed the impact of the HIV/AIDS epidemic on its operations and implemented ongoing programs to support staff and manage associated risks. The company conducts prevalence studies to monitor HIV trends, predict future patterns, and plan health services accordingly. Efforts are focused on controlling and minimising the identified impacts of HIV/AIDS.
| 17.7.7 | Protecting the workforce |
The Property is going to help the community by providing employment for the local people especially the youths and or school leavers during construction, operation, and decommissioning.
| 17.7.8 | Commitment to local procurement and hiring |
MGM is under care and maintenance since 2018, but when operations will be continued, MMC Zimbabwe aims to give Employment Opportunities to local people where appropriate.
| 17.8 | Mine closure |
Mine closure plans, including remediation and reclamation plans have recently been updated by Enmin Consulting (Private) Limited (Enmin) in June 2024, including a detailed outline of closure requirements and costs.
The MGM is currently on C&M, with planned recommencement of underground mining and processing operations subject to the outcome of a planned prefeasibility study. Consequently, the mine closure plan and remediation works are on hold.
| 17.8.1 | Plan |
The mine closure plan envisages that at the conclusion of mining and processing, the land will be rehabilitated. A mine closure plan has been developed that contemplates site closure that will restore the land to its best future use. Closure planning is an iterative process, and ongoing technical studies as well as consultation with local stakeholders will feed into future refinements of the current closure concepts, prepared on a regular basis by MMC Zimbabwe’s selected external consultant. The implementation and success of the plan will be monitored until the site achieves an environmentally and socially acceptable and sustainable state.
The conceptual mine closure plan indicates that closure will be required after completion of mining, although this timeline may vary as a function of conversion of additional Mineral Resources to Mineral Reserves as part of an annual update. Studies are ongoing to determine the potential for further extraction. On exhaustion of reserves, the underground mine will be closed and the ore handling and processing facilities will be decommissioned. This will entail dismantling, demolition and removal of equipment and buildings, reshaping and re contouring of land surfaces and rehabilitation of occupied areas. Dewatering of the underground mine will cease upon completion of mining and allowed to fill with water. As far as practical, the land occupied by the mine and its infrastructure will be returned to its former land use. The mine, plant area and waste emplacements and other works will be made safe for the community including the placement of barriers to discourage people from entering the mined out workings. A public education program on safety issues associated with the mine and any excavated areas will be conducted. A passive water management system will be implemented so that adequate protection for surrounding water resources can be provided without ongoing active management by MMC Zimbabwe.
The closure phase will also require the management of social issues including retrenchment of the workforce and managing the implications of loss of local employment and business. To mitigate the social impacts commonly associated with mine closure, the Mine Closure Plan includes components related to social and community impacts. The plan will be developed in consultation with relevant authorities, the workforce and local communities.
| Project No PS213686 Mazowe Mine S-K 1300 Technical Report Summary Bulawayo Mining Company Limited | WSP January 2025 Page 81 |
| 17.8.2 | Cost |
Mine and social closure costs have recently been updated in the June 2024 mine closure plan prepared by Enmin . The total cost is estimated at US$6.8 M assuming a Planned closure scenario in accordance with the LOM plan, inclusive of a 12.9% contingency (Table 17.1), while this increases to US$7.2 M assuming an Unplanned closure scenario. No Equipment Salvage cost is considered assuming this will be covered by MMC. Social closures costs will only be borne during unplanned closure of the mine. For planned closure, the Mine will have the opportunity to give sufficient notice to its employees on the closure of the mine, thus avoiding this additional cost. The planned closure cost estimate is adopted for cashflow model evaluation.
| Table 17-1 | MGM present closure obligation (Enmin 2024) |
| Cost (US$) | ||||||
| Item No. | Activity | Planned Closure | Unplanned Closure | |||
| 1 | Environmental Liability | 5,682,786 | 5,166,170 | |||
| 2 | Social Closure | 882,313 | ||||
| 3 | Equipment Salvage | |||||
| Sub-total | 5,682,786 | 6,048,483 | ||
| Administrative and Supervision costs @6% | 340,967 | 362,909 | ||
| 12.9% Contingency | 774,925 | 824,793 | ||
| Total Mine Closure Costs | 6,798,679 | 7,236,185 |
| 17.9 | Translating the ESIA into environmental and social management |
No ESIA and social management provided for review.
| 17.10 | QP’s opinion |
Whilst the MGM is currently on C&M, environmental, miscellaneous operational and quality assurance permits and certification should be renewed in preparation for recommencement of operations.
In the QP’s experience, mine closure costs can be a source of significant variability, generally on the downside. Bond liability requirements are generally a guide that reflects the government liability in the event of company default but do not always reflect the full cost of rehabilitation for the company. It is not unusual to find mine closure more than double the cost of legal compliance estimates.
The QP’s view is that whilst the estimates for Mine Closure generally reflect the legal compliance requirements, the actual cost of closure may be higher.
| Project No PS213686 Mazowe Mine S-K 1300 Technical Report Summary Bulawayo Mining Company Limited | WSP January 2025 Page 82 |
| 18 | Capital and operating costs |
Not applicable since this TRS is an Initial Assessment and no Mineral Reserves have been estimated.
Any future estimation of Mineral Reserves and potential recommencement of operations will require the support of an additional drilling and resource definition campaign and at least a pre-feasibility to feasibility level of evaluation.
| 19 | Economic analysis |
Not applicable since this TRS is an Initial Assessment and no Mineral Reserves have been estimated.
Any future estimation of Mineral Reserves and potential recommencement of operations will require the support of an additional drilling and resource definition campaign and at least a pre-feasibility to feasibility level of evaluation.
| 20 | Adjacent properties |
There are numerous similar historical projects located adjacent to or in the vicinity of the MGM (Figure 6.2).
Little information relating to exploration or production efforts by adjacent property owners is publicly available.
No data or other information from these historical adjacent properties were used in the preparation of this TRS.
| 21 | Other relevant data and information |
WSP is not aware of any other relevant data or information other than that disclosed in this TRS, that materially affects the information included in this TRS and that all material assumptions and parameters underpinning Mineral Resources and Mineral Reserves estimates continue to apply and have not materially changed.
| 22 | Interpretation and conclusions |
| 22.1 | Mineral Resources interpretations and conclusions |
Based on the information presented in this TRS, the QP’s key conclusions are as follows:
| — | The levels of understanding of the regional geology, local geology, and the nature and controls on mineralisation are high, and provide a solid foundation for geological modelling, Mineral Resource estimation, and mining and exploration geology. |
| — | The drilling, sampling, assay and QAQC techniques used for both exploration, and resource definition are consistent with standard industry practice, and are considered appropriate for the purposes of geological modelling and Mineral Resource estimation. |
| — | Grade estimates were not constrained to orebody wireframes during grade estimation but were constrained to orebody wireframes during Mineral Resource estimate reporting. |
| — | Estimates utilised all available samples i.e., channel, sludge, diamond drill core etc. |
| — | Dry BD of 2.9 t/m3 assigned for all mineralised domains. |
| — | Validation of the Mineral Resource estimates has not been reported. Standard industry practice is to conduct both visual, and statistical validation of estimates and present the findings of this work in the Mineral Resource report to provide the reader an appreciation of the robustness of the estimates. |
| — | Grade estimation within modelled mineralisation domains (constrained estimate) would likely result in an increase in contained metal. |
| — | Mining, processing, and market modifying factors, study assumptions and parameters are used to establish RPEE for the reporting of Mineral Resources. No significant risks exist that could impact the reliability and/or confidence of Mineral Resources estimates. |
| — | The MRMR technical report developed by BMC Zimbabwe covers a number of areas in sufficient detail; however, some areas require more detail to give the reader a more thorough understanding of the work that has been conducted, the results of the work and any inherent risks to the Mineral Resource estimate. |
| Project No PS213686 Mazowe Mine S-K 1300 Technical Report Summary Bulawayo Mining Company Limited | WSP January 2025 Page 83 |
| 22.2 | Mineral Reserves interpretations and conclusions |
Not applicable since this TRS is an Initial Assessment and no Mineral Reserves have been estimated.
For the historical 2018 Mineral Reserve estimate, the QP provides comment as follows:
| — | When last in operation in 2018 there was a significant gap in head grade delivered of 3.67 g/t compared to the Mineral Reserve grade of 6.37 g/t Au, warranting reconciliation and justification. This was attributable to a large proportion of ore mined and processed from Mineral Resource category rather than Mineral Reserve. The June 2018 Mineral Reserves compliance with the 2016 Edition of the SAMREC Code is called into question due to insufficient assurance of technical and economic feasibility. |
| — | The historical estimate is indicative and requires update to reflect resource definition via more modern CAD techniques and to reflect significant changes in cost structures and metal pricing in the intervening 6 years. |
| — | Any future estimation of Mineral Reserves and potential recommencement of operations will require the support of an additional drilling and resource definition campaign and at least a pre-feasibility to feasibility level of evaluation. |
| — | The QP approves of the conventional industry approach to defining Mineral Reserves and applying modifying factors, provided that operating performance measures are regularly updated. |
| — | The influx of contract artisanal miners in recent years under the supervision of the previous business administrator, now removed by BMC legal action, and associated poor safety statistics, has posed a risk to permitting and future operation. The QP understands that MMC Zimbabwe is now in the process of negotiations and removal of contract artisanal miners. It must be noted that the artisanal miners focused on shallow workings within 30 m of surface in areas outside the MGM resource and reserve base, and with underground workings flooded to the 3 Level (approximately 50 m below surface) there has been no depletion of resources. |
| Project No PS213686 Mazowe Mine S-K 1300 Technical Report Summary Bulawayo Mining Company Limited | WSP January 2025 Page 84 |
| 23 | Recommendations |
Based on the results presented in this TRS, and consistent with BMC Limited’s long standing operating practices, ongoing technical work will be performed on the Property as part of studies to improve confidence, decrease risk, and enable the conversion of Mineral Resources to Mineral Reserves.
The following items are recommended to sustain Mineral Resources and Mineral Reserves:
| 23.1 | Mineral Resources recommendations |
| — | Data and database management is an area that requires further work. The MGM would benefit from the introduction of a corporate database, with inbuilt validation routines and reporting functionality, to assist with what is a large quantity of geological information. |
| — | The estimated cost of this recommendation is US$1,000,000 across the BMC Limited portfolio of assets. |
| — | Data analysis is conducted; however, it is recommended that for future Mineral Resource estimates, deposit wide Exploratory Data Analysis (EDA) is undertaken prior to estimation, to ensure data is fit for purpose for geological modelling and Mineral Resource estimation. |
| — | It is recommended that a succinct geological modelling and Mineral Resource estimation process flow is developed and followed for future Mineral Resource estimates. |
| — | It is recommended that Mineral Resource estimation is constrained to modelled mineralisation domain wireframes, using the Au Cut-off Grade (COG) chosen by the QP at the time of estimation and reporting. |
| — | Review lithology, structural and mineralisation modelling practices. |
| — | It is recommended that studies to characterise the hydrogeology are included in future exploration programs. |
| — | Data analysis is conducted; however, it is recommended that for future Mineral Resource estimates, deposit wide EDA is undertaken prior to estimation, to ensure data is fit for purpose for geological modelling and Mineral Resource estimation. |
| — | It is recommended that Mineral Resource estimation is constrained to modelled mineralisation domain wireframes, using an appropriate Au COG. |
| — | A comparison between BD values determined from underground grab samples, and drill core should be undertaken to ensure that the mean values used for Mineral Resource estimation are appropriate, and that bias is not being incorporated into the Mineral Resource estimate. |
| — | Validation of the Mineral Resource estimates produced, or at least the documentation of validation work undertaken is an area that requires further work. Standard industry practice is to conduct both visual and statistical validation of estimates and present the findings of this work in the TRS, to give the reader an appreciation of the robustness of the estimates. |
| — | Review Mineral Resource classification methodology, and block assignment. |
| — | Mineral Resource reconciliation practices should be reviewed, and a system implemented that provides a measure of Mineral Resource estimate performance. Planned versus actual resource tonnages and grades should be developed and updated each time a Mineral Resource estimate is completed. It is recommended that mined development and production be reconciled monthly, and stope close-out reports be developed for each completed stope. |
| — | Infill surface drilling and exploration of the eastern continuity of the Mazowe deposits. Drilling proposed by MMC Zimbabwe is presented in Table 23.1. |
| Project No PS213686 Mazowe Mine S-K 1300 Technical Report Summary Bulawayo Mining Company Limited | WSP January 2025 Page 85 |
| Table 23-1 | Summary of proposed 2024 MMC Zimbabwe surface exploration drilling (MMC Zimbabwe 2024) |
| Mine Area | Nature of Work | Comment | ||||
| — | 600 m of trenching | — | To explore for along strike and down-dip extensions of the Mazowe deposits to the east. | |||
| Jumbo East | — | Infill diamond drilling (11 drill holes totalling 4,400 m) | — | Estimated Cost: US$528,000 | ||
| — | Timing: 2024 | |||||
| — | Estimated tonnage and grade: 2 Mt @ 5.50 g/t (353,658 oz) | |||||
| — | 800 m of trenching | — | To probe the down dip continuity of the Amatola orebody. | |||
| Mazowe South | — | Diamond drilling (10 drill holes totalling 4,000 m) | — | Estimated cost: US$480,000 | ||
| — | Timing: 2024 | |||||
| — | Estimated tonnage and grade: 580,000 t @ 5.50 g/t (102,561 oz) | |||||
| — | All paper-based estimation techniques should be converted to computer-based (digital) as soon as possible. |
| — | RPEE have been considered, and the parameters used are considered reasonable. |
| — | The MRMR technical report developed by MMC Zimbabwe covers a number of areas in sufficient detail; however, some areas require more detail to give the reader a more thorough understanding of the work that has been conducted, the results of the work and any inherent risks to the Mineral Resource estimate. |
| 23.2 | Mineral Reserves recommendations |
Not applicable since this TRS is an Initial Assessment and no Mineral Reserves have been estimated.
For the historical 2018 Mineral Reserve estimate, the QP provides recommendations as follows:
MGM is currently on C&M since August 2018 because of the failure of the sand retreatment project to perform in terms of throughput, head grade and recovery, and the declining tonnage and head grade from the underground operations over the period from 2016. The performance of the underground during 2017 and 2018 also suffered from a low level of capital investment in exploration and underground development, necessary to define accessible blocks to the required level of confidence and accuracy and to facilitate a well-planned development strategy and potential productivity improvements. More generally, the operation was constrained by a shortage of consumables and critical spares. Processing performance was impacted by the inability to secure reliable supplies of key consumables such cyanide.
In response, MMC Zimbabwe commissioned a conceptual scoping level study (Virimai, November 2018) to examine options for recommencing operations. The Virimai study appears to provide sufficient confidence to proceed to a more detailed prefeasibility level assessment. WSP’s view is that this work should proceed to provide sufficient confidence for estimation of a SAMREC compliant Mineral Reserve that is suitably supported by a business plan that demonstrates the technical and economic viability. This should include:
| — | Detailed mine prefeasibility assessment of underground options. This should include examination of options for productivity improvements, block access strategies and optimised targeting and sequencing of blocks, dewatering strategy, hoist capacity and process options. |
| — | Reconciliation of historical mine performance and individual stope reconciliation. |
| Project No PS213686 Mazowe Mine S-K 1300 Technical Report Summary Bulawayo Mining Company Limited | WSP January 2025 Page 86 |
| — | Once ownership litigation is successfully settled, the tailings retreatment project should be back analysed to confirm reasons for plant underperformance in throughput and head grade. This should include review of the sand tailings in-situ grades, scheduled head grades, and mining strategy. |
The required technical studies should be completed to confirm that re-establishment of commercial production and expansion of production beyond historical benchmarks is both technically feasible and economically viable.
After future Mineral Resource and Mineral Reserve updates, a stope optimisation exercise is recommended. Stope optimisation allows for the rapid development of valid stope shapes according to specified criteria.
More detailed analysis should also be completed in the following areas:
| — | Review actual mining widths compared to applied widths, unplanned dilution levels, adjustment of metal prices, and consideration of exchange rates and revenue constraints. The APF and BRF should be based on actual data and applied by section and stope. Actual mining widths achieved by survey measurement and reconciliation should be compared with average stope widths applied (plus allowance for unplanned dilution). |
| — | Unplanned levels of dilution of 23-25% in combination with the minimum mining width assumptions should be compared with reconciliation statistics from resource, reserve, break, hoist and reconciled mill feed. Planned and achieved stope widths should be compared to properly reconcile and guard against excess dilution. |
| — | Consideration should be given to assessment of the capital development, dewatering and extraction costs for accessing and exploiting satellite blocks located at increased distance from main haulage horizons and shafts for hoisting of the ore. Increased costs for accessing these blocks needs to be considered to determine if it is economic to mine. The size of the blocks to support this access will also need to be considered as increased capital costs are more easily borne by larger block inventories. |
| — | Gold and silver prices should be updated in line with the 3-year trailing average and monitored against prevailing spot prices and/or long-term forecasts on a regular six-monthly basis. Pay limits and cashflow models should be updated accordingly. |
| — | Allowance for the influence of exchange rates, inflation and constraints on revenue received from the sale of gold to the Zimbabwean government is required. WSP understands that recent payment has been mandated as a combination of local currency and United States Dollars (USD), the impact of which upon revenue needs to be monitored and quantified in USD terms. |
| 24 | References |
ACZ (Airport Company of Zimbabwe (Private) Limited (2024), Joshua Mqabuko Nkomo International Airport, Available at: https://www.acz.co.zw/Airports/Details/6
BMC (Bulawayo Mining Company (Private) Limited) (2023), How Mine, Mineral Reserves and Mineral Resources (MRMR) Estimates, 31 December 2023, Report on file at Metallon Management (Private) Limited, Harare, Zimbabwe.
GFM (Gold Fields of Mazowe (Private) Limited) (2018), Gold Fields of Mazowe Mineral Reserves and Resources 30th June 2018, Report on file at Metallon Management Services Ltd., Harare, Zimbabwe.
GFM (2016), Amatola Surface Exploration: Reverse Circulation Drilling Summary 2016, Report on file at Gold Fields of Mazowe (UK) Limited, United Kingdom.
| Project No PS213686 Mazowe Mine S-K 1300 Technical Report Summary Bulawayo Mining Company Limited | WSP January 2025 Page 87 |
Golder Associates Pty Ltd (Golder) (2020), Metallon Corporation Limited (UK) – Competent Person’s Report for the Mazowe Mine, Zimbabwe, Prepared for Metallon Corporation Limited (UK), United Kingdom.
Kersten R.W.O., April 2014, Mazowe Mine: Rock Mechanics Review
MMC Zimbabwe (Mazowe Mining Company (Private) Limited) (2024), MMC: Current Status Report June 2024, 4 pp.
Metallon Gold Zimbabwe (Pvt) Ltd (2013-14), Mazowe Mine, Environmental Management Plan, 182 pp.
Meteoblue 2019, Climate Mazowe, Available at: https://www.meteoblue.com/en/weather/historyclimate/climatemodelled/mazowe_zimbabwe_886384
NRZ (2024a), Freight Services, Available at: https://nrz.co.zw/freight-services/
NRZ (2024b), Passenger Services, Available at: https://nrz.co.zw/passenger-services/
Prendergast, MD (2004), The Bulawayan Supergroup: a late Archaean passive margin-related large igneous province in the Zimbabwe craton, Journal of the Geological Society, vol.161, pp. 431-445.
RBZ (Reserve Bank of Zimbabwe) (2024), The 2024 Monetary Policy Statement at a Glance, 5 April 202413pp.
SAMREC (2016), The South African Code for the Reporting of Exploration Results, Mineral Resources and Mineral Reserves (The SAMREC Code), 2016 Edition.
SRK (SRK Consulting (UK) Ltd) (2012), A Competent Persons’ Report on the Mineral Assets of Metallon Gold Zimbabwe (Private) Limited, Republic of Zimbabwe, Prepared for Metallon Gold Zimbabwe (Private) Limited, Republic of Zimbabwe, Submitted November 2012, 79 pp.
SRK Consulting (South Africa) (Pty) Ltd (SRK), 2015, Mazowe Mine, Multi-reef Intersection Mining Presentation.
SRK Consulting (South Africa) (Pty) Ltd (SRK) (2015), Rock Engineering Review of Metallon Gold Operations, Prepared for Metallon Gold Zimbabwe (Private) Limited, Republic of Zimbabwe, Submitted March 2015, 92 pp.
Suntech Geomet Laboratories (2017), Commissioning Report No. 1: Process Optimisation of the Mazowe Gold Concentrator, Prepare for Goldfields of Mazowe, Submitted 7 October 2017, 11pp.
Virimai Projects (Virimai) (2018), High Level Assessment Mazowe Mine Growth Options, Prepared for Metallon Gold Zimbabwe (Private) Limited, Submitted November 2018.
Waterkings (Waterkings Environment Consultancy) (2014), Mazowe Tailings Dam and Sands Floatation Plant Environmental Impact Assessment (EIA) Report, prepared for Metallon Gold Zimbabwe (Private) Limited, pp. 59 – 66
| Project No PS213686 Mazowe Mine S-K 1300 Technical Report Summary Bulawayo Mining Company Limited | WSP January 2025 Page 88 |
| 25 | Reliance on information provided by the Registrant |
Except for the purposes legislated under Canadian/USA securities law, any use of this report by any third party is at that party’s sole risk.
The QPs have wholly relied upon the Registrant for the following:
| — | Macroeconomic trends, data and assumptions, and interest rates (Sections 18 and 19). |
| — | Marketing information and plans within the control of the Registrant (Sections 16, 18, and 19). |
| — | Legal matters outside the expertise of the QPs, such as statutory and regulatory interpretations affecting the mine plan (Sections 3, 13, 15, and 17). |
| — | Environmental matters outside the expertise of the QPs (Section 17). |
| — | Accommodations the Registrant commits or plans to provide to local individuals or groups in connection with its mine plan (Section 17). |
| — | Governmental factors outside the expertise of the QPs (Section 17). |
The QPs consider it reasonable to rely upon the Registrant for the above information, based on the QPs’ past and ongoing interactions with the subject-matter experts in these areas employed or engaged by the Registrant, as well as the Registrant’s considerable experience mining at the Property. Further, the QPs have taken all appropriate steps, in their professional opinion, to ensure that the above information provided by the Registrant is accurate in all material respects and have no reason to believe that any material facts have been withheld or misstated.
| Project No PS213686 Mazowe Mine S-K 1300 Technical Report Summary Bulawayo Mining Company Limited | WSP January 2025 Page 89 |

| Project No PS213686 Mazowe Mine S-K 1300 Technical Report Summary Bulawayo Mining Company Limited | WSP January 2025 Page 90 |
This Report is provided by WSP Australia Pty Limited (WSP) for Bulawayo Mining Company Ltd (Client) in response to specific instructions from the Client and in accordance with WSP’s proposal dated 29 May 2024 and agreement with the Client dated 30 May 2024 (Agreement).
Permitted purpose
This Report is provided by WSP for the purpose described in the Agreement and no responsibility is accepted by WSP for the use of the Report in whole or in part, for any other purpose (Permitted Purpose).
Qualifications and assumptions
The services undertaken by WSP in preparing this Report were limited to those specifically detailed in the Report and are subject to the scope, qualifications, assumptions and limitations set out in the Report or otherwise communicated to the Client.
Except as otherwise stated in the Report and to the extent that statements, opinions, facts, conclusion and / or recommendations in the Report (Conclusions) are based in whole or in part on information provided by the Client and other parties identified in the report (Information), those Conclusions are based on assumptions by WSP of the reliability, adequacy, accuracy and completeness of the Information and have not been verified. WSP accepts no responsibility for the Information.
WSP has prepared the Report without regard to any special interest of any person other than the Client when undertaking the services described in the Agreement or in preparing the Report.
Use and reliance
This Report should be read in its entirety and must not be copied, distributed or referred to in part only. The Report must not be reproduced without the written approval of WSP. WSP will not be responsible for interpretations or conclusions drawn by the reader. This Report (or sections of the Report) should not be used as part of a specification for a project or for incorporation into any other document without the prior agreement of WSP.
WSP is not (and will not be) obliged to provide an update of this Report to include any event, circumstance, revised Information or any matter coming to WSP’s attention after the date of this Report. Data reported and Conclusions drawn are based solely on information made available to WSP at the time of preparing the Report. The passage of time; unexpected variations in ground conditions; manifestations of latent conditions; or the impact of future events (including (without limitation) changes in policy, legislation, guidelines, scientific knowledge; and changes in interpretation of policy by statutory authorities); may require further investigation or subsequent re-evaluation of the Conclusions.
This Report can only be relied upon for the Permitted Purpose and may not be relied upon for any other purpose. The Report does not purport to recommend or induce a decision to make (or not make) any purchase, disposal, investment, divestment, financial commitment or otherwise. It is the responsibility of the Client to accept (if the Client so chooses) any Conclusions contained within the Report and implement them in an appropriate, suitable and timely manner.
In the absence of express written consent of WSP, no responsibility is accepted by WSP for the use of the Report in whole or in part by any party other than the Client for any purpose whatsoever. Without the express written consent of WSP, any use which a third party makes of this Report or any reliance on (or decisions to be made) based on this Report is at the sole risk of those third parties without recourse to WSP. Third parties should make their own enquiries and obtain independent advice in relation to any matter dealt with or Conclusions expressed in the Report.
Disclaimer
This report contains the expressions of professional opinions of the Authors based on (i) information available at the time of preparation, (ii) data supplied by MMC [and others], and (iii) the assumptions, conditions, and qualifications set forth in this report. The quality of information, conclusions, and estimates contained herein are consistent with the stated levels of accuracy as well as the circumstances and constraints under which the mandate was performed.
| Project No PS213686 Mazowe Mine S-K 1300 Technical Report Summary Bulawayo Mining Company Limited | WSP January 2025 Page 91 |
Exhibit 96.3
Bulawayo Mining Company Limited
Redwing Mine
S-K 1300 Technical Report Summary
January 2025
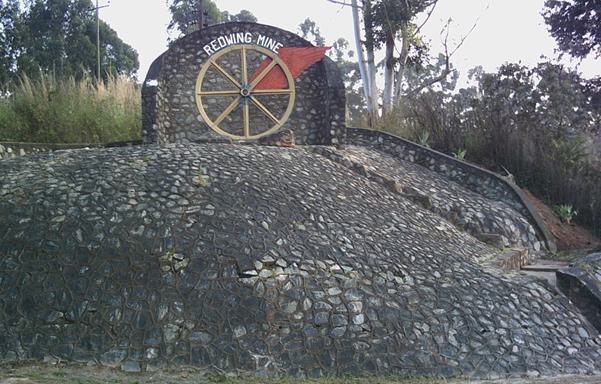

| Our ref: Namib Minerals Redwing and Mazowe WSP Consents 1 April 26 | Level 27, 680 George Street |
| Sydney NSW 2000 | |
| Your ref: Namib Minerals Redwing and Mazowe WSP Consents 1 April 26 | GPO Box 5394 |
| Sydney NSW 2001 | |
| 1 April 2026 | |
| Tel: +61 2 9272 5100 | |
| Fax: +61 2 9272 5101 | |
| www.wsp.com |
Namib Minerals
Suite 210, 2nd Floor, Windward III, Regatta Office Park, PO Box 500 Grand Cayman,
Cayman Islands, KY1-1106
Dear All
WSP Consent - Redwing and Mazowe Mine TRS
Please take this letter as confirmation from this date onwards, WSP Australia Pty Limited, take ownership and is responsible for the preparation of the technical reports summary titled Redwing Mine S-K 1300 Technical Report Summary with an effective date of 31 December 2023, and the technical report summary titled Mazowe Mine S-K 1300 Technical Report Summary with an effective date of 31 December 2023.
Furthermore, in each case as signed and certified by WSP Australia Pty Limited (collectively, the “Technical Report Summaries”), WSP hereby states that it is the QP Firm responsible for the preparation of those Technical Report Summaries.
| Yours sincerely | |
| /s/ Colin McVie | |
| Colin McVie | |
| Technical Director Mine Advisory |
WSP Australia Pty Limited ABN 80 078 004 798

Redwing Mine
S-K 1300 Technical Report Summary
Bulawayo Mining Company Limited
WSP
Level 3, 51-55 Bolton St
Newcastle NSW 2300
PO Box 1162
Newcastle NSW 2300
Tel: +61 2 4929 8300
Fax: +61 2 4929 8382
wsp.com
| Rev | Date | Details | ||
| D | 29/01/2025 | Final report |
| Name | Date | Signature | ||||
| Aaron Radonich | /s/ Aaron Radonich | |||||
| Prepared by: | 29/01/2025 | |||||
| Allan Blair | /s/ Allan Blair | |||||
| Reviewed by: | Jerry DeWolfe | 09/01/2025 | /s/ Jerry DeWolfe |
| Table of contents |
| 1 | Executive summary | 1 |
| 1.1 | Property description and ownership | 1 |
| 1.2 | Geology and mineralisation | 1 |
| 1.3 | Exploration | 1 |
| 1.4 | Mineral Resources estimates | 2 |
| 1.5 | Mineral Reserves estimates | 3 |
| 1.6 | Capital and operating costs | 3 |
| 1.7 | Permitting requirements | 3 |
| 1.8 | QPs’ conclusions and recommendations | 3 |
| 1.8.1 | Mineral Resources | 3 |
| 1.8.2 | Mineral Reserves | 5 |
| 2 | Introduction | 7 |
| 2.1 | Registrant information | 7 |
| 2.2 | Terms of reference and purpose | 8 |
| 2.3 | Sources of information | 11 |
| 2.4 | Personal inspection | 11 |
| 2.5 | Previously filed Technical Report Summaries | 11 |
| 2.6 | WSP declaration | 11 |
| 3 | Property description | 12 |
| 3.1 | Property location | 12 |
| 3.2 | Title and mineral rights | 12 |
| 3.3 | Encumbrances | 13 |
| 3.4 | Risks to access, title, or right to perform work | 13 |
| 3.5 | Agreements and royalties | 14 |
| 4 | Accessibility, climate, local resources, infrastructure, and physiography | 15 |
| 4.1 | Topography, elevation, and vegetation | 15 |
| 4.2 | Access | 15 |
| 4.3 | Proximity to population centres | 15 |
| 4.4 | Climate | 15 |
| 4.5 | Local resources and existing infrastructure | 16 |
| 4.5.1 | Power supply | 16 |
i
| CONTENTS (Continued) | ||
| 4.5.2 | Water supply | 16 |
| 4.5.3 | Personnel | 17 |
| 4.5.4 | Suppliers | 17 |
| 5 | History | 17 |
| 5.1 | Exploration and ownership history | 17 |
| 5.2 | Production history | 18 |
| 5.3 | Production reconciliation | 19 |
| 5.4 | Aggregate fiscal year production | 19 |
| 5.5 | Exploration and development by previous owners or operators | 19 |
| 5.6 | Liabilities | 19 |
| 6 | Geological setting, mineralisation, and deposit | 20 |
| 6.1 | Regional geology | 20 |
| 6.1.1 | Mozambique Greenstone Belt | 20 |
| 6.1.2 | Granitoids | 20 |
| 6.2 | Structural setting | 21 |
| 6.3 | Local and property geology | 21 |
| 6.3.1 | Felsite | 21 |
| 6.3.2 | MSZ | 21 |
| 6.4 | Deposit type and geology | 22 |
| 6.5 | Mineralisation | 22 |
| 7 | Exploration | 25 |
| 7.1 | Diamond drilling | 25 |
| 7.2 | QP’s opinion | 33 |
| 8 | Sample preparation, analyses, and security | 34 |
| 8.1 | Sampling techniques | 34 |
| 8.1.1 | Core sampling | 34 |
| 8.1.2 | Channel sampling | 34 |
| 8.1.3 | Grab sampling | 34 |
| 8.1.4 | Drive face and stope-bench sampling | 34 |
| 8.1.5 | Sample security | 34 |
ii
| CONTENTS (Continued) | ||
| 8.2 | Dry bulk density determination | 34 |
| 8.3 | Sample preparation, analysis and procedures | 34 |
| 8.4 | Quality Assurance Quality Control | 35 |
| 8.4.1 | Drill core | 35 |
| 8.4.2 | Channel and grab samples | 35 |
| 8.4.3 | Certified Reference Material | 36 |
| 8.4.4 | Blanks | 36 |
| 8.4.5 | Duplicates | 36 |
| 8.5 | QP’s opinion on adequacy | 36 |
| 9 | Data verification | 37 |
| 9.1 | Mineral Resources data verification | 37 |
| 9.1.1 | Data verification conducted by RMC Zimbabwe | 37 |
| 9.1.2 | Data verification conducted by WSP | 37 |
| 9.1.3 | Limitations on exploration and Mineral Resources data verification | 37 |
| 9.2 | Mining and Mineral Reserves data verification | 38 |
| 9.3 | Geotechnical data verification | 38 |
| 9.4 | Hydrogeology and hydrology data verification | 39 |
| 9.4.1 | Hydrology | 41 |
| 9.4.2 | Hydrogeology | 41 |
| 9.5 | Processing and recovery methods data verification | 41 |
| 10 | Mineral processing and metallurgical testing | 42 |
| 10.1 | Nature and extent of mineral processing and metallurgical testing | 42 |
| 10.1.1 | Mineral processing | 42 |
| 10.1.2 | Process testwork | 43 |
| 10.2 | Metallurgical sampling representativity | 43 |
| 10.3 | Details of analytical or testing laboratories | 44 |
| 10.4 | Recovery Estimates | 44 |
| 10.5 | QP’s opinion on adequacy of the data collected | 44 |
| 11 | Mineral Resource estimates | 45 |
| 11.1 | Key assumptions, parameters, and methods | 45 |
| 11.1.1 | Care and maintenance | 45 |
| 11.1.2 | Resource database | 45 |
iii
| CONTENTS (Continued) | ||
| 11.1.3 | Geological interpretation | 45 |
| 11.1.4 | Data preparation | 45 |
| 11.1.5 | Exploratory data analysis | 45 |
| 11.1.6 | Dry bulk density | 46 |
| 11.1.7 | Block models | 46 |
| 11.1.8 | Grade interpolation parameters | 47 |
| 11.1.9 | Grade estimation | 47 |
| 11.1.10 | Model validation | 47 |
| 11.2 | Mineral Resources classification | 48 |
| 11.2.1 | Measured Mineral Resources | 48 |
| 11.2.2 | Indicated Mineral Resources | 49 |
| 11.2.3 | Inferred Mineral Resources | 50 |
| 11.3 | Cut-off grade, price, and justification | 50 |
| 11.3.1 | Tonnage-grade factors | 51 |
| 11.4 | Mineral Resources statement | 52 |
| 11.5 | Uncertainty in the estimates of Inferred, Indicated, and Measured Mineral Resources | 54 |
| 11.6 | QP’s opinion on factors likely to influence the prospect of economic extraction | 55 |
| 12 | Mineral Reserves estimates | 55 |
| 13 | Mining methods | 56 |
| 13.1 | Introduction | 56 |
| 13.2 | Parameters relative to the design and schedule | 56 |
| 13.2.1 | Geotechnical | 56 |
| 13.2.2 | Hydrogeological | 57 |
| 13.3 | Production parameters | 57 |
| 13.3.1 | Production rates | 57 |
| 13.3.2 | Expected mine life | 57 |
| 13.3.3 | Mining model | 58 |
| 13.3.4 | Mining dilution and recovery factors | 58 |
| 13.4 | Mining fleet, machinery, and personnel requirements | 59 |
| 13.5 | Scheduling results | 59 |
| 13.6 | Mining unit dimensions | 60 |
| 13.7 | Mine layout | 60 |
iv
CONTENTS (Continued)
| 14 | Processing and recovery methods | 61 |
| 14.1 | Processing methodologies and flowsheets | 61 |
| 14.2 | Processing plant throughput and characteristics | 62 |
| 14.3 | Primary and secondary crushing | 63 |
| 14.3.1 | Primary crushing | 63 |
| 14.3.2 | Secondary crushing | 63 |
| 14.4 | Downhill conveying | 63 |
| 14.5 | Product sampling | 63 |
| 14.6 | Product stockyard | 63 |
| 14.7 | Offshore tertiary crushing and screening | 63 |
| 14.8 | Energy and water process materials requirements | 63 |
| 14.8.1 | Mine power supply | 63 |
| 14.8.2 | Mine water management system | 64 |
| 14.9 | QP’s opinion | 64 |
| 15 | Infrastructure | 64 |
| 15.1 | Rail access | 64 |
| 15.2 | Port access | 64 |
| 15.3 | Roads | 64 |
| 15.4 | Camp | 64 |
| 15.5 | Tailings | 64 |
| 15.6 | Potable water and wastewater | 65 |
| 15.7 | Accommodation and offices | 65 |
| 15.8 | Non process infrastructure | 65 |
| 15.9 | Information and communications technology (ICT) systems | 65 |
| 15.10 | Other support facilities and utilities | 65 |
| 16 | Market studies | 66 |
| 16.1 | Nature and material terms of agency relationships | 66 |
| 16.2 | Results of relevant market studies | 66 |
| 16.3 | Commodity price projections | 66 |
v
CONTENTS (Continued)
| 16.4 | Mining and processing | 68 |
| 16.5 | Product transport and handling | 68 |
| 16.6 | Hedging arrangements | 68 |
| 16.7 | Forward sales contracts | 68 |
| 16.8 | Contracts with affiliated parties | 68 |
| 17 | Environmental studies, permitting, and plans, negotiations, or agreements with local individuals or groups | 69 |
| 17.1 | Introduction | 69 |
| 17.2 | Project context | 69 |
| 17.3 | Project permitting | 69 |
| 17.4 | Environmental and social impact assessment | 70 |
| 17.4.1 | Biodiversity and natural resources | 70 |
| 17.4.2 | Managing impacts on water | 70 |
| 17.4.3 | Acid and metalliferous drainage (AMD) | 70 |
| 17.4.4 | Erosion and protection of soils | 70 |
| 17.4.5 | Noise and vibration | 70 |
| 17.4.6 | Air quality | 70 |
| 17.4.7 | Local climate impacts | 70 |
| 17.4.8 | Greenhouse gas emissions | 70 |
| 17.4.9 | Resources use and non-mineral waste | 70 |
| 17.5 | Project standards | 71 |
| 17.6 | Stakeholder engagement | 71 |
| 17.6.1 | Stakeholder engagement plan | 71 |
| 17.6.2 | Consultation | 71 |
| 17.7 | Cultural, economic, and social conditions | 71 |
| 17.7.1 | Cultural heritage | 71 |
| 17.7.2 | Local landscape | 71 |
| 17.7.3 | Contributing to the national and local economy | 71 |
| 17.7.4 | Establishing a social management framework | 71 |
| 17.7.5 | Impacts on land use and access | 71 |
| 17.7.6 | Protecting community health and safety | 72 |
| 17.7.7 | Protecting the workforce | 72 |
| 17.7.8 | Commitment to local procurement and hiring | 72 |
| 17.8 | Mine closure | 72 |
| 17.8.1 | Plan | 72 |
| 17.8.2 | Cost | 73 |
| 17.9 | Translating the ESIA into environmental and social management | 73 |
vi
CONTENTS (Continued)
| 17.10 | QP’s opinion | 74 |
| 18 | Capital and operating costs | 74 |
| 19 | Economic analysis | 74 |
| 20 | Adjacent properties | 75 |
| 21 | Other relevant data and information | 75 |
| 22 | Interpretation and conclusions | 76 |
| 22.1 | Mineral Resources interpretations and conclusions | 76 |
| 22.2 | Mineral Reserves interpretations and conclusions | 76 |
| 23 | Recommendations | 77 |
| 23.1 | Mineral Resources recommendations | 77 |
| 23.2 | Mineral Reserves recommendations | 77 |
| 24 | References | 78 |
| 25 | Reliance on information provided by the Registrant | 79 |
List of tables
| Table 1.1 | RGM underground Measured and Indicated Mineral Resource estimate as of 31 December 2023 | 2 |
| Table 1.2 | RGM underground Inferred Mineral Resource estimate as of 31 December 2023 | 2 |
| Table 2.1 | List of acronyms and abbreviations used in this TRS | 9 |
| Table 2.2 | List of QPs | 11 |
| Table 5.1 | Mineral Resource summary comparison end December 2022 to end December 2023 | 19 |
| Table 6.1 | Structural deformation events | 21 |
| Table 9.1 | Summary of laboratory results (SRKSA (2016)) | 38 |
| Table 11.1 | Variography summary (KDM 2018) | 46 |
| Table 11.2 | Block dimension schemes for the 30 June 2018 block models (KDM 2018) | 46 |
vii
List of tables continued
| Table 11.3 | Kriging parameters generated from variographic analysis (KDM 2018) | 47 |
| Table 11.4 | 31 December 2023 COG estimation parameters | 51 |
| Table 11.5 | RGM underground Measured and Indicated Mineral Resource estimate as of 31 December 2023 | 53 |
| Table 11.6 | RGM underground Inferred Mineral Resource estimate as of 31 December 2023 | 53 |
| Table 13.1 | Block call factors 2012–2018 (RGM Operations Reports) | 58 |
| Table 13.2 | Preliminary mining design parameters | 60 |
| Table 16.1 | Zimbabwean inflation rate and economic indicators (Trading Economics, 30 May 2024) | 67 |
| Table 17.1 | RGM present closure obligation (Enmin 2024) | 73 |
| Table 20.1 | Summary of adjacent claims (Virimai 2022) | 75 |
List of figures
| Figure 2.1 | BMC Limited corporate structure | 7 |
| Figure 3.1 | Property location map | 12 |
| Figure 3.2 | RGM ML 34 boundary | 13 |
| Figure 4.1 | Climate statistics for Penhalonga, Zimbabwe (Meteoblue, 2024) | 16 |
| Figure 5.1 | RGM total gold production 1981–2023 | 18 |
| Figure 6.1 | Regional geology of Zimbabwe showing locations of greenstone belts (Prendergast 2004) | 20 |
| Figure 6.2 | RGM MSZ schematic section | 22 |
| Figure 6.3 | Penhalonga Valley local geology | 23 |
| Figure 6.4 | RGM surface geology | 23 |
| Figure 6.5 | RGM local stratigraphy | 24 |
| Figure 7.1 | Plan view of all drill hole collars and existing mine development | 30 |
| Figure 9.1 | Catchment boundaries of Zimbabwe (BMC Limited) | 39 |
| Figure 9.2 | Sub-catchment boundaries of Save Zimbabwe (BMC Limited) | 40 |
| Figure 10.1 | Process plant production and recovery 1981–2023 | 42 |
| Figure 11.1 | 40L 020 Bund block grade and drill hole comparison | 48 |
| Figure 13.1 | RGM mine layout looking south | 61 |
| Figure 14.1 | RGM processing flowsheet (Virimai, 2018) | 62 |
| Figure 16.1 | Historical (blue) gold spot price and forecast (grey) in US$/oz (Trading Economics 30 May 2024) | 67 |
| Figure 16.2 | Zimbabwean gold currency exchange rate ZiG/USD (Trading Economics, 1 July 2024) | 68 |
List of appendices
| Appendix A | Limitations statement |
viii
| 1 | Executive summary |
| 1.1 | Property description and ownership |
The Redwing Gold Mine (RGM) [or the Property] is located in Penhalonga, some 20 km north-northeast of the City of Mutare (latitude 18°52’S and longitude 32°41’E), Manicaland Province, in the Mutare Mining District of Zimbabwe. The RGM is situated within the ML 34 tenement which has a surface area of 1,254 hectares (ha).
Redwing Mining Company (Private) Limited Zimbabwe (RMC Zimbabwe), a wholly owned subsidiary of KD Mining Company (UK) Limited (KDM UK), which is a wholly owned subsidiary of Bulawayo Mining Company Limited (BMC Limited), currently holds Mining Lease (ML) 34.
The RGM is accessible to major commercial centres via a well-established network of primary asphalt roads and is accessible from the surrounding communities through secondary gravel roads. Penhalonga has a population of approximately 8,000, and Harare has a population of approximately 1.5 million.
Access to the mine site and to the ore is authorised by the applicable mining legislation, and RMC Zimbabwe’s title and mining rights. Mining exploration and exploitation works conducted or to be conducted on site are authorised in accordance with the applicable legislation, and RMC Zimbabwe’s title and mining rights.
| 1.2 | Geology and mineralisation |
The RGM is located within the Mutare Greenstone Belt (MGB), which extends from the Mozambique Belt in the east, into the granites and gneisses of the Zimbabwe Craton in the west. The geology is dominated by an east-west trending series of metavolcanics consisting of olivine cumulates, komatiites, komatiitic basalts and high iron tholeiites. The rocks are extrusive, indicated by the presence of spinifex texture and pillow lavas as well as lenses of intercalated clastic sediments and discontinuous strings of Banded Iron Formation (BIF). The MGB is bounded by the Penhalonga Diorite to the north and south.
The local geology around the RGM includes an intrusive felsite consisting of a tabular micro-granitic body. The felsite lies in the core of the Penhalonga synform and it is the folding of this micro-granitic sheet within the diorite that is believed to be responsible for the localisation of gold mineralisation within Mineralised Shear Zones (MSZ).
Mineralisation within the MSZ (narrow reefs) is distinctly limited to physical deformation that has allowed the migration of hydrothermal fluids resulting in the deposition of quartz, sulphides and gold. While comparatively high gold values are associated with grey quartz and pyrite impregnation, zones of sheared and propylitised diorite commonly form part of contiguous reef structure.
The orebody strikes east-west and dips at a locally variable but shallow angle of approximately 35° to the south. At its widest, the orebody attains a thickness of approximately 7 m. It has been worked on a strike length of more than 2,500 m.
The RGM orebody boundaries are clearly defined, and the mineralisation envelope is defined by assay cut-offs.
| 1.3 | Exploration |
Diamond core drilling is the drilling method employed at the RGM, with core sizes typically AXT (35.51 mm core diameter) and BQ (36.50 mm core diameter) for evaluation and exploration drill holes respectively. Diamond drill core is logged and sampled on a 1 m interval, depending on geology. Samples are taken to at least 1 m beyond the geologically defined mineralisation boundary in all drill holes. For underground evaluation and exploration drill holes, full core is sampled, while for surface exploration drill holes, mineralised zones only are split in half using a core splitter, with half the core being sent for assay and the other half kept for future reference.
Diamond drill core and channel samples were used for the purposes of geological modelling and Mineral Resources estimation.
Geotechnical laboratory results are sparse and incomplete.
| Project No PS213686 | WSP |
| Redwing Mine | January 2025 |
| S-K 1300 Technical Report Summary | Page 1 |
| Bulawayo Mining Company Limited |
| 1.4 | Mineral Resources estimates |
This report is prepared as a Technical Report Summary (TRS) for the Property, in accordance with the United States Securities and Exchange Commission’s (SEC) Modernized Property Disclosure Requirements for Mining Registrants as described in Subpart 229.1300 of Regulation S K, Disclosure by Registrants Engaged in Mining Operations (S-K 1300) and Item 601(b)(96).
The disclosure of Mineral Resources under this report is based upon the Qualified Person’s (QP’s) initial assessment. The Mineral Resources estimate has been defined, classified, and reported according to the guiding principles and minimum standards set out in SAMREC (2016). WSP’s view is that there are no material differences between SAMREC (206), and S-K 1300 requirements for the reporting of Mineral Resources.
The relevant Qualified Persons (QPs) are satisfied that there has been sufficient orebody knowledge work completed to support Reasonable Prospects for Economic Extraction (RPEE) at the Property from a Mineral Resources perspective. The initial assessment incorporates the QPs’ qualitative evaluation of relevant technical and economic factors likely to influence the prospect of economic extraction to establish the economic potential of the mining property or project (Section 11.3).
Evaluation data collection includes diamond drilling, channel sampling and sludge drilling.
Given there has been no mining or exploration conducted since the mine was placed on C&M, while the workings have been flooded, in the QP’s opinion the 2018 assumptions for definition of the resource base remain current.
For the purpose of demonstrating the capacity to exploit the resource as required under S-K 1300, the QPs have reviewed a high level cashflow model and are satisfied that the scale of the resource and free cashflow after operating costs will cover the cost of re-establishing access to underground workings, dewatering underground workings, surface infrastructure, and plant refurbishment/replacement. A process recovery of 90% for gold was applied for cashflow modelling consistent with recent historical averages and fixed tail estimates. Further assumptions are provided under Section 11.3 and Table 11-5.
Table 1.1 presents the underground Measured and Indicated Mineral Resources (exclusive of Mineral Reserves) reported as at 31 December 2023 on an in-situ basis.
Table 1.1 RGM underground Measured and Indicated Mineral Resource estimate as of 31 December 2023
| Category | Tonnage (Mt) | Au Grade (g/t) | Au Metal (koz) | |||||||||
| Underground | ||||||||||||
| Measured Resources | 1.45 | 2.92 | 136 | |||||||||
| Indicated Resources | 8.20 | 3.99 | 1,052 | |||||||||
| Grand Total | 9.65 | 3.83 | 1,188 | |||||||||
Notes: Mt = million tonnes; Au Grade g/t = gold grams per tonne; koz = thousand ounces.
Table 1.2 presents the underground Inferred Mineral Resources reported as at 31 December 2023 on an in-situ basis.
Table 1.2 RGM underground Inferred Mineral Resource estimate as of 31 December 2023
| Category | Tonnage (Mt) | Au Grade (g/t) | Au Metal (koz) | |||||||||
| Underground | ||||||||||||
| Inferred Resources | 15.83 | 2.61 | 1,328 | |||||||||
| Grand Total | 15.83 | 2.61 | 1,328 | |||||||||
Notes: Mt = million tonnes; Au Grade g/t = gold grams per tonne; koz = thousand ounces.
It should be noted that the underground Mineral Resources estimate for the Property is reported exclusive of Mineral Reserves. The Property does not have a current Mineral Reserve.
It should be noted that the sands (tailings) Mineral Resources estimate for the Property is not included as part of the Mineral Resources for the Property, as the RGM does not currently possess a processing facility capable of processing the sands (tailings) material.
The Mineral Resources presented in this Section are not Mineral Reserves, and do not reflect demonstrated economic viability. The reported Inferred Mineral Resources are considered too speculative geologically to have the economic considerations applied to them that would enable them to be categorised as Mineral Reserves. There is no certainty that all or any part of this Mineral Resource will be converted into Mineral Reserve.
All figures are rounded to reflect the relative accuracy of the estimates and totals may not add correctly.
| Project No PS213686 | WSP |
| Redwing Mine | January 2025 |
| S-K 1300 Technical Report Summary | Page 2 |
| Bulawayo Mining Company Limited |
Based on the geological results presented in this TRS, supported by the assumptions made by RMC Zimbabwe (presented in Section 11.3), it is the QP’s opinion that the Mineral Resources have RPEE.
| 1.5 | Mineral Reserves estimates |
Not applicable since this TRS is an Initial Assessment and no Mineral Reserves have been estimated.
| 1.6 | Capital and operating costs |
Not applicable since this TRS is an Initial Assessment and no Mineral Reserves have been estimated.
Any future estimation of Mineral Reserves and potential recommencement of operations will require the support of an additional drilling and resource definition campaign and at least a pre-feasibility to feasibility level of evaluation.
| 1.7 | Permitting requirements |
The ML is inspected on an annual basis by the Government of Zimbabwe. The area covered by the ML was surveyed and declared to be 1,254.2 ha. The ML 34 is inspected annually, and the current certificate is valid till 13 August 2025.
There is also a requirement for renewal of environmental and miscellaneous operating permits as outlined in Section 17.3 before recommencement of active mining operations. All the environmental and miscellaneous licensing is currently expired.
There has been a significant increase in artisanal gold mining activities during the period of business administration to the present day, confined to areas outside the fenced RGM tenement area. The previous business administrator (appointed July 2020, removed by court action September 2022) engaged parties under contract for this purpose, with the main contractors nominated as Betterbrands and Probatek. Poor artisanal mining practices resulted in a significant number of fatalities that posed a risk to permitting and future operation, including 22 fatalities and 8 lost time accidents in 2022, 22 fatalities and 9 lost time accidents in 2023, and 2 fatalities and 1 lost time accident to end April 2024. Following legal action to remove Betterbrands, concluded in January 2024, the control of operations has now reverted back to RMC and contract artisanal miners are in the process of being removed from site. These issues pose a risk to permitting and future operation that will need to be effectively managed.
| 1.8 | QPs’ conclusions and recommendations |
| 1.8.1 | Mineral Resources |
Based on the information presented in this TRS, the QP’s key conclusions are as follows:
| — | The level of understanding in terms of regional geology, local geology and the nature and controls on mineralisation is high and provides a solid foundation for geological modelling, Mineral Resource estimation and mining geology. |
| — | Location of samples for surface and level-infill drilling are un-reliable due to errors with collar location and downhole survey. |
| — | Mineral Resource estimates are currently transitioning from paper-based estimates to digital estimates. |
| — | Mineral Resource estimates were completed on an unconstrained basis. |
| — | Estimates utilised all available samples i.e., channel, sludge, diamond drill core etc. |
| — | Dry bulk density (BD) of 2.7 tonnes per cubic metre (t/m3) assigned for all domains. |
| Project No PS213686 | WSP |
| Redwing Mine | January 2025 |
| S-K 1300 Technical Report Summary | Page 3 |
| Bulawayo Mining Company Limited |
| — | Validation of the Mineral Resource estimates has not been reported. Standard industry practice is to conduct both visual and statistical validation of estimates and present the findings of this work in the Mineral Resource report to give the reader an appreciation of the robustness of the estimates. |
| — | Estimation within modelled mineralisation domains (constrained estimate) would likely result in an increase in contained metal. |
| — | Gold price increase have not been reflected in the reporting Au Cut-off Grade (COG). A lower reporting cut-off grade may lead to an increase in contained metal. |
| — | The on-site assay laboratory is well-equipped and maintained and is considered suitable for the work that it is used for. |
| — | The drilling, sampling, assay and Quality Assurance and Quality Control (QAQC) techniques used for both exploration and resource definition are consistent with standard industry practice and are considered appropriate for the purposes of geological modelling and Mineral Resource estimation. More detailed information on core recovery is however required. |
| — | Data and database management requires further work. |
| — | The COG used for Mineral Resource estimation seem reasonable on face value, but the methodology used for determination of these values has not been reported and requires further explanation. |
| — | The method used for high-grade cutting is deemed appropriate and consistent with industry practice. |
| — | Mineral Resource estimates used a combination of paper-based estimation methods and digital estimation |
| — | The Mineral Resources Mineral Reserves (MRMR) technical report developed by RMC Zimbabwe covers a number of areas in sufficient detail, however; a number of areas require more detail to give the reader a more thorough understanding of the work that has been conducted, the results of the work and any inherent risks to the Mineral Resource estimate. |
| — | Mining, processing, and market modifying factors, study assumptions and parameters are used to establish RPEE for the reporting of Mineral Resources. No significant risks exist that could impact the reliability and/or confidence of Mineral Resources estimates. |
Based on the information presented in this TRS, the QP’s key recommendations are as follows:
| — | Data and database management is an area that requires further work. The RGM would benefit from the introduction of a corporate database, with inbuilt validation routines and reporting functionality, to assist with what is a large quantity of geological information. |
| — | Review lithology, structural and mineralisation modelling practices. |
| — | Data analysis is conducted; however, it is recommended that for future Mineral Resource estimates, deposit wide Exploratory Data Analysis (EDA) is undertaken prior to estimation, to ensure data is fit for purpose for geological modelling and Mineral Resource estimation. |
| — | It is recommended that a succinct geological modelling and Mineral Resource estimation process flow is developed and followed for future Mineral Resource estimates. |
| — | It is recommended that Mineral Resource estimation is constrained to modelled mineralisation domain wireframes, using an appropriate Au cut-off grade. |
| — | All paper-based estimation techniques should be converted to computer-based (digital) as soon as possible. |
| — | A comparison between BD values determined from underground grab samples, and drill core should be undertaken to ensure that the mean values used for Mineral Resource estimation are appropriate, and that bias is not being incorporated into the Mineral Resource estimate. |
| Project No PS213686 | WSP |
| Redwing Mine | January 2025 |
| S-K 1300 Technical Report Summary | Page 4 |
| Bulawayo Mining Company Limited |
| — | Validation of the Mineral Resource estimates produced, or at least the documentation of validation work undertaken is an area that requires further work. Standard industry practice is to conduct both visual and statistical validation of estimates and present the findings of this work in the Mineral Resource report, to give the reader an appreciation of the robustness of the estimates. |
| — | RPEE have been considered, and the parameters used are considered reasonable. |
| — | Review Mineral Resource classification methodology and block assignment. |
| — | The Mineral Resource report developed covers a number of areas in sufficient detail; however, some areas require more detail to give the reader a more thorough understanding of the work that has been conducted, the results of the work and any inherent risks to the Mineral Resource estimate. |
| — | Mineral Resource reconciliation practices should be reviewed, and a system implemented that provides a measure of Mineral Resource estimate performance. Planned versus actual resource tonnages and grades should be developed and updated each time a Mineral Resource estimate is completed. It is recommended that mined development and production be reconciled monthly, and stope close-out reports be developed for each completed stope. |
| — | A Mineral Resource update, according to industry best practice, should be completed prior to re-establishment of commercial production. |
| — | An underground drilling program, collared from footwall drives, aimed at increasing confidence in the existing resource should be undertaken. |
| — | Subsequent to future MRM updates, a stope optimisation exercise is recommended. Stope optimisation allows for the rapid development of valid stope shapes according to specified criteria. |
| 1.8.2 | Mineral Reserves |
Not applicable since this TRS is an Initial Assessment and no Mineral Reserves have been estimated.
For the historical 2018 Mineral Reserve estimate, the QP provides comment as follows:
| — | QP’s view is that the Mineral Reserve estimate represents a low level of conversion of the existing resource base as a function largely of those blocks that are readily accessible and meet the technical and economic constraints, such as pay limits for viable economic extraction. The QP notes that the relatively low inventory might have difficulty supporting both the capital and operating costs without the support from additional sources and that the average grades remaining are considerably higher than recent historical mining and processing performance at 2.7 g/t Au for 2016-2018. |
| — | It should be noted that a Mineral Reserve has not been estimated and reported since June 2018 as the RGM has been on C&M since 1 April 2019. Due to the positive change in gold price between 30 June 2018 (approx. US$1,250/oz) and 31 December 2023 (3-year trailing average US$1,848/oz), it is likely that a Mineral Reserve estimated at end December 2023 would be reported at a lower pay-limit, resulting in an increase in Mineral Reserve tonnages and therefore gold content. |
| — | The process of estimating the mineral reserve for RGM is well developed and relatively straight forward. |
| — | The Mineral Resource estimated for the RGM is significant and deserving of a long-term plan for increased exploitation and production ramp-up. This can be facilitated by improving the Mineral Reserve base estimate for mining. It should include consideration of process plant upgrade or replacement (improved throughput and recovery) and options for modernising the underground operation. Surface mining opportunities should also be examined. |
| — | The current methodology for estimation of Mineral Reserves appear to conform with standard African mining industry approaches but will benefit from clarification and upgrade of the approach. |
| Project No PS213686 | WSP |
| Redwing Mine | January 2025 |
| S-K 1300 Technical Report Summary | Page 5 |
| Bulawayo Mining Company Limited |
For the historical 2018 Mineral Reserve estimate, the QP provides comment as follows:
| — | The 2018 Mineral Reserve estimate will require update to reflect significant changes in gold price, operating costs and capital costs to support any future proposal to recommence mining operations. |
| — | The mine could consider amalgamating the separate models to assist with interpretation and processing. |
| — | WSP understands that wireframe surfaces are developed for the purpose of the Mineral Resource estimation and subsequently converted by spreadsheet calculation using modifying factors and pay limits to ascertain final reserve estimates. Industry recommended practice also includes preparation of development and stoping wireframes representing the material planned to be mined, inclusive of allowances for mining method, pillars and minimum mining widths. These wireframe solids can then be used to directly interrogate tonnage and grade from the block model by category and facilitate subsequent automated scheduling and animation using software such as Mine24D™ and Deswik™. RMC Zimbabwe could consider implementing this approach. |
| — | Consideration could also be given to application of pay limits, minimum mining width, BF and APF on a block-by-block basis commensurate with the technical and economic merits of each stoping block. |
| — | The QP recommends reviewing individual stope performance to test and vary the relatively nominal assumptions. This could include modelling of dilution skins and using block model grades. |
| — | Prepare a LOM design to support a detailed mining schedule. Consider using industry leading practice to generate 3D mine designs linked to physical quantity and cost schedules. |
| — | Identify access and requirements and estimate pay limits for each block. Annotate and exclude those blocks that are not accessible or economic. |
| — | Where possible, prioritise high value (Au grade) targets for escalated development and earlier production as this may have a significant impact on project returns. |
| — | Prepare a detailed narrative report to support the annual LOM plan. |
| — | Identify those areas where more mechanised long hole stope mining may be introduced to improve productivity and unit cost. A structured plan is required that explains how the proposed production rates will be achieved. This will require a pre-feasibility to feasibility study level of assessment. |
| — | Employee numbers averaging 872 at peak production appear nominal and will need to be adjusted to reflect the approach and mining method(s) adopted. |
| — | Estimates for development advance at the rate of 15.6 km per annum appear nominal rather than based on a clear and detailed plan. |
| — | Drill metres (jackhammer only) also appear to be nominal and underestimated if based on 1.33 t/m drilled. |
| — | Power outage (10% of hours) issues that plague the mine are assumed to be resolved after two years. A plan needs to be put in place that clearly identifies how this will be achieved. |
| Project No PS213686 | WSP |
| Redwing Mine | January 2025 |
| S-K 1300 Technical Report Summary | Page 6 |
| Bulawayo Mining Company Limited |
| 2 | Introduction |
| 2.1 | Registrant information |
This Technical Report Summary (TRS) is for the Bulawayo Mining Company Limited (BMC Limited) owned Redwing Gold Mine (RGM) [the Property], located in Manicaland Province in eastern Zimbabwe, and was prepared by the Qualified Persons (QPs) for BMC Limited.
BMC Limited is a private company incorporated in the United Kingdom (UK) and is a wholly owned subsidiary of Metallon Corporation Limited (UK) [Metallon]. KD Mining Company (UK) Limited (KDM) is a private company incorporated in the UK and is a wholly owned subsidiary BMC Limited.
Bulawayo Mining Company (Private) Limited Zimbabwe (BMC Zimbabwe), Mazowe Mining Company (Private) Limited Zimbabwe (RMC Zimbabwe), and Redwing Mining Company (Private) Limited Zimbabwe (RMC Zimbabwe) are responsible for the management of mineral assets located in Zimbabwe, the principal activities of which include exploration, development and operation of precious metals mineral assets.
RMC Zimbabwe is directly responsible for the day-to-day management of the mining operations and holds Mining Lease (ML) 34. The area covered by ML 34 has a surface area of 1,254 hectares (ha) [Figure 3.2] (BMC 2023a).
Figure 2.1 presents the corporate structure of BMC Limited.
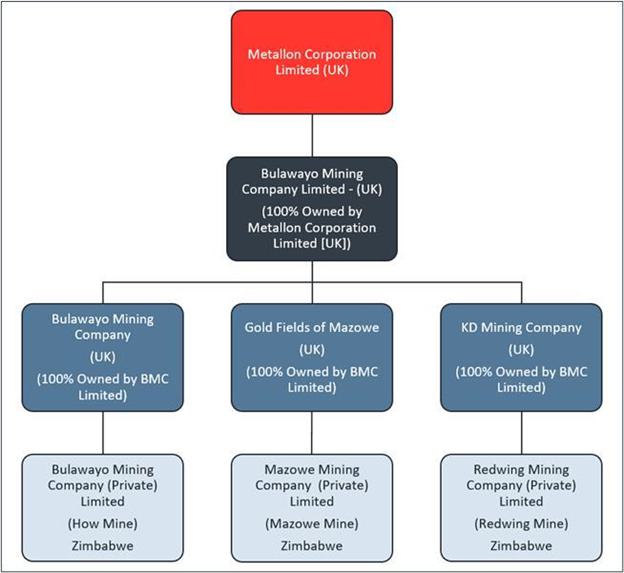
Figure 2.1 BMC Limited corporate structure
| Project No PS213686 | WSP |
| Redwing Mine | January 2025 |
| S-K 1300 Technical Report Summary | Page 7 |
| Bulawayo Mining Company Limited |
In October 2002, Metallon (herein referred to as BMC Limited) acquired a portfolio of mineral assets from a holding subsidiary of Lonmin plc (Lonmin), known as Independence Mining (Private) Limited.
This portfolio of mineral assets located in Zimbabwe consists of three mining properties located within a significant land package consisting of some 66.02 square kilometres (km2) in area. The mining properties comprise three separate underground gold mines, namely: How, Mazowe, and Redwing. Each mining property is serviced by its own dedicated processing facilities and accompanying infrastructure. BMC Limited considers there to be significant exploration potential at each of the mining properties.
From acquisition of the assets in 2002 until 2006, gold production steadily increased with gold production peaking in 2005 at approximately 156,000 ounces (oz) of gold, making BMC Limited Zimbabwe’s largest gold producer.
Due to political unrest and hyperinflation in 2007, BMC Limited’s mining activities in Zimbabwe ceased and all mines were placed on Care and Maintenance (C&M). In 2009, mining activities recommenced, with many of the mines requiring rehabilitation work.
Operations were suspended at the Mazowe Gold Mine (MGM) on 31 December 2018, and at the RGM on 30 March 2019 due to general economic challenges. Both mines were placed on a Supreme Court ordered Corporate Rescue, with the MGM commencing 20 February 2020, and the RGM commencing 23 July 2020. Both Corporate Rescue proceedings were nullified on 7 October 2021 for the MGM, and 5 September 2022 for the RGM.
During the Corporate Rescue period, Betterbrands Mining Company (Pvt) Ltd (BBM) was engaged as a tributor to mine on Mining Lease (ML) 34 (Virimai 2022). On 8 March 2024, the non-standard tribute agreement with BBM was cancelled, and BBM was evicted from the RGM.
In January 2024, 15 artisanal miners were trapped for a period of three days at the RGM.
Gold production from RGM since 2018 is as follows (RMC Operation Reports):
| — | 2018: 6,787 oz. |
| — | 2019: 214 oz. |
| — | 2020: 1,348 oz. |
| — | 2021: 1,391 oz. |
| — | 2022: 2,237 oz. |
| — | 2023: 2,741 oz. |
BMC Limited’s forward strategy is to produce 300,000 oz of gold per annum through expansion across all mines, and through a broader acquisition strategy across Africa.
BMC Limited is pursuing a focused expansion strategy throughout Africa, with the aim of securing prospective green minerals assets in Zimbabwe, and the Democratic Republic of Congo (DRC).
| 2.2 | Terms of reference and purpose |
The purpose of this TRS is to report Mineral Resources, and Mineral Reserves for the Property effective as of 31 December 2023. The TRS utilises:
| — | Australian English spelling. |
| — | Metric units of measure. |
| — | Grades presented in grams per tonne (g/t). |
| — | Co-ordinate system presented in metric units using Cape/Lo29. |
| — | United States Dollars (USD). |
| Project No PS213686 | WSP |
| Redwing Mine | January 2025 |
| S-K 1300 Technical Report Summary | Page 8 |
| Bulawayo Mining Company Limited |
Summary Mineral Resources in Table 1.1 and Table 1.2 are presented based on a BMC Limited equity ownership basis (100%). No current Mineral Reserves as at 31 December 2023 have been estimated.
Key acronyms and definitions used in this TRS include those items listed in Table 2.1.
Table 2.1 List of acronyms and abbreviations used in this TRS
| Acronym/abbreviation | Description | |
| AAS | Atomic Absorption Spectroscopy | |
| amsl | Above mean sea level | |
| APF | Assay plan factor | |
| ASCII | American Standard Code for Information Interchange | |
| Au | Gold | |
| BBM | Betterbrands Mining Company (Pvt) Ltd | |
| ⁰C | Degrees Celsius | |
| BCF | Block Call Factor | |
| BD | Bulk Density | |
| BIF | Banded Iron Formation | |
| BF | Block Factor | |
| BMC Limited | Bulawayo Mining Company Limited | |
| BSV | Bernheim-Storis-Vesuvius | |
| CIP | Carbon in Pulp | |
| cm | Centimetres | |
| C&M | Care and Maintenance | |
| COG | Cut Off Grade | |
| CRM | Certified Reference Material | |
| CV | Coefficient of Variation | |
| DRC | Democratic Republic of Congo | |
| EIA | Environmental Impact Assessment | |
| EMP | Environmental Management Plan | |
| ER | Extraction Ratio | |
| g/cm3 | Grams per cubic centimetre | |
| g/t | Grams per tonne | |
| ha | Hectares | |
| ID2 | Inverse squared distance | |
| k | Thousand | |
| kg | Kilograms | |
| KDM | KD Mining Company (UK) Limited | |
| km | Kilometres | |
| km2 | Square kilometres | |
| koz | Thousand ounces | |
| kt | Thousand tonnes | |
| ktpa | Thousand tonnes per annum |
| Project No PS213686 | WSP |
| Redwing Mine | January 2025 |
| S-K 1300 Technical Report Summary | Page 9 |
| Bulawayo Mining Company Limited |
| Acronym/abbreviation | Description | |
| ktpm | Thousand tonnes per month | |
| kV | Kilovolts | |
| l/s | Litres per second | |
| LDV | Low Density Villages | |
| LOM | Life of Mine | |
| m3 | Cubic metre | |
| Ma | Million years | |
| MAR | Mean Annual Run-off | |
| MCF | Mine Call Factor | |
| MGB | Mutare Greenstone Belt | |
| MGM | Mazowe Gold Mine | |
| ML | Mining Lease | |
| mm | millimetres | |
| Moz | Million ounces | |
| MRMR | Mineral Resources Mineral Reserves | |
| MSZ | Mineralised Shear Zones | |
| Mt | Million tonnes (metric) | |
| Mtpa | Million tonnes per annum | |
| MVA | Megavolt-ampere | |
| OK | Ordinary Kriging | |
| oz | Ounces | |
| QP | Qualified Person | |
| RGM | Redwing Gold Mine | |
| RMC Zimbabwe | Redwing Mining Company (Private) Limited | |
| RPEE | Reasonable Prospects for Economic Extraction | |
| RTGS | Real time gross settlement | |
| SAMREC | South African Mineral Resource Committee | |
| SD | Standard Deviation | |
| SRK | SRK consulting (UK) Ltd | |
| SRKSA | SRK Consulting (South Africa) (Pty) Ltd | |
| t | Tonnes | |
| t/m | Tonnes per metre | |
| t/m3 | Tonnes per cubic metre | |
| TBL | Terminal Benefits Liability | |
| TRS | Technical Report Summary | |
| TSF | Tailings Storage Facility | |
| μm | Micrometre | |
| USD | United States Dollar | |
| V | Volts | |
| WSP | WSP Australia Pty Limited | |
| Wt.% | Weight percent | |
| ZETDC | Zimbabwe Electricity Transmission and Distribution Company | |
| ZiG | Zimbabwe gold currency |
| Project No PS213686 | WSP |
| Redwing Mine | January 2025 |
| S-K 1300 Technical Report Summary | Page 10 |
| Bulawayo Mining Company Limited |
| 2.3 | Sources of information |
This TRS relies upon various reports and other material prepared by BMC Limited, and BMC Limited’s staff and consultants as provided to WSP. This data and information have been supplemented with information in the public domain, and through information gathered during a site inspection by WSP in May 2024 (Section 2.4).
While WSP has reviewed the data and other information contained in the reports and other material provided to it and is not aware of any reason to doubt that such data and information is complete and accurate, excluding Golder (2021), WSP was not responsible for the preparation of those reports and other material.
WSP has taken reasonable care to ensure that the information contained in this TRS is in accordance with the facts and information available to it and is unaware of any omission likely to affect its import. In this regard, the attention of any reader of the TRS is specifically directed to Section 24, and Appendix A.
| 2.4 | Personal inspection |
Information in this TRS has been prepared under the supervision of the following QPs:
| — | Aaron Radonich, Fellow of the Australasian Institute of Mining and Metallurgy (FAusIMM, Member Number 221172), Principal Geologist, WSP. Aaron is responsible for RGM Mineral Resources. The date of the last personal inspection was May 2024. |
| — | Allan Blair, Member of the Australasian Institute of Mining and Metallurgy (FAusIMM, Member Number 102240), Principal Mining Engineer, WSP. Allan is responsible for RGM Mineral Reserves. The date of the last personal inspection was May 2024. |
Table 2.2 presents a tabulation of the QPs, their personal inspections, and their areas of responsibility.
| Table 2.2 | List of QPs |
| QP | Qualifications/Affiliation | Date of Personal Inspection | Areas of Responsibility | |||
| Aaron Radonich | Fellow AusIMM, PGCert Geostatistics, BSc (Hons.), BSc | May 2024 | Sections 1.1, 1.2, 1.3, 1.4, 1.7, 1.8.1, 2, 3, 4, 5, 6, 7, 8, 9.1, 11, 20, 21, 22,1, 23.1, 24 and 25. | |||
| Allan Blair | FAusIMM, MBA, BSc, BAppSc Mining Engineering | May 2024 | Sections 1.5, 1.6, 1.8.2, 5, 9.2, 9.3, 9.4, 9.5, 10, 12, 13, 14, 15, 16, 17, 18, 19, 22.2 and 23.2. |
| 2.5 | Previously filed Technical Report Summaries |
This is the first TRS filed for the Property and therefore does not update a previously filed TRS.
| 2.6 | WSP declaration |
The opinions of QPs in the employ of WSP contained herein and effective 31 December 2023, are based on information collected throughout the course of investigations by the QPs. The information in turn reflects various technical and economic conditions at the time of preparing the TRS. Given the nature of the mining business, these conditions can change significantly over relatively short periods of time. Consequently, actual results may be significantly more or less favourable.
This TRS may include technical information that requires subsequent calculations to derive sub-totals, totals, and weighted averages. Such calculations inherently involve a degree of rounding, and consequently introduce a margin of error. Where these occur, the QPs do not consider them to be material.
Neither WSP, nor the QPs responsible for this TRS, are insiders, associates, or affiliates of BMC Limited or any of its subsidiaries. The results of the technical review by the QPs are not dependent on any prior agreements concerning the conclusions to be reached, nor are there any undisclosed understandings concerning any future business dealings.
| Project No PS213686 | WSP |
| Redwing Mine | January 2025 |
| S-K 1300 Technical Report Summary | Page 11 |
| Bulawayo Mining Company Limited |
| 3 | Property description |
| 3.1 | Property location |
The RGM is located in Penhalonga, some 20 km north-northeast of the City of Mutare (latitude 18°52’S and longitude 32°41’E), Manicaland Province, in the Mutare Mining District of Zimbabwe (Figure 3.1).
The RGM is located approximately 265 km southeast of the capital city of Harare.
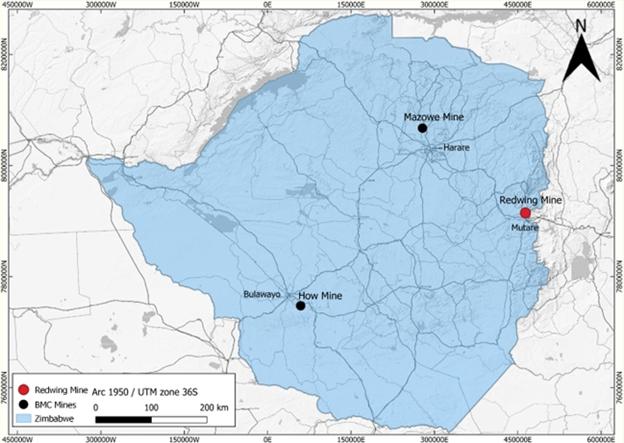
Figure 3.1 Property location map
| 3.2 | Title and mineral rights |
RMC Zimbabwe holds ML 34. The area covered by the ML was surveyed in 2015 as having a surface area of 1,254 hectares (ha). Cases of illegal gold mining activities have been reported in some sections of the ML, including along the Mutare River (KDM 2018).
| Project No PS213686 | WSP |
| Redwing Mine | January 2025 |
| S-K 1300 Technical Report Summary | Page 12 |
| Bulawayo Mining Company Limited |
Figure 3.2 presents the ML 34 boundary.
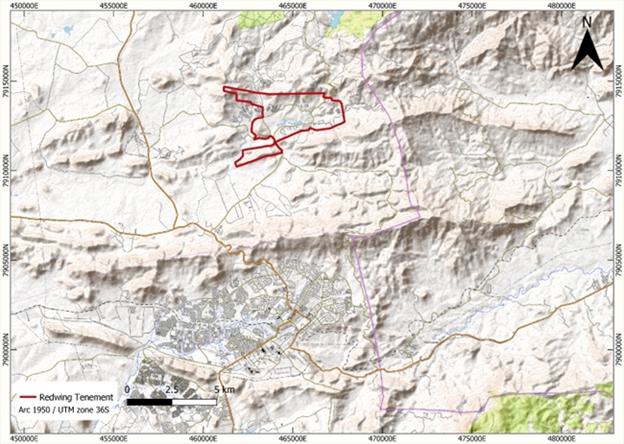
Figure 3.2 RGM ML 34 boundary
While WSP has referred to tenement holdings in this TRS, such reference is for convenience only and may not be complete or accurate. WSP is not expert in tenement management and the reader should not rely on information in this TRS relating to the current ownership and legal standing of the tenements or any encumbrances impacting on those tenements. This TRS assumes that all tenements and tenement applications are in good standing and free of all encumbrances other than those set out in this TRS.
| 3.3 | Encumbrances |
There are no known significant encumbrances to the Property that would impact the current Mineral Resources or Mineral Reserves. Risks to access, title or right to perform work.
| 3.4 | Risks to access, title, or right to perform work |
Access to the mine site and to the ore is authorised by the applicable mining legislation, and RMC Zimbabwe’s title and mining rights (Section 3.2). Mining exploration and exploitation works conducted or to be conducted on site are authorised in accordance with the applicable legislation, and RMC Zimbabwe’s title and mining rights (Section 3.2). Other required permits and authorisations (e.g., environmental, building, etc.) are applied for by RMC Zimbabwe in accordance with the applicable legislation.
| Project No PS213686 | WSP |
| Redwing Mine | January 2025 |
| S-K 1300 Technical Report Summary | Page 13 |
| Bulawayo Mining Company Limited |
| 3.5 | Agreements and royalties |
In 2022, the government of Zimbabwe has promulgated new regulations through Statutory Instrument 189 of 2022 to the effect that mineral royalties are to be paid partly in kind and partly in monetary form. The mineral royalties are collected from minerals specified in terms of section 49(1)(c1) of the Reserve Bank of Zimbabwe Act [Chapter 11:15] deemed to be components of the reserves maintained by the Reserve Bank of Zimbabwe. Minerals include but are not limited to gold, diamonds, platinum group metals, and lithium. These regulations have also caused timeous amendments to the Finance Act and the Reserve Bank of Zimbabwe Act to ensure the cooperation in application of legislation (BMC 2023)
In 2024, the monetary component was revised. Royalties remitted to the Zimbabwe Revenue Authority in respect of gold and those minerals specified are paid based on 50% in kind and 50% in monetary form. With regards the “in kind component”, miners submit actual minerals they would have extracted. The 50% monetary component would be paid as follows:
| — | 37.5% in the Zimbabwe Gold (ZiG) currency. |
| — | 12.5% in foreign currency (RBZ 2024). |
Prior to the promulgation of these regulations, royalties were paid only in monetary form.
A US$21 per kilogram (/kg) realisation fee is also charged for gold lodged with Fidelity Printers and Refiners (BMC 2023).
| Project No PS213686 | WSP |
| Redwing Mine | January 2025 |
| S-K 1300 Technical Report Summary | Page 14 |
| Bulawayo Mining Company Limited |
| 4 | Accessibility, climate, local resources, infrastructure, and physiography |
| 4.1 | Topography, elevation, and vegetation |
The RGM sits at an altitude of approximately 1,200 m above mean sea level (amsl). The RGM is situated close to the Mutare River which flows south-westerly into the Odzi River, and provides a source of potable water, as well as being considered the primary recharge source of the underground water system, which serves as the key water source for the RGM processing facilities (SRK 2012).
The vegetation type in the area shows a strong lithological influence, where Brachsygeia Species (masas and mpfuit) cover the majority of the greenstone belt, while Uapaca Kirkiana (sugar plum) is dominant on the granites. Hyparrhenia is the dominant grass species (SRK 2012).
Climatic conditions in the area ensure a perennial flow of these two major rivers and their associated tributaries (KDM 2018).
| 4.2 | Access |
The RGM is linked to major commercial centres by a well-established network of primary asphalt roads and is accessible from the surrounding communities through secondary gravel roads (KDM 2018).
Penhalonga has a population of approximately 8,000 and Harare has a population of approximately 1.5 million.
| 4.3 | Proximity to population centres |
The RGM is located in Penhalonga, some 20 km north-northeast of the City of Mutare (latitude 18°52’S and longitude 32°41’E), Manicaland Province, in the Mutare Mining District of Zimbabwe. The RGM is located some 265 km southeast Harare. The mine is linked to major commercial centres by a well-established network of primary asphalt roads and is accessible from the surrounding communities through secondary gravel roads.
Harare is serviced by Robert Gabriel Mugabe (RGM) International Airport, operated by the Airport Company of Zimbabwe (Private) Limited (ACZ), which has the capacity to handle 2.5 million passengers per annum (ACZ 2024). The National Railways of Zimbabwe (NRZ) provides both freight services (NRZ 2024a), and passenger services (NRZ 2024b).
| 4.4 | Climate |
The RGM operates continuously throughout the year, with no interruptions dues to seasonal changes.
The RGM lies in natural farming region I, of Zimbabwe’s Agro-ecological farming regions. The RGM is situated on the high veldt in the eastern highlands of Zimbabwe. Winters are generally cold with mild summers. Rainfall is distinctly higher than the rest of the country which under normal climatic conditions is evenly distributed around the year. Despite its tropical location, the city has a temperate climate. The average annual temperature is 19°C. The coldest month is July (minimum 6°C and maximum 20°C) and the hottest month is October (minimum 16°C and maximum 32°C). The annual rainfall is 818 mm.
Rain falls mostly in the months December to February although heavy showers are possible before and after this period. The wettest month on record was January 1926 which received 580 mm while January 1991 received only 24 mm. Average rainfall received over the past 5 years is 1,000 mm (MGZ 2019).
| Project No PS213686 | WSP |
| Redwing Mine | January 2025 |
| S-K 1300 Technical Report Summary | Page 15 |
| Bulawayo Mining Company Limited |
Figure 4.1 presents climate statistics for Penhalonga, Zimbabwe.
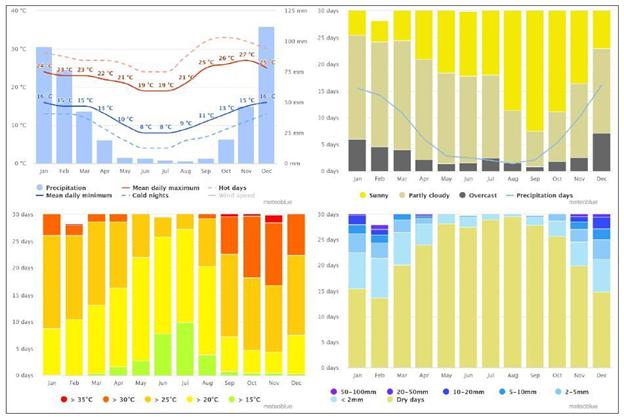
| Figure 4.1 | Climate statistics for Penhalonga, Zimbabwe (Meteoblue, 2024) |
| 4.5 | Local resources and existing infrastructure |
| 4.5.1 | Power supply |
Power is supplied to RGM by a 33 kilovolts (kV) supply from the power utility company, Zimbabwe Electricity Transmission and Distribution Company (ZETDC). The installed capacities of the mine substations are as follows (BMC Limited):
| — | Redwing: | 7.5 Megavolt-ampere (MVA). |
| — | Old West: | 1 MVA. |
| — | Rezende: | 2 MVA. |
| 4.5.2 | Water supply |
Domestic water is diverted from the Mutare River and is transported by gravity through a concreted trench to a sump, where it is pumped to the RGM water treatment plant. The RGM water treatment plant consists of two 212 cubic metres (m3) tanks (4 and 5) for settling sludge by addition of aluminium sulphate. Water then passes through three 19 m3 sand filter tanks before flowing into the 212 m3 fresh water holding tank (9), where it is chlorinated prior to distribution. Tanks 1, 2, and 3 are used for temporary water treatment during cleaning or maintenance of tanks 4, 5, and 9 (Golder 2021).
A 6-inch take-off line runs to Old West, from which a 4-inch branch feeds the RGM village and other take-offs feed the clinic, workshops, administration offices, compressors and the Low Density Village houses (Golder 2021).
A separate 4-inch line runs to feed the Liverpool High Density Village, before it proceeds as a 3-inch line to feed the Rezende houses. The total volume of water processed is 95 m3/hour (Golder 2021).
| Project No PS213686 | WSP |
| Redwing Mine | January 2025 |
| S-K 1300 Technical Report Summary | Page 16 |
| Bulawayo Mining Company Limited |
| 4.5.3 | Personnel |
General labour force is available within the surrounding communities. For specialised skills, advertisements are advertised in the public press and will usually be sourced from any part of the country.
| 4.5.4 | Suppliers |
Consumables and spares are sourced locally with a few exceptional cases where some are imported, especially from South Africa.
| 5 | History |
| 5.1 | Exploration and ownership history |
Various portions of the present day RGM property are part of the shallow historical workings that exploited the numerous mineralised shear zones (MSZ) located above the water table. In 1889, Baron de Rezende and James Henry Jeffreys pegged the Rezende Mineralised Shear Zone (the Rezende Mine) and began mining operations. In 1909, Rezende Mines Ltd. (Rezende) was formed to operate the mine and other deposits in close vicinity. Operations continued until 1954, when Rezende Mine closed. There was little activity until 1955, when the Rezende Mine was acquired by Independence Gold Mining (Pvt) Ltd. (Independence). Independence was subsequently acquired by Lonrho Zimbabwe (Pvt) Ltd. (Lonrho) in 1980 (KDM 2018).
The Old West Mine was initially pegged in 1899; however, mining did not commence until 1909, before ceasing operations in 1950. The nearby RGM was worked down to the water table between 1904 and 1905, before ceasing operations in 1909. Rezende acquired the claims covering the RGM in 1909, sunk a shaft and resumed mining operations, which again ceased in 1919. In 1968, Mutare Exploration Co. Ltd. (Mutare) acquired both the RGM and Old West properties and initiated a diamond drilling campaign to cover the Felsite ore body. Between 1975 and 1978, Independence acquired the properties prior to a takeover by Lonrho in 1980 (KDM 2018).
An exploration drilling campaign targeting mostly the Felsite mineralisation was conducted in close proximity to the RGM in the early 1980’s. The drilling covered an approximate area of 9 km2 (6 km by 1.5 km), and a total of 22,883 m of drilling was completed. The drill holes were on a widely spaced irregular grid. The area north of the RGM that was also covered by this exploration drilling is a target for future in-fill drilling aimed at increasing resource confidence.
Lonmin plc (Lonrho) relinquished ownership of Independence to Metallon Resources of South Africa in October 2002. Independence then changed the name to Metallon Gold Zimbabwe (Pvt) Ltd in September 2004 (KDM 2018).
In 2008, the RGM was flooded. The causes of flooding were attributed to a shortage of foreign currency, emanating from the 2007/2008 economic meltdown, prolonged power outages and ZESA’s inability to supply adequate power to the region. The situation was worsened by aged pumps that were due for replacement. Consequently, in September 2008, the mine suspended operations as working areas and other critical equipment were submerged. The mine subsequently acquired five submersible pumps in the first quarter of 2010, each pumping an average of 140 cubic metres per hour (m3/hour). Two pumps were installed in the Rezende Shaft, two in the Redwing Main Shaft and one in the Old West Shaft. The pumps were commissioned in March 2010 (KDM 2018).
The RGM resumed operations in September 2009, with re-treatment of tailings (sands) dumps i.e., the Duiker and Concentrate Dumps. This re-treatment ceased on 25 September 2013, mainly due to depressed feed grades that rendered re-processing of sands uneconomic (KDM 2018).
Having pumped water to below 6 Level, the RGM resumed underground mining by instituting development on 4 Level on 21 February 2015. This was in preparation of production of gold from underground, that eventually commenced in November 2015 (KDM 2018).
Following an organisational re-structuring process, which became effective from 1 June 2016, the Redwing Mine now falls under The King’s Daughter Mining Company (Private) Limited (KDM), a wholly owned subsidiary of Metallon (KDM 2018).
Access for men and materials to and from the underground workings is through the South Winze Shaft to 6 Level and rock hoisting to surface is via the Redwing Main Shaft. The Rezende Shaft to the east is used for de-watering while to the west of the RGM, the Old West No. 1 and 2 shafts are not used (KDM 2018).
The RGM was placed on C&M on 1 April 2019.
A Supreme Court ordered Corporate Rescue was implemented on 23 July 2020. During the Corporate Rescue period, BBM was engaged as a tributor to mine on ML 34 (Virimai 2022).
| Project No PS213686 | WSP |
| Redwing Mine | January 2025 |
| S-K 1300 Technical Report Summary | Page 17 |
| Bulawayo Mining Company Limited |
Mine dewatering was maintained until suspended on 23 December 2020, due to power supply disconnections. The water level has since risen to 47.3 m from the Redwing Shaft surface collar (or 71.1 m above 4 Level) and has been stagnant at that level since 19 April 2021. Any recommencement of mining operations will require dewatering to access Mineral Resources and Mineral Reserves.
The Corporate Rescue proceedings were nullified on 5 September 2022.
In January 2024, 15 artisanal miners were trapped for three days at the RGM.
On 8 March 2024 the non-standard tribute agreement with BBM was cancelled, and BBM was evicted from ML 34.
| 5.2 | Production history |
Total gold produced from the RGM between 1981 and 2023 is approximately 0.65 million ounces (Moz). Figure 5.1 presents total gold production from the RGM for the period 1981-2023.
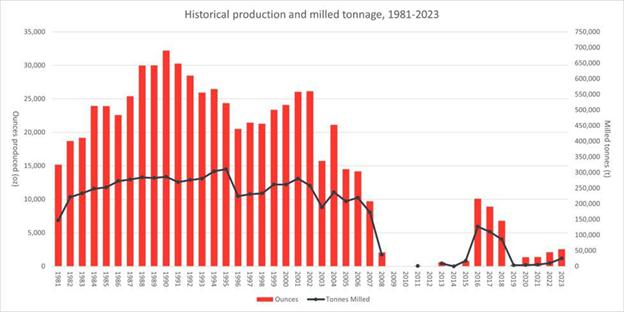
| Figure 5.1 | RGM total gold production 1981–2023 |
| Project No PS213686 | WSP |
| Redwing Mine | January 2025 |
| S-K 1300 Technical Report Summary | Page 18 |
| Bulawayo Mining Company Limited |
| 5.3 | Production reconciliation |
The Property’s Mineral Resources as of the end of the last fiscal year 2023 compared to the 2022 fiscal year are compared in Table 5.1. While there has been minor adjustment of COG between 2022 and 2023 there was no change between the Mineral Resources for 2022 and 2023. There has been no statement of Mineral Reserves for 2022 and 2023 and therefore no requirement for comparison.
| Table 5.1 | Mineral Resource summary comparison end December 2022 to end December 2023 |
| 31 December 2022 | 31 December 2023 | Var. (%) | ||||||||||||||||||||||||||
| Category | Tonnes
(kt) | Grade (Au g/t) | Au
(koz) | Tonnes
(kt) | Grade (Au g/t) | Au
(koz) | Au (koz) | |||||||||||||||||||||
| Total Mineral Resources | ||||||||||||||||||||||||||||
| Measured Mineral Resources | 1,450 | 2.92 | 136 | 1,450 | 2.92 | 136 | 0 | % | ||||||||||||||||||||
| Indicated Mineral Resources | 8,200 | 3.99 | 1,052 | 8,200 | 3.99 | 1,052 | 0 | % | ||||||||||||||||||||
| Total M+I Mineral Resources | 9,650 | 3.83 | 1,188 | 9,650 | 3.83 | 1,188 | 0 | % | ||||||||||||||||||||
| Inferred Mineral Resources | 15,830 | 2.61 | 1,328 | 15,830 | 2.61 | 1,328 | 0 | % | ||||||||||||||||||||
| Total Mineral Resources | 25,480 | 3.07 | 2,515 | 25,480 | 3.07 | 2,515 | 0 | % | ||||||||||||||||||||
Notes: Numbers are rounded.
| 5.4 | Aggregate fiscal year production |
Since the mine has been on C&M since April 2019, there has been no material production from Mineral Resources over the past 3 years.
| 5.5 | Exploration and development by previous owners or operators |
Previous exploration and development is discussed in Section 5.1.
| 5.6 | Liabilities |
Inspection of the Financial Statements for the year ended 31 December 2022 indicates RMC carries substantial liabilities that total US$8.88 M comprising:
| — | Non-Current Liability for an “Environmental rehabilitation provision” for US$3.007 M |
| — | Current Liability for “Trade and other payables” for US$5.873 M. |
Inspection RMC records of current assets and current liabilities as at end February 2024 reveals:
| — | Current Assets comprising “Other Debtors” for US$2.452 M |
| — | Current Liabilities of US$7.214 M comprising “Trade Creditors” US$1.939 M, “Statutory Payments” US$2.211 M and “Other” US$3.064 M. |
| Project No PS213686 | WSP |
| Redwing Mine | January 2025 |
| S-K 1300 Technical Report Summary | Page 19 |
| Bulawayo Mining Company Limited |
| 6 | Geological setting, mineralisation, and deposit |
| 6.1 | Regional geology |
| 6.1.1 | Mozambique Greenstone Belt |
The RGM is located within the Mutare Greenstone Belt (MGB) extends from the Mozambique Belt in the east, into the granites and gneisses of the Zimbabwe Craton in the west. It forms a tapering triangular shape from approximately 20 km in the east to less than 3 km in the west. The grade of metamorphism increases with the degree of structural deformation, from greenschist facies in the east to amphibolite facies in the southwest. The geology is dominated by an east-west trending series of metavolcanics consisting of olivine cumulates, komatiites, komatiitic basalts, and high iron tholeiites. The rocks are extrusive, indicated by the presence of spinifex texture and pillow lavas as well as lenses of intercalated clastic sediments and discontinuous strings of banded iron formations (BIF) (KDM 2018).
The Penhalonga tonalities, syntectonic granodiorites, trondhjemites and tonalities (now gneisses), microgranites (sheets and dykes), potassium-rich granites (ca. 2,600 Ma), dolerite dykes and sills have all intruded the greenstone supracrustals. The Penhalonga tonalities (ca. 2,741 ± 3 Ma) are the oldest intrusions and therefore provide a good estimate of the age of the MGB (KDM 2018).
Figure 6.1 presents a simplified regional geology map of Zimbabwe and the locations of major greenstone belts. The MGB can be seen in the middle right.
| 6.1.2 | Granitoids |
The MGB is bounded by the Penhalonga Diorite to the north and south.
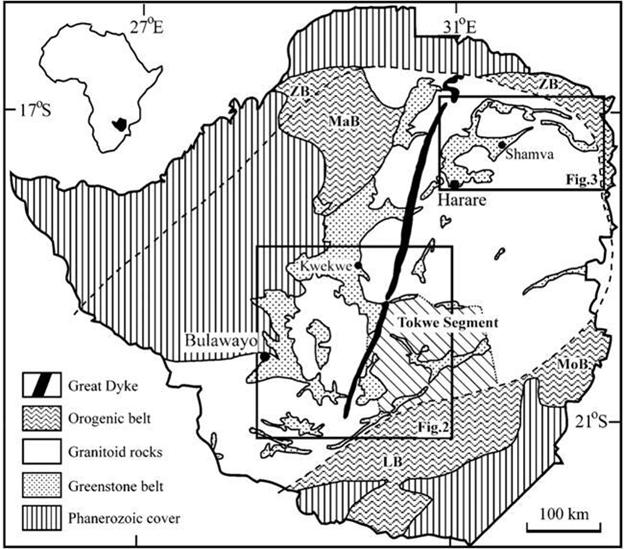
| Figure 6.1 | Regional geology of Zimbabwe showing locations of greenstone belts (Prendergast 2004) |
| Project No PS213686 | WSP |
| Redwing Mine | January 2025 |
| S-K 1300 Technical Report Summary | Page 20 |
| Bulawayo Mining Company Limited |
| 6.2 | Structural setting |
The MGB has undergone at least four deformation events, as described in Table 6.1 (KDM 2018).
| Table 6.1 | Structural deformation events |
| Deformation Event | Description | |
| D1 | SSE-NNW regional compression, resulting in folding of the MGB into a series of at least two east-west striking synclinoria, separated by a tight antiform. Regional shearing and cleavage formation, striking east-west accompanied this folding. | |
| D2 | Faulting transecting all rock types characterised by NNE-SSW faults parallel to the Great Dyke and conjugate NW-SE faulting. | |
| D3 | ENE-WSW striking faults displacing both the D1 and D2 structures in a sinistral sense. | |
| D4 | Locally developed E-W striking fault system, exposed underground at the RGM where Faults displace mineralised structures. |
Known gold deposits occur in all lithologies apart from the younger potassium-rich granites. More than 80% of known mineralisation is hosted by east-west trending structural elements, sub-parallel to the regional strike. These dip on average at 60° to the north or south. The east-west striking deposits show a clear spatial relationship to those structures formed during the D1 deformation event. These deposits are located in subsidiary or second-order structures that commonly splay off or are associated with the regional D1 shears. The Champion Mine is a typical example. Other deposits, including the Rezende dip steeply either to the northeast or southwest and are hosted in D2 structures (NW-striking faults) [KDM 2018].
| 6.3 | Local and property geology |
| 6.3.1 | Felsite |
The Felsite consists of a tabular micro-granitic body, which intruded the Penhalonga diorite. It is a robust orebody, constituting the main mineralisation style at the RGM. It strikes east-west and dips at a locally variable but shallow angle of approximately 35° to the south. At its widest, the orebody attains a thickness of approximately 7 m. It has been worked on a strike length of more than 2,500 m. The Felsite lies in the core of the Penhalonga synform and it is the folding of this micro-granitic sheet within the diorite that is believed to be responsible for the localisation of gold mineralisation (KDM 2018).
Two phases of deformation are recognisable in the Felsite, and these are believed to be responsible for the development of three cleavage plane generations within the orebody. These cleavage plane generations consist of the following (KDM 2018):
| — | Shallow dipping, northeast trending, un-mineralised cleavage planes, which lack quartz infill. |
| — | East-southeast dipping, quartz-filled, mineralised planes with variable inclinations. The shallow dipping (approximately 25°) cleavage planes are mineralised but lack quartz infill. These generally displace the steeply dipping cleavage planes. The steep dipping (+25°) planes are predominantly quartz filled. |
| — | The contact between the diorite and the Felsite is locally sheared and mineralised. This shearing, either from the contact or in most cases from the fold hinges, continues into the diorite as a single dilational quartz filled plane, shallowly dipping, predominantly towards the east-northeast. |
Superimposed on the first folding event of the Felsite, is a second folding event with an axis appearing to plunge steeply towards the north. This has resulted in a fold interference believed to have produced the apparent dome and basin configuration that is evident, particularly on the upper levels of the RGM (KDM 2018).
| 6.3.2 | MSZ |
There are several sub-parallel shears that cut across both the Penhalonga diorite and Felsite. These shears are southeast striking deformation zones, which have a variable but steep dip, ranging between 45° and 75° to the north-northeast. These shears include the Rezende, Village North and Kent reefs. Elongated lineations in the Rezende mineralised shear zone are oriented west-northwest and east-southeast, suggesting both dextral and sinistral senses of movement (KDM 2018).
The MSZ host grey to white, fine-grained quartz veins and veinlets. These are characterised by a distinct crack-seal, banded or ribboned appearance, with anastomosing slivers of altered country rock. Associated sulphide mineralisation includes pyrite, galena, chalcopyrite, accessory arsenopyrite, and occasional native gold. The Rezende mineralised shear zone averages 2.5 m in thickness, with a strike extent of approximately 1,400 m and 800 m up and down-dip. The Village North and Kent MSZ have widely variable thickness, ranging from several cm to more than 6 m in places (KDM 2018).
| Project No PS213686 | WSP |
| Redwing Mine | January 2025 |
| S-K 1300 Technical Report Summary | Page 21 |
| Bulawayo Mining Company Limited |
| 6.4 | Deposit type and geology |
Mineralisation at RGM may be described as a lithological and structurally controlled/shear hosted gold deposit, hosted predominantly within the Felsite and MSZ.
| 6.5 | Mineralisation |
There is strong structural and lithological control on gold mineralisation at the RGM. The sulphide and gold mineralisation in the Felsite orebody is bound within the structurally deformed micro-granitic body, with few transgressive shear or vein extensions into the host diorite. To date, no significant mineralisation has been delineated within the diorite. While no specific metallogenetic studies have been completed, the prevalence of galena in the Felsite orebody reduce with depth. This also appears to be the case with gold (KDM 2018).
Mineralisation within the MSZ (narrow reefs) is distinctly limited to physical deformation that has allowed the migration of hydrothermal fluids resulting in the deposition of quartz, sulphides and gold. While comparatively high gold values are associated with grey quartz and pyrite impregnation, zones of sheared and propylitised diorite commonly form part of contiguous reef structure (KDM 2018).
Figure 6.2 presents a schematic section of the RGM MSZ (quartz reefs) in relation to the Felsite orebody.
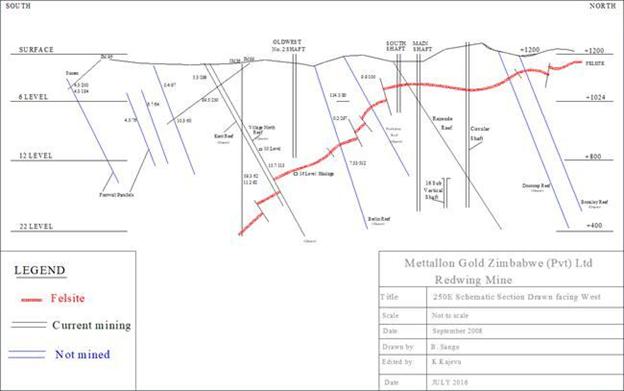
| Figure 6.2 | RGM MSZ schematic section |
| Project No PS213686 | WSP |
| Redwing Mine | January 2025 |
| S-K 1300 Technical Report Summary | Page 22 |
| Bulawayo Mining Company Limited |
The local geology of the Penhalonga Valley is presented in Figure 6.3.
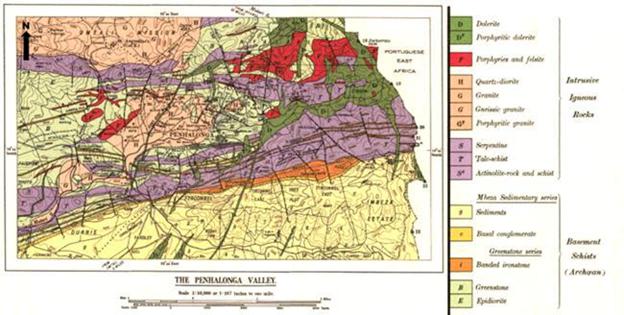
| Figure 6.3 | Penhalonga Valley local geology |
| Figure 6.4 | present the surface geology of the RGM. |
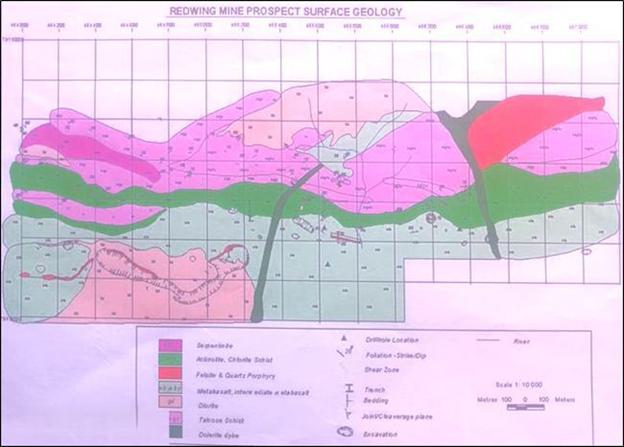
| Figure 6.4 | RGM surface geology |
| Project No PS213686 | WSP |
| Redwing Mine | January 2025 |
| S-K 1300 Technical Report Summary | Page 23 |
| Bulawayo Mining Company Limited |
| Figure 6.5 | presents the local stratigraphy of the RGM area. |
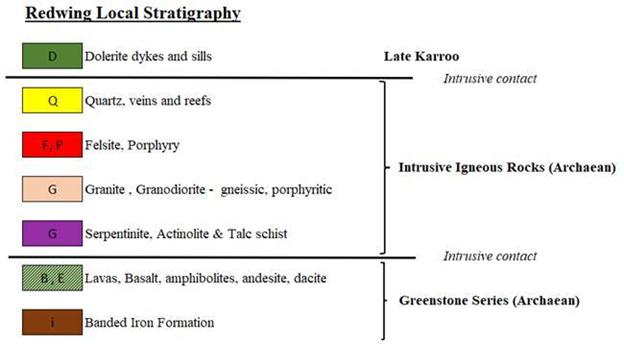
| Figure 6.5 | RGM local stratigraphy |
| Project No PS213686 | WSP |
| Redwing Mine | January 2025 |
| S-K 1300 Technical Report Summary | Page 24 |
| Bulawayo Mining Company Limited |
| 7 | Exploration |
| 7.1 | Diamond drilling |
Diamond core drilling is the drilling method employed at the RGM. Diamond drill core is logged and sampled on a 1 m interval, depending on geology. Samples are taken to at least 1 m beyond the geologically defined mineralisation boundary in all drill holes (KDM 2018).
Core size drilled at the RGM is typically AXT (35.51 mm core diameter) and BQ (36.50 mm core diameter) for evaluation and exploration drill holes respectively (KDM 2018).
All exploration drill holes are collar and downhole surveyed (KDM 2018).
| 7.1.1 | Historical exploration drilling |
An exploration drilling campaign targeting mostly the felsite orebody was carried out around RGM in the early 1980’s. The drilling covered an approximate area of 9 km2 (6 km x 1.5 km), with a total of 22 883 m drilled. The holes were on a widely spaced irregular grid. A total of 78 vertical drill holes were drilled, 31 of which had tails drilled near the end of hole with 1 drill hole having 2 tails drilled. 22 angled drill holes were drilled at various dips and bearings.
The area north of RGM that was covered by this exploration drilling is a target of in-fill drilling to upgrade the felsite resource from Inferred to Indicated mineral resource category.
Drill hole identity and collar survey coordinates are contained in Table 7.1. A plan view of all drill hole collars is provided in Figure 7.1.
| Table 7.1 | RGM historical surface drill hole data |
| Drill hole ID | Hole type | X-collar (mE) | Y-collar (mN) | Z-collar (mRL) | Dip (⁰) | Bearing (⁰) | Depth (m) | |||||||||||||||||||
| IM001 | Core | -35,016.70 | -87,338.50 | 1,195.80 | -90 | 180 | 160.00 | |||||||||||||||||||
| IM002 | Core | -34,814.50 | -87,325.00 | 1,181.20 | -90 | 180 | 136.00 | |||||||||||||||||||
| IM002DEF1 | Core | -34,814.50 | -87,325.00 | 1,094.10 | -75 | 0 | 22.40 | |||||||||||||||||||
| IM003 | Core | -34,612.50 | -87,372.00 | 1,189.50 | -90 | 180 | 99.40 | |||||||||||||||||||
| IM003DEF1 | Core | -34,612.50 | -87,372.00 | 1,122.10 | -75 | 0 | 20.40 | |||||||||||||||||||
| IM004 | Core | -34,314.60 | -87,470.10 | 1,181.60 | -90 | 180 | 231.40 | |||||||||||||||||||
| IM004DEF1 | Core | -34,314.60 | -87,470.10 | 962.40 | -75 | 0 | 12.20 | |||||||||||||||||||
| IM005 | Core | -34,102.20 | -87,530.10 | 1,169.00 | -90 | 180 | 284.00 | |||||||||||||||||||
| IM005DEF1 | Core | -34,102.20 | -87,530.10 | 909.20 | -75 | 0 | 22.40 | |||||||||||||||||||
| Project No PS213686 | WSP |
| Redwing Mine | January 2025 |
| S-K 1300 Technical Report Summary | Page 25 |
| Bulawayo Mining Company Limited |
| Drill hole ID | Hole type | X-collar (mE) | Y-collar (mN) | Z-collar (mRL) | Dip (⁰) | Bearing (⁰) | Depth (m) | |||||||||||||||||||
| IM006 | Core | -34,428.00 | -87,398.50 | 1,184.30 | -90 | 180 | 246.00 | |||||||||||||||||||
| IM007 | Core | -35,275.30 | -87,617.20 | 1,182.10 | -90 | 180 | 394.00 | |||||||||||||||||||
| IM007DEF1 | Core | -35,275.30 | -87,617.20 | 811.70 | -75 | 0 | 13.30 | |||||||||||||||||||
| IM008 | Core | -31,525.80 | -86,237.00 | 1,414.29 | -60 | 180 | 106.00 | |||||||||||||||||||
| IM008A | Core | -31,526.90 | -86,236.60 | 1,414.30 | -90 | 180 | 224.00 | |||||||||||||||||||
| IM009 | Core | -34,706.20 | -86,982.70 | 1,232.00 | -90 | 180 | 163.60 | |||||||||||||||||||
| IM009DEF1 | Core | -34,706.20 | -86,982.70 | 1,083.30 | -75 | 0 | 14.90 | |||||||||||||||||||
| IM010 | Core | -34,565.10 | -86,827.10 | 1,220.30 | -90 | 180 | 53.50 | |||||||||||||||||||
| IM011 | Core | -34,675.70 | -87,178.80 | 1,195.50 | -90 | 180 | 99.20 | |||||||||||||||||||
| IM011DEF1 | Core | -34,675.70 | -87,178.80 | 1,116.90 | -75 | 0 | 13.70 | |||||||||||||||||||
| IM012 | Core | -34,879.70 | -87,133.80 | 1,206.00 | -90 | 180 | 122.50 | |||||||||||||||||||
| IM012DEF1 | Core | -34,879.70 | -87,133.80 | 1,125.50 | -75 | 0 | 27.50 | |||||||||||||||||||
| IM013 | Core | -34,705.80 | -86,980.20 | 1,232.00 | -45 | 180 | 145.00 | |||||||||||||||||||
| IM014 | Core | -34,565.00 | -86,829.00 | 1,220.30 | -45 | 180 | 47.00 | |||||||||||||||||||
| IM015 | Core | -34,616.20 | -87,516.30 | 1,183.40 | -90 | 180 | 321.00 | |||||||||||||||||||
| IM015DEF1 | Core | -34,616.20 | -87,516.30 | 880.40 | -75 | 0 | 17.20 | |||||||||||||||||||
| IM016 | Core | -34,844.10 | -87,532.10 | 1,176.30 | -90 | 180 | 286.00 | |||||||||||||||||||
| IM016DEF1 | Core | -34,844.10 | -87,532.10 | 921.30 | -75 | 0 | 20.00 | |||||||||||||||||||
| IM016DEF2 | Core | -34,844.10 | -87,532.10 | 925.80 | -80 | 210 | 27.50 | |||||||||||||||||||
| IM017 | Core | -34,720.00 | -86,835.70 | 1,256.90 | -45 | 180 | 186.00 | |||||||||||||||||||
| IM018 | Core | -34,149.90 | -86,834.30 | 1,243.50 | -90 | 180 | 302.00 | |||||||||||||||||||
| IM019 | Core | -35,026.00 | -87,533.00 | 1,169.10 | -90 | 180 | 247.00 | |||||||||||||||||||
| IM019DEF1 | Core | -35,026.00 | -87,533.00 | 955.10 | -75 | 0 | 33.00 | |||||||||||||||||||
| IM020 | Core | -33,429.10 | -87,455.10 | 1,210.30 | -90 | 180 | 287.00 | |||||||||||||||||||
| IM021 | Core | -33,462.90 | -87,090.10 | 1,200.00 | -90 | 180 | 153.00 | |||||||||||||||||||
| IM021DEF1 | Core | -33,462.90 | -87,090.10 | 1,090.00 | -75 | 0 | 23.00 | |||||||||||||||||||
| IM022 | Core | -34,341.00 | -87,785.50 | 1,161.10 | -90 | 180 | 480.00 | |||||||||||||||||||
| IM022DEF1 | Core | -34,341.00 | -87,785.50 | 707.60 | -75 | 0 | 12.20 | |||||||||||||||||||
| IM023 | Core | -33,697.30 | -86,960.80 | 1,207.40 | -90 | 180 | 169.00 | |||||||||||||||||||
| IM023DEF1 | Core | -33,697.30 | -86,960.80 | 1,068.70 | -75 | 0 | 16.90 | |||||||||||||||||||
| Project No PS213686 | WSP |
| Redwing Mine | January 2025 |
| S-K 1300 Technical Report Summary | Page 26 |
| Bulawayo Mining Company Limited |
| Drill hole ID | Hole type | X-collar (mE) | Y-collar (mN) | Z-collar (mRL) | Dip (⁰) | Bearing (⁰) | Depth (m) | |||||||||||||||||||
| IM024 | Core | -34,763.00 | -87,741.70 | 1,164.90 | -90 | 180 | 490.00 | |||||||||||||||||||
| IM024DEF1 | Core | -34,763.00 | -87,741.70 | 705.30 | -75 | 0 | 12.40 | |||||||||||||||||||
| IM025 | Core | -33,450.00 | -87,226.80 | 1,192.60 | -90 | 180 | 200.00 | |||||||||||||||||||
| IM025DEF1 | Core | -33,450.00 | -87,226.80 | 1,019.60 | -75 | 0 | 35.00 | |||||||||||||||||||
| IM026 | Core | -33,904.00 | -86,939.00 | 1,207.70 | -90 | 180 | 131.00 | |||||||||||||||||||
| IM026DEF1 | Core | -33,904.00 | -86,939.00 | 1,103.70 | -75 | 0 | 20.30 | |||||||||||||||||||
| IM027 | Core | -33,772.70 | -87,830.80 | 1,154.30 | -90 | 180 | 156.00 | |||||||||||||||||||
| IM028 | Core | -34,767.30 | -87,128.10 | 1,202.00 | -90 | 180 | 129.00 | |||||||||||||||||||
| IM028DEF1 | Core | -34,767.30 | -87,128.10 | 1,112.50 | -75 | 0 | 19.50 | |||||||||||||||||||
| IM029 | Core | -33,644.40 | -87,348.80 | 1,178.80 | -90 | 180 | 202.50 | |||||||||||||||||||
| IM029DEF1 | Core | -33,644.40 | -87,348.80 | 1,002.30 | -75 | 0 | 18.50 | |||||||||||||||||||
| IM030 | Core | -36,174.40 | -87,848.90 | 1,156.40 | -90 | 180 | 404.50 | |||||||||||||||||||
| IM031 | Core | -33,662.60 | -87,162.30 | 1,180.20 | -90 | 180 | 141.00 | |||||||||||||||||||
| IM031DEF1 | Core | -33,662.60 | -87,162.30 | 1,079.50 | -75 | 0 | 22.30 | |||||||||||||||||||
| IM032 | Core | -33,772.60 | -87,831.20 | 1,154.30 | -72 | 0 | 423.50 | |||||||||||||||||||
| IM033 | Core | -34,406.00 | -87,611.40 | 1,169.60 | -90 | 180 | 515.00 | |||||||||||||||||||
| IM033DEF1 | Core | -34,406.00 | -87,611.40 | 678.90 | -75 | 0 | 18.80 | |||||||||||||||||||
| IM034 | Core | -34,543.50 | -87,751.80 | 1,175.40 | -90 | 180 | 483.00 | |||||||||||||||||||
| IM035 | Core | -35,703.00 | -87,908.30 | 1,155.00 | -90 | 180 | 212.00 | |||||||||||||||||||
| IM036 | Core | -34,467.80 | -88,017.60 | 1,161.30 | -90 | 180 | 779.00 | |||||||||||||||||||
| IM036DEF1 | Core | -34,467.80 | -88,017.60 | 411.30 | -75 | 0 | 17.70 | |||||||||||||||||||
| IM037 | Core | -33,309.90 | -87,105.40 | 1,210.30 | -90 | 180 | 179.00 | |||||||||||||||||||
| IM038 | Core | -36,478.80 | -87,320.40 | 1,196.70 | -60 | 180 | 197.50 | |||||||||||||||||||
| IM039 | Core | -36,281.10 | -87,358.30 | 1,179.20 | -90 | 180 | 275.00 | |||||||||||||||||||
| IM040 | Core | -37,112.10 | -87,363.20 | 1,163.20 | -90 | 180 | 40.70 | |||||||||||||||||||
| IM041 | Core | -37,012.20 | -87,329.70 | 1,161.20 | -90 | 180 | 14.90 | |||||||||||||||||||
| IM042 | Core | -36,901.00 | -87,322.90 | 1,165.90 | -90 | 180 | 23.30 | |||||||||||||||||||
| IM043 | Core | -36,896.90 | -87,355.70 | 1,166.10 | -90 | 180 | 16.70 | |||||||||||||||||||
| IM044 | Core | -36,898.50 | -87,287.40 | 1,166.40 | -90 | 180 | 22.70 | |||||||||||||||||||
| Project No PS213686 | WSP |
| Redwing Mine | January 2025 |
| S-K 1300 Technical Report Summary | Page 27 |
| Bulawayo Mining Company Limited |
| Drill hole ID | Hole type | X-collar (mE) | Y-collar (mN) | Z-collar (mRL) | Dip (⁰) | Bearing (⁰) | Depth (m) | |||||||||||||||||||
| IM045 | Core | -34,645.30 | -87,312.50 | 1,189.80 | -90 | 180 | 94.00 | |||||||||||||||||||
| IM046 | Core | -34,869.20 | -87,221.30 | 1,194.30 | -90 | 180 | 68.00 | |||||||||||||||||||
| IM047 | Core | -34,576.60 | -87,313.70 | 1,194.80 | -90 | 180 | 84.70 | |||||||||||||||||||
| IM048 | Core | -34,676.80 | -87,372.50 | 1,183.00 | -90 | 180 | 95.00 | |||||||||||||||||||
| IM049 | Core | -34,509.50 | -87,338.80 | 1,193.60 | -90 | 180 | 81.20 | |||||||||||||||||||
| IM050 | Core | -34,718.70 | -87,288.00 | 1,187.90 | -90 | 180 | 88.00 | |||||||||||||||||||
| IM051 | Core | -34,727.80 | -87,218.00 | 1,192.70 | -90 | 180 | 77.00 | |||||||||||||||||||
| IM052 | Core | -34,459.50 | -87,319.80 | 1,186.70 | -90 | 180 | 114.00 | |||||||||||||||||||
| IM053 | Core | -34,468.00 | -88,021.00 | 1,158.80 | -45 | 0 | 108.00 | |||||||||||||||||||
| IM054 | Core | -34,455.20 | -87,238.80 | 1,193.30 | -90 | 180 | 119.00 | |||||||||||||||||||
| IM055 | Core | -34,399.50 | -88,024.50 | 1,146.20 | -45 | 0 | 126.00 | |||||||||||||||||||
| IM056 | Core | -34,771.00 | -87,376.50 | 1,181.10 | -90 | 180 | 104.00 | |||||||||||||||||||
| IM057 | Core | -34,531.00 | -88,015.00 | 1,161.70 | -45 | 0 | 102.00 | |||||||||||||||||||
| IM058 | Core | -34,795.30 | -87,246.80 | 1,187.90 | -90 | 180 | 74.00 | |||||||||||||||||||
| IM059 | Core | -34,696.60 | -87,707.60 | 1,159.90 | -45 | 0 | 125.00 | |||||||||||||||||||
| IM060 | Core | -34,822.90 | -87,077.90 | 1,217.00 | -90 | 180 | 124.00 | |||||||||||||||||||
| IM061 | Core | -35,074.00 | -87,497.20 | 1,179.40 | -45 | 0 | 110.00 | |||||||||||||||||||
| IM062 | Core | - | - | - | -90 | 180 | 150.00 | |||||||||||||||||||
| IM063 | Core | -33,959.70 | -87,655.50 | 1,159.50 | -90 | 180 | 371.20 | |||||||||||||||||||
| IM066 | Core | -34,621.00 | -87,976.00 | 1,167.00 | -90 | 180 | 176.50 | |||||||||||||||||||
| IM067 | Core | -34,878.00 | -87,782.00 | 1,169.56 | -50 | 50 | 143.00 | |||||||||||||||||||
| IM068 | Core | -34,487.30 | -87,157.40 | 1,202.00 | -90 | 180 | 152.30 | |||||||||||||||||||
| IM069 | Core | -34,516.30 | -87,049.20 | 1,211.40 | -90 | 180 | 155.00 | |||||||||||||||||||
| IM070 | Core | -34,592.20 | -87,072.90 | 1,204.20 | -90 | 180 | 164.90 | |||||||||||||||||||
| IM071 | Core | -34,600.70 | -87,001.10 | 1,208.70 | -90 | 180 | 165.00 | |||||||||||||||||||
| IM072 | Core | -34,664.40 | -87,046.50 | 1,214.60 | -90 | 180 | 178.30 | |||||||||||||||||||
| IM073 | Core | -34,729.90 | -87,057.00 | 1,214.80 | -90 | 180 | 166.30 | |||||||||||||||||||
| IM074 | Core | -36,059.00 | -87,080.40 | 1,224.00 | -90 | 180 | 139.15 | |||||||||||||||||||
| IM075 | Core | -36,150.00 | -87,125.00 | 1,205.50 | -90 | 180 | 185.10 | |||||||||||||||||||
| Project No PS213686 | WSP |
| Redwing Mine | January 2025 |
| S-K 1300 Technical Report Summary | Page 28 |
| Bulawayo Mining Company Limited |
| Drill hole ID | Hole type | X-collar (mE) | Y-collar (mN) | Z-collar (mRL) | Dip (⁰) | Bearing (⁰) | Depth (m) | |||||||||||||||||||
| IM076 | Core | -36,270.10 | -87,130.30 | 1,198.10 | -90 | 180 | 205.00 | |||||||||||||||||||
| IM077 | Core | -36,264.00 | -87,164.30 | 1,192.80 | -50 | 180 | 119.00 | |||||||||||||||||||
| IM078 | Core | -36,293.40 | -87,170.00 | 1,196.66 | -50 | 180 | 59.72 | |||||||||||||||||||
| IM079 | Core | -36,349.90 | -87,178.70 | 1,202.57 | -50 | 180 | 85.00 | |||||||||||||||||||
| IM080 | Core | -33,728.70 | -86,782.60 | 1,239.00 | -90 | 180 | 197.50 | |||||||||||||||||||
| IM081 | Core | -33,782.70 | -86,782.60 | 1,239.00 | -60 | 180 | 43.80 | |||||||||||||||||||
| IM082 | Core | -33,728.70 | -86,782.60 | 1,239.00 | -60 | 140 | 121.90 | |||||||||||||||||||
| IM083 | Core | -33,977.70 | -86,825.10 | 1,244.80 | -90 | 180 | 150.57 | |||||||||||||||||||
| IM084 | Core | -34,934.00 | -87,053.00 | 1,230.53 | -90 | 180 | 110.60 | |||||||||||||||||||
| IM085 | Core | -34,969.90 | -87,745.00 | 1,168.99 | -90 | 180 | 607.39 | |||||||||||||||||||
| IM085DEF1 | Core | -34,969.90 | -87,745.00 | 578.99 | -75 | 0 | 19.00 | |||||||||||||||||||
| IM086 | Core | -35,408.20 | -87,788.40 | 1,177.20 | -90 | 180 | 607.32 | |||||||||||||||||||
| IM086A | Core | -35,408.20 | -87,788.40 | 1,177.20 | -90 | 180 | 73.90 | |||||||||||||||||||
| IM086DEF1 | Core | -35,408.20 | -87,788.40 | 603.32 | -75 | 0 | 30.46 | |||||||||||||||||||
| IM087 | Core | -34,160.40 | -87,752.70 | 1,169.66 | -90 | 180 | 463.17 | |||||||||||||||||||
| IM087DEF1 | Core | -34,160.40 | -87,752.70 | 742.42 | -75 | 0 | 31.68 | |||||||||||||||||||
| IM088 | Core | -33,479.80 | -87,006.60 | 1,194.06 | -90 | 180 | 200.23 | |||||||||||||||||||
| IM089 | Core | -33,589.20 | -86,917.60 | 1,217.47 | -90 | 180 | 200.48 | |||||||||||||||||||
| IM090 | Core | -34,002.50 | -87,853.90 | 1,163.57 | -90 | 180 | 524.00 | |||||||||||||||||||
| IM090DEF1 | Core | -34,002.50 | -87,853.90 | 670.57 | -75 | 0 | 29.55 | |||||||||||||||||||
| IM091 | Core | -34,226.20 | -87,924.00 | 1,165.49 | -90 | 180 | 622.23 | |||||||||||||||||||
| IM091DEF1 | Core | -34,226.20 | -87,924.00 | 606.49 | -75 | 0 | 34.00 | |||||||||||||||||||
| IM092 | Core | -34,790.60 | -87,957.50 | 1,154.02 | -90 | 180 | 802.92 | |||||||||||||||||||
| IM092DEF1 | Core | -34,790.60 | -87,957.50 | 444.02 | -75 | 0 | 44.20 | |||||||||||||||||||
| IM093 | Core | -35,160.50 | -87,670.00 | 1,169.00 | -90 | 180 | 420.80 | |||||||||||||||||||
| IM093DEF1 | Core | -35,160.50 | -87,670.00 | 813.50 | -75 | 0 | 64.65 | |||||||||||||||||||
| Project No PS213686 | WSP |
| Redwing Mine | January 2025 |
| S-K 1300 Technical Report Summary | Page 29 |
| Bulawayo Mining Company Limited |
| Drill hole ID | Hole type | X-collar (mE) | Y-collar (mN) | Z-collar (mRL) | Dip (⁰) | Bearing (⁰) | Depth (m) | |||||||||||||||||||
| IM094 | Core | -35,515.30 | -87,542.50 | 1,170.40 | -90 | 180 | 419.89 | |||||||||||||||||||
| IM094DEF1 | Core | -35,515.30 | -87,542.50 | 812.90 | -75 | 0 | 30.37 | |||||||||||||||||||
| IM095 | Core | -35,671.60 | -87,473.30 | 1,169.00 | -90 | 180 | 437.11 | |||||||||||||||||||
| IM095DEF1 | Core | -35,671.60 | -87,473.30 | 790.45 | -75 | 0 | 31.05 | |||||||||||||||||||
| IM096 | Core | -35,740.70 | -87,915.50 | 1,152.55 | -45 | 0 | 310.00 | |||||||||||||||||||
| IM098 | Core | -34,038.90 | -88,150.70 | 1,147.60 | -45 | 29 | 133.85 | |||||||||||||||||||
| IM099 | Core | -34,484.40 | -87,998.20 | 1,161.40 | -45 | 29 | 369.35 | |||||||||||||||||||
| IM100 | Core | -34,885.60 | -87,998.00 | 1,159.64 | -45 | 12 | 501.70 | |||||||||||||||||||
| IM101 | Core | -35,413.90 | -88,000.00 | 1,146.50 | -45 | 21 | 500.15 | |||||||||||||||||||
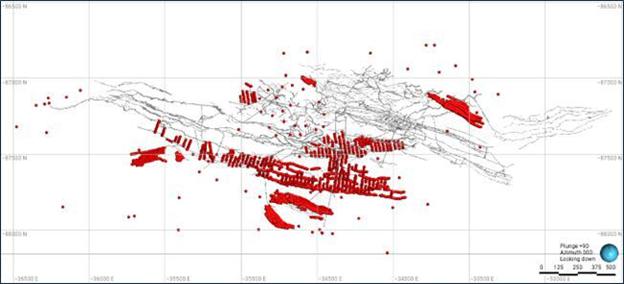
| Figure 7.1 | Plan view of all drill hole collars and existing mine development |
| 7.2 | Surface exploration |
The Redwing Exploration project was initiated on the premise that the felsite currently being mined underground had potential to be mined via opencast methods. Initial target generation was completed using computer-based models by extrapolation of the felsite orebody to the surface (RMC Zimbabwe 2025).
| 7.2.1 | Soil geochemical prospecting |
A soil geochemical grid was cut in over the redwing claims stretching from the most westerly Tsvingwe claims to as far east as the King daughter Claims with much of the open ground being north of the current workings and villages - Old West and Redwing. The initial grid was cut in at 200 m traverses x 25 m stations with infill gridding, at 100 m x 25 m, being cut in over the highly prospective ground stretching from the Iona Mine claims in the west, to King Daughter claims to the east. The western extension of the Tsvingwe claims was all covered by a 200 m x 25 m grid. Figure 7.2 shows the extent of the grids (RMC Zimbabwe 2025).
| Project No PS213686 | WSP |
| Redwing Mine | January 2025 |
| S-K 1300 Technical Report Summary | Page 30 |
| Bulawayo Mining Company Limited |
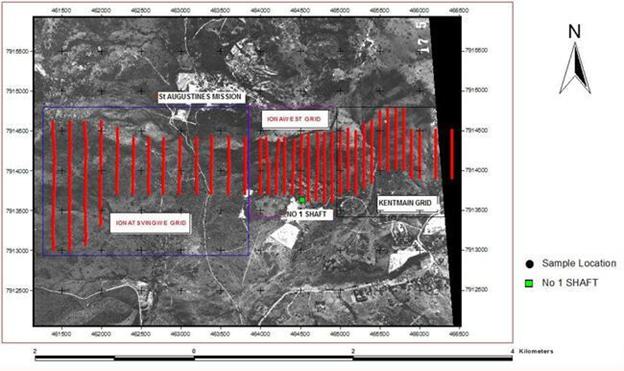
| Figure 7.2 | Redwing Project soil geochemical prospecting grids (RMC Zimbabwe 2025). |
| 7.2.2 | Trenching and pitting |
The initial trenching within the Redwing claims was wholly based on the anomalies generated from the soil geochemistry exercise with the rest being either strike extensions of significant intercepts or occasionally over prospective structures identified during mapping. A total of 1,473.70 m of trenching were dug. Table 7.2 shows some of the trenches for which significant intercepts were picked up and have subsequently been included as part of the drilling program for Redwing. Most of the trenches within the redwing claims were over felsite outcrops with the rest being across narrow shear quartz veins. Typical phenomenon was mineralisation of felsite in the footwall or hanging wall contacts with internal mineralisation being due to occasional tensional quartz veins that predominantly displayed pinch and swell structures.
Table 7.2 Significant trench intercepts within the Redwing Grid
| Trench | Easting (mE UTM) | Northing start (mN UTM) | Northing end (mN UTM) | Comment | Intercept value | |||||||||||
| 65349A | 465,349 | 7,913,949 | 7,913,950 | Felsite(fs) | 1 m @ 0.7 g/t | |||||||||||
| 65349A | 465,349 | 7,913,952 | 7,913,953 | strongly foliated (sf) metabasalt (mb) | 1 m @ 1.7 g/t | |||||||||||
| 65200A | 465,200 | 7,914,119 | 7,914,122 | very strongly foliated (vsf), pyritiferous(pyt) felsite | 3.7 m @ 1.9 g/t | |||||||||||
| 64855A | 464,855 | 7,913,875 | 7,913,879 | felsite | 4 m @ 1.05 g/t | |||||||||||
| 64855A | 464,855 | 7,913,881 | 7,913,897 | felsite | 16 m @ 1.44 g/t | |||||||||||
| 65230A | 465,230 | 7,914,116 | 7,914,117 | Felsite,vsf | 1 m @ 1.0 g/t | |||||||||||
| Project No PS213686 | WSP |
| Redwing Mine | January 2025 |
| S-K 1300 Technical Report Summary | Page 31 |
| Bulawayo Mining Company Limited |
| Trench | Easting (mE UTM) | Northing start (mN UTM) | Northing end (mN UTM) | Comment | Intercept value | |||||||||||
| 65155A | 465,155 | 7,914,120 | 7,914,121 | very strongly xoidized (vso), pytiferous felsite | 1 m @ 2.25 g/t | |||||||||||
| 65155A | 465,155 | 7,914,121 | 7,914,124 | pytf fs,vso,vsf+1.5m vertical | 3 m @ 2.5 g/t | |||||||||||
| 65291A | 465,291 | 7,914,135 | 7,914,139 | vsf pytiferous fs +qtz veinlets | 4 m @ 1.26 g/t | |||||||||||
| 65145A | 465,145 | 7,914,120 | 7,914,121 | Acs-fs contamination, hosting qtz vein ,lim rich | 1 m @ 2.07 g/t | |||||||||||
| 65145A | 465,145 | 7,914,122 | 7,914,123 | fs contamination+qtz veinlets in Acs-ts bands | 1 m @ 1.2 g/t | |||||||||||
| 65145A | 465,145 | 7,914,125 | 7,914,125 | pytiferous fs,vso+1m vertical | 1 m @ 0.5 g/t | |||||||||||
| 65085A | 465,085 | 7,914,148 | 7,914,150 | bleached fs,strongly fractured+1m vertical | 2.5 m @ 15.3 g/t | |||||||||||
| 65127A | 465,127 | 7,914,012 | 7,914,013 | vso felsic rock hosting 10-30cm shear qtz vein | 1 m @ 1.16 g/t | |||||||||||
| 65165A | 465,165 | 7,914,126 | 7,914,128 | vsf pytiferous felsite | 2 m @ 1.25 g/t | |||||||||||
| 65124A | 465,124 | 7,914,010 | 7,914,011 | vsf mb hosting 10-30cm fault qtz vein | 1 m @ 7.05 g/t | |||||||||||
| 65210A | 465,210 | 7,914,112 | 7,914,115 | pyritiferous fs,vso&foliated with 1-5 cm qtz vein | 3.5 m @ 2.59 g/t | |||||||||||
| 65221A | 465,221 | 7,914,116 | 7,914,118 | vsf pyritiferous fs | 3.5 m @ 1.81 g/t | |||||||||||
| 65291A | 465,291 | 7,914,137 | 7,914,139 | vsf pyritiferous fs with qtz veinlets | 3.3 m @ 1.8 g/t | |||||||||||
| 65311A | 465,311 | 7,914,133 | 7,914,137 | vsf pyrt felsite | 4 m @ 1.34 g/t | |||||||||||
| 65324A | 465,324 | 7,914,132 | 7,914,132 | vso felsite | 3.5 m @ 1.36 g/t | |||||||||||
| 65336A | 465,336 | 7,914,130 | 7,914,131 | vsf fs with 1-3cm qtz vein and veinlets | 1.5 m @ 3.42 g/t | |||||||||||
| 66488B | 466,488 | 7,914,098 | 7,914,098 | pyrtiferous quartz reef (Kings Daughter) | 0.2 m @ 22 g/t | |||||||||||
| Project No PS213686 | WSP |
| Redwing Mine | January 2025 |
| S-K 1300 Technical Report Summary | Page 32 |
| Bulawayo Mining Company Limited |
| Trench | Easting (mE UTM) | Northing start (mN UTM) | Northing end (mN UTM) | Comment | Intercept value | |||||||||||
| 66468A | 466,468 | 7,914,083 | 7,914,087 | quartz veined sheared actinolite schist | 4 m @ 1.9 g/t | |||||||||||
| 66511A | 466,511 | 7,914,070 | 7,914,076 | quartz veined sheared actinolite schist | 6 m @ 2.4 g/t | |||||||||||
| 66523A | 466,523 | 7,914,068 | 7,914,071 | quartz veined sheared actinolite schist | 3 m @ 2.43 g/t | |||||||||||
| 66532A | 466,532 | 7,914,065 | 7,914,066 | quartz veined sheared actinolite schist | 1 m @ 3.5 g/t | |||||||||||
| 63896A | 463,896 | 7,913,902 | 7,913,903 | mb-ts contact | 1 m @ 16.96 g/t | |||||||||||
| 65286A | 465,286 | 7,913,967 | 7,913,968 | quartz veined mb | 1 m @ 38.06 | |||||||||||
| 65286A | 465,286 | 7,913,970 | 7,913,971 | very strongly foliated (vsf) mb | 1 m @ 5.27 g/t | |||||||||||
| 65286A | 465,286 | 7,913,990 | 7,913,991 | very strongly foliated (vsf) mb | 1 m @ 3.09 g/t | |||||||||||
| 65286A | 465,286 | 7,913,997 | 7,913,998 | very strongly foliated (vsf) mb | 1 m @ 14.73 g/t | |||||||||||
| 64600C | 464,600 | 7,914,129 | 7,914,130 | quartz veined sheared actinolite schist | 1 m @ 14.73 g/t | |||||||||||
| 65124A | 465,124 | 7,914,010 | 7,194,011 | mb with 30cm quartz vein | 1 m @ 7.05 g/t | |||||||||||
| 63813A | 463,813 | 7,913,937 | 7,913,938 | quartz veined sheared actinolite schist | 1 m @ 11.6 g/t | |||||||||||
| 66488A | 466,488 | 7,914,083 | 7,914,084 | quartz veined sheared actinolite schist | 1 m @ 1.86 g/t | |||||||||||
| 66488B | 466,488 | 7,914,103 | 7,914,104 | quartz veined sheared actinolite schist | 1 m @ 2.4 g/t | |||||||||||
| 66488B | 466,488 | 7,914,106 | 7,914,107 | quartz veined sheared actinolite schist | 1 m @ 11.4 g/t | |||||||||||
| 7.3 | QP’s opinion |
The QP considers the data collected, including the method of collection and storage to be appropriate for the preparation of geological models and Mineral Resources estimates, and that the data has been considered during resource classification.
| Project No PS213686 | WSP |
| Redwing Mine | January 2025 |
| S-K 1300 Technical Report Summary | Page 33 |
| Bulawayo Mining Company Limited |
| 8 | Sample preparation, analyses, and security |
| 8.1 | Sampling techniques |
The following types of samples are used at the RGM for Mineral Resources estimation (KDM 2018):
| 8.1.1 | Core sampling |
For underground evaluation and exploration drill holes, full core is sampled, while for surface exploration drill holes, mineralised zones only are split in half using a core splitter, with half the core being sent for assay and the other half kept for future reference (KDM 2018).
Current practise is that half core and pulp from exploration holes is stored and only discarded after mining through the areas (KDM 2018).
| 8.1.2 | Channel sampling |
Channel samples used in the resource evaluation process are taken using a pneumatic diamond-saw. A 10 millimetre (mm) deep/30 mm wide channel is cut into the roof of a drive or sidewall of a cross-cut. Sample is collected from the channel using a hammer and cold chisel. Channels are cut at 2 m intervals. The typical sample length is 1 m; however, this may be smaller to allow for variations in geology, apparent mineralisation or excavation dimensions (KDM 2018).
| 8.1.3 | Grab sampling |
Grab samples are mainly taken from active boxes and draw-points for production monitoring grade control. For each shift a composite sample per box or draw point is taken for assaying (KDM 2018).
| 8.1.4 | Drive face and stope-bench sampling |
Drive face and stope-bench samples are taken at the discretion of the Geologist using chisel and hammer method or a pneumatic diamond-saw. These samples are used for mining and grade control purposes (KDM 2018).
| 8.1.5 | Sample security |
Samples are taken and transported to surface by a designated sampler. Upon arrival on surface at the shaft, the sampler is escorted by Security until the samples are submitted at the Assay Laboratory (KDM 2018).
| 8.2 | Dry bulk density determination |
Dry bulk density (BD) determinations were conducted in-house by the RGM assay laboratory technicians on samples collected from underground development material. Sample material was obtained from sources in both the Felsite and MSZ. The exercise initially commenced in 1997, to validate the historical figure of 2.70 tonnes per cubic metre (t/m3) that was in use. Confirmatory re-runs were completed in 2001 and 2017, producing similar results (KDM 2018).
| 8.3 | Sample preparation, analysis and procedures |
The bulk of the samples collected during production and exploration activities are analysed at the RGM on-site assay laboratory. These samples include channel, drill core, drive or stope face and box grabs and processing plant samples (KDM 2018).
| Project No PS213686 | WSP |
| Redwing Mine | January 2025 |
| S-K 1300 Technical Report Summary | Page 34 |
| Bulawayo Mining Company Limited |
Approximately 6,000 samples were assayed per month up to the end of December 2007. This was reduced to 2,000 samples during the period January 2008 to March 2008 as a result of reduced underground operations due to flooding. From October 2012 to September 2013, due to a reduced level of mining activities, the on-site assay laboratory processed an average of 1,110 solid samples and 2,160 solution samples per month. The RGM resumed underground operations in the first quarter of 2015 and from April to December 2015, the on-site assay laboratory processed an average of 1,530 solid samples per month. Up until the time the RGM was placed on C&M on 1 April 2019, the number of samples processed per month averaged approximately 3,114 solid samples and 2,293 solution samples (KDM 2018).
Dried samples are crushed to -5 mm in a Boyd Crusher, riffle split to 500 g and pulverised in a ring-mill/ vertical spindle pulveriser to 100% -150 micrometres (µm). From the pulverised sample, a 25 g (50 g charge for diamond drill core, channel and plant metal accounting samples) charge is fire assayed with gravimetric finish. Solution and carbon samples are treated using atomic absorption spectroscopy (AAS) [KDM 2018].
Internal standards are introduced at a rate of two in every 16 samples assayed. The mine also runs a repeat assay register that is kept in the Geology Department for the purpose of monitoring laboratory performance. Drill core and mill feed samples are routinely assayed in duplicate. Exploration core samples are sent to external commercial laboratories for assaying. Repeat samples are taken only on mineralised intersections (KDM 2018).
The mine maintains a record of all samples taken for assaying. Samples collected from underground have their details kept in field logbooks, from which information is transferred to daily return and assay laboratory report sheets. Depending on use, upon receipt, assays are plotted on assay plans, captured into the mine Vulcan™ Isis database or dispatched to end-users for decision making (KDM 2018).
A similar procedure is followed for diamond drill core samples. Records are kept in logbooks, log-sheets, the mine Vulcan™ Isis database and assay sheets. The on-site assay laboratory also maintains records of all samples processed (KDM 2018).
| 8.4 | Quality Assurance Quality Control |
Quality Assurance and Quality Control (QAQC) procedures used at the RGM (KDM 2018) are as described below.
| 8.4.1 | Drill core |
| — | Core derived from surface exploration activities is logged and spit into two halves using a core splitter prior to sampling. Underground core (both exploration and evaluation) is logged and sampled without being split. |
| — | Standard and duplicate samples are inserted at a rate of 10%, whilst blank samples are inserted at a rate of 20%. |
| — | An accredited laboratory is used for analysis of surface exploration diamond drill core samples. A separate laboratory is used as an umpire laboratory, analysing pulp duplicate samples. The on-site assay laboratory is used for analysis of drill core derived from underground exploration and evaluation drilling. |
| — | Reference material is tested for compliance to set standards, typically ± 2 standard deviations (SD) from the designated mean value. |
| — | Assay batches that are rejected are subject to either re-assay or discarded with appropriate qualifications, e.g., contamination, ticket mix-up, and transcription errors etc. |
| 8.4.2 | Channel and grab samples |
| — | House standards, duplicate samples and blank samples are used for QAQC to monitor the day to day running of the mining operation. These samples are inserted at a rate of 20%. |
| — | Reference material is tested for compliance to set standards, typically ± 2 SD from the designated mean value. |
| — | Assay batches that are rejected are subject to either re-assay or discarded with appropriate qualifications, e.g., contamination, ticket mix-up and transcription errors etc. |
| Project No PS213686 | WSP |
| Redwing Mine | January 2025 |
| S-K 1300 Technical Report Summary | Page 35 |
| Bulawayo Mining Company Limited |
| — | The on-site assay laboratory has its own duplicate and standard samples that the Chief Assayer uses to monitor laboratory performance. For every batch of 16 samples, one high-grade standard and one low-grade standard sample are utilised. |
| 8.4.3 | Certified Reference Material |
WSP was not supplied with any data relating to the Certified Reference Material (CRM) samples used at the RGM. or historical performance of QAQC samples used.
| 8.4.4 | Blanks |
Blanks are inserted at a rate of 20% for drill core, channel samples, and grab samples.
| 8.4.5 | Duplicates |
An accredited laboratory is used for analysis of surface exploration diamond drill core samples. A separate laboratory is used as an umpire laboratory, analysing pulp duplicate samples. The on-site assay laboratory is used for analysis of drill core derived from underground exploration and evaluation drilling.
The on-site assay laboratory has its own duplicate and standard samples that the Chief Assayer uses to monitor laboratory performance of Channel and Grab Samples. For every batch of 16 samples, one high-grade standard and one low-grade standard sample are utilised.
| 8.5 | QP’s opinion on adequacy |
The QP considers the QAQC, and security protocols used at the Property to be appropriate in regard to the data used in the preparation of Mineral Resources estimates, and that the data has been considered during resource classification.
| Project No PS213686 | WSP |
| Redwing Mine | January 2025 |
| S-K 1300 Technical Report Summary | Page 36 |
| Bulawayo Mining Company Limited |
| 9 | Data verification |
| 9.1 | Mineral Resources data verification |
| 9.1.1 | Data verification conducted by RMC Zimbabwe |
Data validation conducted by RMC Zimbabwe was done so using Microsoft Excel, inbuilt Vulcan™ software validation tools, physical checks, and correction of any erroneous input data to ensure completeness, and integrity of captured data. Transcription errors were checked, identified, and corrected through direct comparison of captured data with data sources such as assay plans, and diamond drill core log sheets. Drill hole collar locations and elevations were inspected, verified and corrected in Vulcan™. RMC Zimbabwe staff also conducted visual validation of the block models developed (KDM 2018).
| 9.1.2 | Data verification conducted by WSP |
The QP has validated the following geological and Mineral Resources estimation data:
| — | Drill hole collar locations. |
| — | Drill hole downhole survey. |
| — | Sampling techniques. |
| — | Development wireframes. |
| — | Resource wireframes. |
| — | Block models. |
| — | Mineral Resource tonnages and grades. |
Some errors were identified in drill hole locations, survey, validity of the wireframes, and cases of missing blocks within resource wireframes.
Resource classification was performed manually by external consultants which could not be independently verified by the QP.
| 9.1.3 | Limitations on exploration and Mineral Resources data verification |
The QP was not directly involved in the exploration drilling, and sampling programs that formed the basis for collecting the data used in the geological modelling and Mineral Resources estimates for the Property, and was unable to observe drilling, sampling, and sample preparation methods at the RGM during the personal inspection (Section 2.4).
The QP is not aware of any other limitations on nor failure to conduct appropriate data verification.
The QP has validated the data presented in Section 9.1, including collar survey, down hole geological data and observations, sampling, analytical, and other test data underlying the information or opinions contained in the written disclosure presented in this TRS. The QP has presented information relating to uncertainty in the estimates of Inferred, Indicated, and Measured Mineral Resources (Section 11.5), and opinions on factors likely to influence the prospect of economic extraction. A comprehensive list of Mineral Resources interpretations and conclusions, and Mineral Resources recommendations have also been presented in Sections 22.1 and 23.1 respectively.
Notwithstanding these matters, the QP considers the data used is acceptable for the purposes of geological modelling and Mineral Resources estimation.
| Project No PS213686 | WSP |
| Redwing Mine | January 2025 |
| S-K 1300 Technical Report Summary | Page 37 |
| Bulawayo Mining Company Limited |
| 9.2 | Mining and Mineral Reserves data verification |
Using the data provided by RGM, the following has been conducted as spot checks:
| — | Six stopes with the highest declared reserves have been selected for spot checks. Tonnage and grade were estimated using Deswik mining software to interrogate block models using supplied Mineral Resource wireframes. Mineral Reserve wireframes are not prepared. Dilution was applied manually using Microsoft Excel software, with independent checks also undertaken to match the reported dilution. |
| — | The QP considers the data suitable for the purposes of preparing the mine design, mine schedule, and Mineral Reserves estimate. |
| 9.3 | Geotechnical data verification |
No written procedures outlining the processes of geotechnical logging, data importing, QA/QC and validation have been provided to WSP. Geotechnical data is limited to the Rock Engineering Review for Redwing undertaken by SRKSA, this report along with two of the reports reviewed by SRKSA (Hogan 1991 and Kersten n.d.) were made available to WSP for confirmation.
Geotechnical data is collected during core logging and underground mapping (KDM 2018, SRKSA 2016).
At the request of BMC Limited, SRK Consulting (South Africa) (Pty) Ltd (SRKSA) undertook a review of rock mechanics work done by various consultants previously. A total of eight rock engineering reports by different consultants were made available to SRK consulting for the purpose of this review. The sparse data suggests a low confidence in the design calculations (SRKSA 2016).
Table 9.1 summarises the material properties that were obtained by SRKSA from the previous reports.
| Table 9.1 | Summary of laboratory results (SRKSA (2016)) |
| Sector | Rock type | Quantity | UCS average (MPa) | Modulus | Source | Comment | ||||||
| Unknown | Felsite | 14 | 190 | Not done | Budavari (1981) | Orebody | ||||||
| Unknown | Unknown | Unknown | 200 | 58 GPa | Unknown | No reference | ||||||
| Unknown | Unknown | Unknown | 195 | 58 GPa | Hogan (1991) | No reference | ||||||
| 14 Level | Diorite | Unknown | 215 | 58 GPa | Kersten (n.d.) | Hangingwall | ||||||
| Unknown | Unknown | 5 | 190.6 | Not done | Bell. P (1989) | No reference | ||||||
| Unknown | Unknown | 5 | 61.7 | Not done | Bell. P (1989) | No reference |
Key findings from SRKSA (2016) are detailed in Section 13.2.1.
In the opinion of the QP, the geotechnical data used to inform design parameters is of adequate quality for the Property and its material types and for the purposes used in this TRS.
| Project No PS213686 | WSP |
| Redwing Mine | January 2025 |
| S-K 1300 Technical Report Summary | Page 38 |
| Bulawayo Mining Company Limited |
| 9.4 | Hydrogeology and hydrology data verification |
No specific hydrological or hydrogeological studies have been undertaken for the RGM. The following is a general characterisation of the RGM area.
The RGM is located within the Odzi Sub-Catchment of the Save Catchment. Figure 9.1 shows the various Zimbabwe catchments, and Figure 9.2 shows the sub-catchments of the Save catchment (Waterkings 2012).
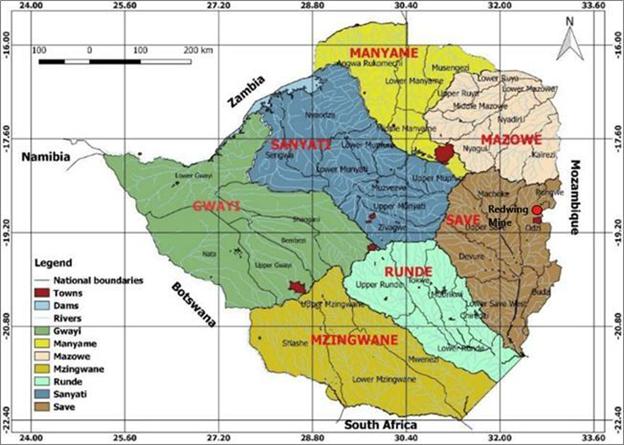
| Figure 9.1 | Catchment boundaries of Zimbabwe (BMC Limited) |
| Project No PS213686 | WSP |
| Redwing Mine | January 2025 |
| S-K 1300 Technical Report Summary | Page 39 |
| Bulawayo Mining Company Limited |
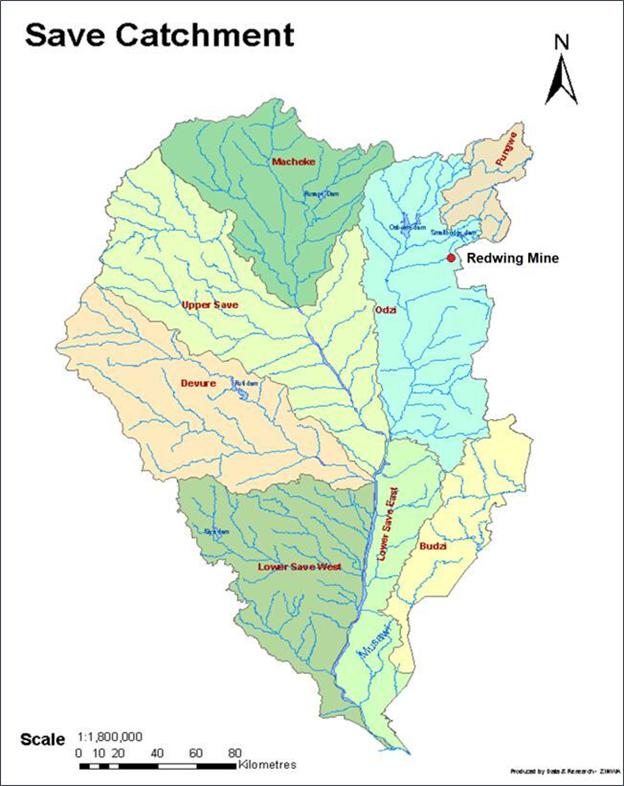
| Figure 9.2 | Sub-catchment boundaries of Save Zimbabwe (BMC Limited) |
| Project No PS213686 | WSP |
| Redwing Mine | January 2025 |
| S-K 1300 Technical Report Summary | Page 40 |
| Bulawayo Mining Company Limited |
| 9.4.1 | Hydrology |
The RGM is located within the hydrological sub-zone EO3 of the Odzi sub-catchment of the Save catchment. The area around the RGM experiences a Mean Annual Run-off (MAR) of 191 mm and a Coefficient of Variation (CV) of 70%, thus the chances of experiencing the recorded MAR are slim. The hydrology of the RGM is controlled by the Mutare River which drains to the west into Odzi River, the major river in the hydrological sub-zone. The area experiences an average annual rainfall of 2,000 mm. Maximum temperatures average 20°C and evaporation is 1,200 mm per annum. These climatic conditions ensure a perennial flow of these two major rivers and their tributaries (Waterkings 2012).
| 9.4.2 | Hydrogeology |
The significant hydrogeological systems around the RGM are greenstones and granitic gneissose rocks. Formation of groundwater in these systems is determined by the development of secondary structures such as fractures, faults and weathering and shearing within the greenstones. These systems have a low to moderate ground water potential. Shallow ground water is vulnerable to contamination from improperly built facilities and application of fertilisers, herbicides, pesticides, oils, chemicals and any run-off. Water sources built downstream of sanitation facilities are at most risk of contamination (Waterkings 2012).
| — | General groundwater potential: low to moderate. |
| — | Abstraction facilities: boreholes, deep and shallow wells. |
| — | General water strike range: 15 to 60 m. |
| — | Borehole depth: 40 to 80 m. |
| — | Deep well depth: 10 to 20 m. |
| — | Shallow well depth: <10 m along river channels and low laying areas. |
| — | Water level range: 5 to 30 m. |
| — | General average yield: 0.02–2.0 litres per second (l/s). |
| — | General water quality: Good for human consumption, crops and livestock consumption (Waterkings 2012). |
In the opinion of the QP, the data used to inform the groundwater models is of adequate quality.
In the opinion of the QP, this data is adequate for use in the mine design and mine schedules, and for the purposes used in this TRS.
| 9.5 | Processing and recovery methods data verification |
The process plant remains on C&M. Process historical data and performance are provided under Section 14.
In the opinion of the QP, the processing and recovery methods data used to inform product predictions are adequate for the purposes used for this TRS.
| Project No PS213686 | WSP |
| Redwing Mine | January 2025 |
| S-K 1300 Technical Report Summary | Page 41 |
| Bulawayo Mining Company Limited |
| 10 | Mineral processing and metallurgical testing |
| 10.1 | Nature and extent of mineral processing and metallurgical testing |
| 10.1.1 | Mineral processing |
RMG has a long history of mining and processing extending back to discovery in 1889 (Section 5) that provides a guide to metallurgical performance and gold recovery. Most recently Lonrho operated the mine from 1980 to 2002 when it was acquired by Metallon. The mine was then operated until it flooded in 2008, following which tailing sands were processed until 2013. The mine was then dewatered and recommenced production in November 2015. Declining production at lower than forecast grades resulted in uneconomic operation and a decision to place in the mine on C&M 1 April 2019. The process route for the mothballed plant entails treatment in stages comprising crushing, milling, gravity separation, flotation, Merril-Crowe Process, CIP, and elution. The plant recent production record since 1981 is presented in Figure 10.1 and indicates average recovery of 90% at an average feed grade of 3.15 g/t for the period 1981–2023 and average recovery of 86% at a lower average feed grade of 2.83 g/t for the period 2013–2018.
On recommencement of process operations with refurbished or replacement plant, recoveries in the range 86–90% could be expected.
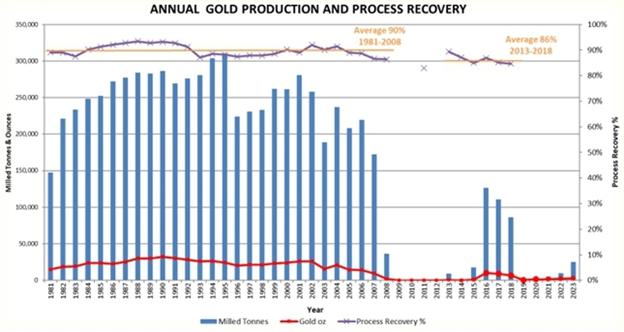
| Figure 10.1 | Process plant production and recovery 1981–2023 |
| Project No PS213686 | WSP |
| Redwing Mine | January 2025 |
| S-K 1300 Technical Report Summary | Page 42 |
| Bulawayo Mining Company Limited |
| 10.1.2 | Process testwork |
The only documented account of metallurgical testwork supplied by RMG was undertaken by Peacocke, Simpson & Associates who carried out test work on a bulk ore sample of the Redwing mill feed in October 1994. The average head assay of the sample was 1.93 g/t Au and the test work built back to a grade of 2.19 g/t Au. Knelson centrifugal concentration recovered 85.2% of the gold and out of this 53.19% could be considered as free gold with the remainder being associated with sulfides. A peak flotation recovery of 86% was achieved for a grade of 57.1 g/t Au. Evidence suggests a prolonged relatively gentle flotation pull best suits the mineral flotation kinetics. Losses to flotation tailings appear to be attributable to overground sulfides at 15 μm and unliberated sulfides grains which would require even finer grinding still. The “ultimate” grade achievable for a bulk sulfide was 117 g/t Au.
The testwork program also concluded that:
| — | Gravity recovery via a Knelson concentrator is optimal for a 70% passing 75 um grind size. |
| — | 71% of the gold in the flotation tailings is either expose or loosely bound in a sulphide matrix. A further 16% corresponds to gold well occluded in a sulphide matrix and 5% appears to correspond to very fine dissemination or a thorough occlusion. |
| — | The residual value in the tailings is due to a combination of ultra ground sulphides and unliberated sulphides. |
It is not clear from this work whether grind size has been optimised for an alternative CIP/CIL process route.
| 10.2 | Metallurgical sampling representativity |
From the range of testwork conducted by Peacock et al (1994) and the extended period operation of the plant, the QP is satisfied that the sampling and outcomes are representative of the various types and styles of mineralisation and the mineral deposit as a whole.
| — | Mill Sample-Grind Curve Generation: |
| — | A composite sample was subjected to grindability in a standard mill measuring percent passing of 75- μm vs grind time. |
| — | Mill Feed-Gravity Concentration: |
| — | Test work to investigate the recovery of Au via gravity concentration by grounding sample to 70% passing 75 μm. Free gold was observed. |
| — | Test work to investigate the recovery of Au via gravity concentration by grounding sample to 100% passing 75 μm. Free gold was also observed. |
| — | Mill Feed-Single Stage Flotation Test Grade/Recovery Relationship: |
| — | Test work to investigate the recovery of Au by flotation. Batched were cursed to 100% passing 3.13 mm and ground to 70% passing 75 μm. Four batch was also conducted from light pulling to heaviest pulling of concentrate. |
| — | Flotation Tailings-Diagnostic Leaching: |
| — | Test work to determine extraction of gold at various stages prior to and after acid washing, regrinding etc., and attempt to diagnose the physical and chemical nature of fold lock-up. |
| — | Mill Feed-Rougher/Cleaner Flotation Test: |
| — | Test work to investigate the recovery of Au cleaner flotation. |
| — | Final Concentrates-Gravity Concentration: |
| — | Test work to investigate the recovery of Au via gravity concentration. |
| Project No PS213686 | WSP |
| Redwing Mine | January 2025 |
| S-K 1300 Technical Report Summary | Page 43 |
| Bulawayo Mining Company Limited |
| 10.3 | Details of analytical or testing laboratories |
Sample analysis for underground ore mining and processing was completed at the onsite laboratory located at Redwing (refer to Section 10.1).
The Metallurgical Test work was carried out by Peacocke, Simpson & Associates (PVT) Ltd.
| 10.4 | Recovery Estimates |
The QP considers that the old underground ore process plant delivers recoveries that have historically averaged 86–90% as a guide to potential future process recovery.
No deleterious elements have been highlighted for underground sourced ore.
A finer grind size above 70% passing 75 µm may not necessarily improve recoveries for the mothballed flotation/Merril Crowe/CIL style plant as evidenced by the testwork. This testwork also indicated total sulfides content of <0.5%, mostly comprising pyrite accompanied by some galena, pyrrhotite, a few grains of chalcopyrite and molybdenite (one grain positively identified); some CuO was also observed (CN consumer); enclosure of free gold (~10 μm) in a gangue particle; more than 50% of the sulfides grains enclosed or attached to gangue particles; and with an average grain is ~15 μm. This suggests liberation and leach kinetics could be examined further to optimise recovery.
Further testwork for a CIP/CIL process route may be required to test the potential to optimise recoveries at finer grind sizes. Addressing process circuit operating efficiencies by plant refurbishment and/or replacement may also improve recoveries.
| 10.5 | QP’s opinion on adequacy of the data collected |
The QP considers that the historical operation of the flotation/Merrill-Crowe/CIL process route provides a guide to anticipated recoveries at rated throughputs. The intention to escalate production rates for any restart of operations will necessitate a review of both the process route and the best option for capital upgrade of the plant.
Recommencement of mining and process operations will require:
| — | A process feasibility study prior to significant refurbishment, upgrade and/or replacement of the existing plant. |
| — | Additional metallurgical testwork to assess alternate processing options to optimise recovery, throughput and cost. |
| Project No PS213686 | WSP |
| Redwing Mine | January 2025 |
| S-K 1300 Technical Report Summary | Page 44 |
| Bulawayo Mining Company Limited |
| 11 | Mineral Resource estimates |
| 11.1 | Key assumptions, parameters, and methods |
| 11.1.1 | Care and maintenance |
There has been no mining or exploration conducted since the mine was placed on C&M in April 2019. In the interim, the mine has flooded to approximately 50 m below surface. Therefore, in the QP’s opinion the 2018 assumptions regarding definition of the Mineral Resource base remain current.
| 11.1.2 | Resource database |
Data captured in Vulcan™ includes (KDM 2018):
| — | Survey data (pegs, drives, stopes, and raises). |
| — | Assay values, sample lengths and co-ordinates (channel and drill samples). |
| — | Orebody outlines digitised from assay entries. |
Various methods are used to capture data in Vulcan™. The major techniques used are digitising, American Standard Code for Information Interchange (ASCII) import, and direct capture onto datasheets.
| 11.1.3 | Geological interpretation |
The felsite orebody is a well-defined lithological unit that can be followed without difficulty. Mineralisation is confined to the felsite and linked to quartz stringers/veinlets, with sulphides present in varying concentrations (KDM 2018).
The MSZ orebodies (narrow reefs) are relatively narrow, and as such, well defined in terms of their geological boundaries. The ore shoots are delineated by assay cut-offs. These can be followed with a reasonable level of confidence (KDM 2018).
| 11.1.3.1 | Geological modelling – Vulcan™ |
Orebody boundaries are clearly defined, and the mineralisation envelope is defined by assay cut-offs. Narrow orebodies with little or no data between levels are digitised directly from assay plans into Vulcan™. Orebody outlines are constructed using plan sections defined by diamond drill hole intersects. These outlines (strings) are then modelled to create a three-dimensional (3D) orebody wireframe (triangulation). From exploration drilling, orebody models (triangulations) are first developed from cross-section envelopes defined by assay cut-offs. Models are then refined using plan sections guided by the triangulation developed on cross-sections. Plan sections are then modelled to produce final orebody wireframe (KDM 2018).
| 11.1.4 | Data preparation |
For the derivation of larger sample support, and to provide equal weighting to all samples, combined channel and diamond drill core assay data is composited to 1 m sample lengths for the Felsite orebody. For the MSZ, compositing was completed using geology and run length compositing (KDM 2018).
| 11.1.5 | Exploratory data analysis |
To account for the local variation in the distribution of assay information in respective mine sections, the mine is divided into portions to allow for the effective treatment of available information. Not all data from the historical sections of the mine were captured as part of this exercise, however; data from relatively new working areas was. RMC Zimbabwe plans to eventually capture all data, to provide a complete picture of the mine (KDM 2018).
The major sources of data used for Mineral Resource estimation were channel, and diamond drill core samples. Samples from the MSZ were top cut to a maximum value of 20 grams per tonne (g/t) Au, while samples from the Felsite were top-cut to 10 g/t Au. Top-cut values were derived from values at the 95th percentile of the respective sample populations. No re-estimation of tonnage and grade of the Mineral Resource blocks and pillars in the historical sections of the RGM was completed (KDM 2018).
| Project No PS213686 | WSP |
| Redwing Mine | January 2025 |
| S-K 1300 Technical Report Summary | Page 45 |
| Bulawayo Mining Company Limited |
| 11.1.5.1 | Geostatistical analysis |
Semivariograms in the direction of strike were prepared and used to derive estimation parameters (KDM 2018). A summary is presented in Table 11.1.
Table 11.1 Variography summary (KDM 2018)
| Section | ||||||||||||||||||||||||||||||||||||
| Kriging Parameters | Felsite | 14V Central | 10V 355 Area | 10V East | 16V East | Kent | Village North | 4L Simbi 175 | 3L Karen 027 | |||||||||||||||||||||||||||
| Number of Structures | 1 | 1 | 1 | 1 | 1 | 1 | 1 | 1 | 1 | |||||||||||||||||||||||||||
| Type of Structure | Spherical | Spherical | Spherical | Spherical | Spherical | Spherical | Spherical | Spherical | Spherical | |||||||||||||||||||||||||||
| Nugget | 1.38 | 1.27 | 0.35 | 1.00 | 0.5 | 2.00 | 1.56 | 1.35 | 1.08 | |||||||||||||||||||||||||||
| Sill Differential | 0.88 | 2.65 | 3.26 | 1.87 | 2.10 | 1.30 | 2.15 | 2.35 | 1.77 | |||||||||||||||||||||||||||
| 11.1.6 | Dry bulk density |
BD determinations were conducted in-house by the RGM assay laboratory technicians on samples collected from underground development material. Sample material was obtained from sources in both the MSZ and Felsite. The exercise initially commenced in 1997, to validate the historical figure of 2.70 t/m3 that was in use. Confirmatory re-runs were completed in 2001 and 2017, producing similar results (KDM 2018).
While the current value is considered valid and adequate, RMC Zimbabwe’s ultimate aim is to create a running database that, in addition to being a basis for the derivation of the accepted BD determination, enables some empirical monitoring of trends with orebody, lithology, or other spatial variations (KDM 2018).
| 11.1.7 | Block models |
Block models were developed parallel to the general strike of the orebody. A total of nine block models were developed.
Table 11.2 presents the block dimension schemes used for 30 June 2018 block models.
Table 11.2 Block dimension schemes for the 30 June 2018 block models (KDM 2018)
| Section | ||||||||||||||||||||||||||||||||||||
| Block Details | Felsite | 14V Central | 10V 355 Area | 10V East | 16V East | Kent | Village North | 4L Simbi 175 | 3L Karen 027 | |||||||||||||||||||||||||||
| Parent Block Dimensions | ||||||||||||||||||||||||||||||||||||
| X Block Size (m) | 10 | 7 | 8 | 8 | 7 | 5 | 5 | 5 | 5 | |||||||||||||||||||||||||||
| Y Block Size (m) | 10 | 1 | 1 | 1 | 1 | 5 | 5 | 3 | 3 | |||||||||||||||||||||||||||
| Z Block Size (m) | 10 | 7 | 8 | 8 | 7 | 5 | 5 | 10 | 15 | |||||||||||||||||||||||||||
| Sub-block Dimensions | ||||||||||||||||||||||||||||||||||||
| X Size (m) | 1 | 1 | 1 | 1 | 1 | 1 | 1 | 2.5 | 2.5 | |||||||||||||||||||||||||||
| Y Size (m) | 1 | 0.5 | 0.5 | 0.5 | 0.5 | 1 | 1 | 1.5 | 1.5 | |||||||||||||||||||||||||||
| Z Size (m) | 1 | 1 | 1 | 1 | 1 | 1 | 1 | 5 | 5 | |||||||||||||||||||||||||||
| Project No PS213686 | WSP |
| Redwing Mine | January 2025 |
| S-K 1300 Technical Report Summary | Page 46 |
| Bulawayo Mining Company Limited |
| 11.1.8 | Grade interpolation parameters |
Table 11.3 presents the kriging parameters generated from variographic analysis.
| Table 11.3 | Kriging parameters generated from variographic analysis (KDM 2018) |
| Section | ||||||||||||||||||||||||||||||||||||
| Kriging Parameter | Felsite | 14V Central | 10V 355 Area | 10V East | 16V East | Kent | Village North | 4L Simbi 175 | 3L Karen 027 | |||||||||||||||||||||||||||
| Number of Structures | 1 | 1 | 1 | 1 | 1 | 1 | 1 | 1 | 1 | |||||||||||||||||||||||||||
| Type of Structure | Spherical | Spherical | Spherical | Spherical | Spherical | Spherical | Spherical | Spherical | Spherical | |||||||||||||||||||||||||||
| Nugget | 1.38 | 1.27 | 0.35 | 1.00 | 0.5 | 2.00 | 1.56 | 1.35 | 1.08 | |||||||||||||||||||||||||||
| Sill Differential | 0.88 | 2.65 | 3.26 | 1.87 | 2.10 | 1.30 | 2.15 | 2.35 | 1.77 | |||||||||||||||||||||||||||
| Ellipsoid Range | ||||||||||||||||||||||||||||||||||||
| Major Radius (m) | 14 | 12 | 9 | 7 | 5 | 6.9 | 9.99 | 11.5 | 18 | |||||||||||||||||||||||||||
| Semi-major Radius (m) | 8 | 1 | 1 | 1 | 1 | 1.0 | 1.33 | 4 | 8 | |||||||||||||||||||||||||||
| Minor Radius (m) | 15 | 12 | 9 | 8 | 5 | 5.0 | 5.26 | 0.9 | 0.9 | |||||||||||||||||||||||||||
| Rotation about the Z-axis (bearing) [°] | 99 | 102 | 145 | 108 | 96 | 71 | 107 | 310 | 300 | |||||||||||||||||||||||||||
| Rotation about the Y-axis (plunge) [°] | 0 | 0 | 0 | 0 | 0 | -1.14 | 0 | -11 | 0 | |||||||||||||||||||||||||||
| 11.1.9 | Grade estimation |
Ordinary Kriging (OK), using the developed semi-variogram parameters was used to assign individual block grades. Mining blocks, pillars and remnants had their tonnages and grades reported as defined by the constraining triangulations, and other specific sub-divisions or demarcations of the orebody. For those sections with only sparse information, Inverse Distance Squared (ID2) estimation using variographic parameters from adjoining sections was adopted (KDM 2018).
| 11.1.10 | Model validation |
| 11.1.10.1 | Visual comparisons conducted by RMC Zimbabwe |
A visual comparison between estimated block grades, and original drill hole assay data was conducted in Vulcan™. In addition, sections were cut along and across strike to check the block model fit, and general continuity of the estimates within the pre-defined constraining envelope (the orebody wireframes) [KDM 2018].
| Project No PS213686 | WSP |
| Redwing Mine | January 2025 |
| S-K 1300 Technical Report Summary | Page 47 |
| Bulawayo Mining Company Limited |
| 11.1.10.2 | Visual comparisons conducted by WSP |
No figures of the visual comparisons were presented in KDM 2018. WSP conducted visual comparisons in Vulcan. A section, looking east, comparing the 40L 020 Bund block model grades and the drill hole assay results is presented in Figure 11.1.
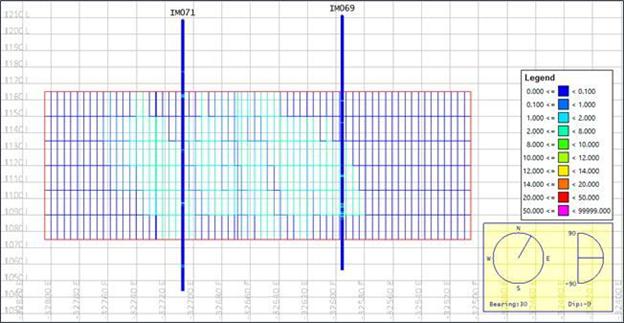
| Figure 11.1 | 40L 020 Bund block grade and drill hole comparison |
| 11.2 | Mineral Resources classification |
Classification of blocks into relevant groupings was completed following standard procedures as defined and recommended in the SAMREC (2016). The stoping pay-limit defines the lower grade cut-off that is used in the process (KDM 2018).
The COG defined for Mineral Resource blocks was 1.60 g/t Au for the MSZ, and 1.30 g/t Au for the Felsite (KDM 2018). WSP has not re-classified the mineral resource blocks.
RMC Zimbabwe undertook Mineral Resource classification for Measured, Indicated, and Inferred Mineral Resources as presented in Sections 11.2.1, to 11.2.3.
| 11.2.1 | Measured Mineral Resources |
Measured Mineral Resource blocks required close-spaced drilling from levels and block raises at 5 to 8 m intervals for Felsite, and 4 m for MSZ (where the reef is wider than development dimensions). The MSZ is otherwise channel sampled at 2 m intervals only along the drives, and in raises (KDM 2018).
The following classification criteria were applied to each mineralisation style (KDM 2018):
| 11.2.1.1 | MSZ |
| — | Developed on four sides (two drives and two connecting raises) |
| — | Developments ends adequately sampled |
| Project No PS213686 | WSP |
| Redwing Mine | January 2025 |
| S-K 1300 Technical Report Summary | Page 48 |
| Bulawayo Mining Company Limited |
| — | Sampling by diamond saw conducted along drives at 2 m intervals |
| — | Core sampled on nominal 1 m sample lengths, depending on geology and apparent mineralisation |
| — | Sub-drives that are 25 m apart sampled and raises connecting sub-levels sampled |
| — | Where shear zone is wider than development dimensions, diamond drilling (profiling) to beyond the limits of the orebody, completed at 4 m stations |
| — | Blocks bound by interpolation between development and drill core sample assay results |
| — | Tape and compass survey of drill hole collar position and direction |
| — | COG of 1.60 g/t Au (30% below the 2018 MRMR pay limit) |
| — | No allowance made for geological or pillar losses. |
| 11.2.1.2 | Felsite |
| — | Developed on at least three sides |
| — | Development ends adequately sampled |
| — | Raises mined at 25 m centres perpendicular to the strike, following hanging-wall contact of the orebody |
| — | Diamond drill stations at 5 to 8 m intervals along raises and contour drives connecting the raises, and up and/or down-dip drill holes drilled perpendicular to the Felsite body beyond the lithological contacts |
| — | Core sampled on nominal 1 m sample lengths, depending on geology and apparent mineralisation |
| — | Channel samples cut across the Felsite-width exposed in the raises and drives, in combination with drill holes, resulting in a complete sampled section across the orebody |
| — | Blocks bound by interpolation between development and drill core sample assay results |
| — | Tape and compass survey of drill hole collar position and direction |
| — | COG of 1.30 g/t Au (30% below the 2018 MRMR pay limit) |
| — | No allowance made for geological or pillar losses. |
| 11.2.2 | Indicated Mineral Resources |
Indicated Mineral Resource blocks required wide-spaced core drilling on a nominal grid pattern with mineralised zone strike limits defined by projected geological boundaries, where no drill information is available.
The following classification criteria were applied to each mineralisation style (KDM 2018):
| 11.2.2.1 | MSZ |
| — | Developed and sampled on at least one development drive and falls within projected geological boundaries of a mineralised zone, with limits extending to no more than 20 m up and down-dip of the developed end |
| — | Extensions to existing blocks or to blocks being mined or mined out, where geological continuity is confirmed are also considered to be sufficient |
| — | Polygonal estimation method on drill hole intersections spaced not more than 50 m apart |
| Project No PS213686 | WSP |
| Redwing Mine | January 2025 |
| S-K 1300 Technical Report Summary | Page 49 |
| Bulawayo Mining Company Limited |
| — | Surveying of drill holes limited to collar only |
| — | Block boundaries not more than 25 m beyond the pierce point on strike and dip, but within projected geological boundaries |
| — | COG of 1.60 g/t Au (30% below the 2018 MRMR pay limit) |
| — | No allowance made for geological or pillar losses. |
| 11.2.2.2 | Felsite |
| — | Developed and sampled on at least one development drive and falls within projected geological boundaries of a mineralised zone, with limits extending to no more than 50 m up and down-dip of the developed end |
| — | Extensions to existing blocks or to blocks being mined or mined out, where geological continuity is confirmed are also considered to be sufficient |
| — | Polygonal estimation method on drill hole intersections spaced not more than 100 m apart |
| — | Surveying of drill holes limited to collar only |
| — | Block boundaries not more than 50 m beyond the pierce point on strike and dip, but within projected geological boundaries |
| — | Vertical and inclined drill holes drilled at a nominal 100 m spacing along strike |
| — | COG of 1.30 g/t Au (30% below the 2018 MRMR pay limit) |
| — | No allowance made for geological or pillar losses. |
| 11.2.3 | Inferred Mineral Resources |
Indicated Mineral Resource blocks constituted drill core intersection or projection beyond an Indicated Mineral Resource block, where continuity is assumed but not verified.
The following classification criteria were applied to each mineralisation style (KDM 2018):
| 11.2.3.1 | MSZ |
| — | Polygonal estimation method on drill hole intersections spaced not more than 100 m apart |
| — | Projections on dip or strike in areas adjacent to an Indicated Mineral Resource block but falling within defined geological boundaries |
| — | Block grade based on drill hole intersections or projection from adjacent blocks falling within defined geological boundaries. |
| 11.2.3.2 | Felsite |
| — | Polygonal estimation method on drill hole intersections spaced not more than 100 m apart |
| — | Projections on dip or strike in areas adjacent to an Indicated Mineral Resource block but falling within defined geological boundaries |
| — | Block grade based on drill hole intersections or projection from adjacent blocks falling within defined geological boundaries. |
| 11.3 | Cut-off grade, price, and justification |
A new COG for 2023 was calculated based on the three-year trailing average gold price at December 2023 (with a gold price multiplier of 30%), applicable mill recovery, and revised operating and sustaining capital costs.
| Project No PS213686 | WSP |
| Redwing Mine | January 2025 |
| S-K 1300 Technical Report Summary | Page 50 |
| Bulawayo Mining Company Limited |
Table 11.4 presents the parameters applied for definition of the 31 December 2023 Mineral Resource on an in-situ basis.
Table 11.4 31 December 2023 COG estimation parameters
| Run of Mine (ROM) | ||||||||
| Parameter | Felsite | MSZ | Combined | Comment | ||||
| COG (g/t Au) | 1.06 | 1.53 | 1.26 | Estimated based on the Au +30% price, applicable mill recovery, operating and sustaining capital costs. | ||||
| Residues (g/t Au) | 0.40 | 0.40 | 0.40 | Average process recovery of 90 % based on the average MI Mineral Resource grade of 3.83 g/t | ||||
| Direct Operating Cost (C1) [US$/t] | 49.32/t | 85.28/t | 64.64/t | 2023 value terms | ||||
| Indirect Operating Cost (US$/t) | 7.39/t | 7.39/t | 7.39/t | Long term average at December 2023 | ||||
| Sustaining Capital Cost (US$/t) | 10.53/t | 10.53/t | 10.53/t | Long term average at December 2023 | ||||
| Exchange Rate | N/A | |||||||
| Tonnage (t) | 9,032 | 6,701 | 15,733 | Estimated throughput for fixed and variable cost components | ||||
| Assay Plan Factor (APF) [%] | 82.9 | 82.9 | 82.9 | N/A | ||||
| Block Factor (BF) [%] | 100 | 100 | 100 | N/A | ||||
| Au Price (US$/oz) | 1,800 | Pricing based on the 3-year trailing average Au price | ||||||
| Au Price +30% (US$/oz) | 2,340 | 30% uplift on the 3-year trailing average Au price | ||||||
Notes: Applied COGs are based on a marginal cost analysis assuming direct operating costs only.
11.3.1 Tonnage-grade factors
The pay limit estimation parameters presented in Table 11.4 are explained as follows:
11.3.1.1 Assay plan factor
An APF of 82.9% was estimated based on 3 year trailing monthly average estimates for the period through to August 2018 when the operation was placed on care and maintenance. This factor is the equivalent of the Mine Call Factor (MCF) and refers to the gold content and not grade as such and is defined as the relationship between gold accounted for (bullion plus residue at the Plant) versus gold “called for” by the mine’s measuring and evaluation methods. This factor was used in the pay limit calculation and was applied to the grade only (Golder 2021).
APF = Mineral content accounted for from ore treated (recovery + residue) x 100% / Mineral content called for based on current sampling
WSP review called into question the reliability of data supporting APF estimates for Redwing given poor production performance due to power outage, equipment and consumables restrictions for the period 2015-18, such that a 100% factor was ultimately assumed for definition of COGs and Mineral Resources.
11.3.1.2 Block factor
The Block Factor (BF) is defined as the ratio, expressed as a percentage, where the specific mineral content of the ore broken from a Mineral Reserve block as indicated by current sampling results is compared to the estimated Mineral Reserve block content (Golder 2021). A BF of 100% was assumed due to the lack of reliable data for the last three years.
BF = Current sampling contents x 100% / Estimated block contents
11.3.1.3 Block call factor
The Block Call Factor (BCF) was calculated from the APF and BF. This factor refers to gold content and not grade and is defined as the total specific mineral content of the ore broken from a Mineral Reserve block as indicated by the current sampling results adjusted by the APF versus the estimated Mineral Reserve block content (gold content called for). This factor was applied to the grade only (Golder 2021).
BCF = BF x APF x 100% (by block)
| Project No PS213686 | WSP |
| Redwing Mine | January 2025 |
| S-K 1300 Technical Report Summary | Page 51 |
| Bulawayo Mining Company Limited |
11.3.1.4 Mine Call Factor
A Mine Call Factor (MCF) of 82.9% was calculated for Redwing mine as an average for all mining blocks blocks based on 3 year trailing monthly average data excluding +10% outliers and non-production months, whereby:
MCF = BF x APF x 100% (all blocks)
On review, WSP adopted an MCF of 100% due to data unreliability.
11.3.1.5 Extraction ratio
An Extraction Ratio (ER) of 95% was applied for the MSZ and 85% for felsite mineralisation to account for ore locked up in pillars and for ore losses in the stopes (broken but no recovered) (Golder 2021).
11.3.1.6 Dilution
A dilution factor has been applied generally based on the orebody dip where wider, steeper orebodies are accorded a lower level of dilution, applied by reef as follows:
| — | 10% at 0.0 g/t Au: for Felsite orebodies. |
| — | 15% at 0.0 g/t Au: for steeply dipping Rezende, Karen, 175 Simbi, 4 Level 345 Area, and Village North reef. |
| — | 20% at 0.0 g/t Au: for narrow reefs on Bromley, Doorstep, Kent, and Tyler sections. |
11.3.2 Cut-off Grade
The COG is calculated using the following formula:
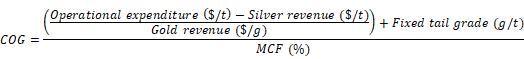
WSP inspected recent reconciliation factors for Redwing where a BF was not estimated (assumed 100%) and where the APF was significantly impacted by poor recent year operational performance (2015-18). Therefore, for the purpose of definition of Mineral Resources, WSP took the decision to leave the MCF for Redwing at 100% rather than 83%. This was also influenced by inspection of the historical process recovery that indicated an average 90% compared to a fixed tail adopted in the COG calculation, equivalent to 72% - 79% recovery. It should also be noted that the MCF is influenced by the mining method, selectivity and efficiency of mining. WSP took the view that any future planned extraction of the resource will deliver better planned outcomes.
| 11.4 | Mineral Resources statement |
The basis of the Property’s Mineral Resources estimate and how it is generated are summarised below. The Mineral Resources estimate for the Property is reported herein in accordance with the requirements detailed in S-K 1300. For estimating the Mineral Resources, the following definition of Mineral Resource as set forth in S-K 1300 is applied:
“Mineral resource is a concentration or occurrence of material of economic interest in or on the Earth’s crust in such form, grade or quality, and quantity that there are reasonable prospects for economic extraction. A mineral resource is a reasonable estimate of mineralisation, taking into account relevant factors such as cut-off grade, likely mining dimensions, location or continuity, that, with the assumed and justifiable technical and economic conditions, is likely to, in whole or in part, become economically extractable. It is not merely an inventory of all mineralisation drilled or sampled.”
| Project No PS213686 | WSP |
| Redwing Mine | January 2025 |
| S-K 1300 Technical Report Summary | Page 52 |
| Bulawayo Mining Company Limited |
A new COG for 2023 was calculated, as detailed in Section 11.3.
The Mineral Resources estimates (exclusive of Mineral Reserves) for the Property are presented in Table 11.5 and Table 11.6.
The effective date of the Mineral Resources estimates is 31 December 2023.
The underground Mineral Resource comprises:
| — | 9.65 Mt at 3.83 g/t Au, for approximately 1,188 koz of gold (underground Measured and Indicated Mineral Resources). |
| — | 15.83 Mt at 2.61 g/t Au, for approximately 1,328 koz of gold (underground Inferred Mineral Resources). |
Table 11.5 presents the underground Measured and Indicated Mineral Resources (exclusive of Mineral Reserves) reported as at 31 December 2023 on an in-situ basis.
| Table 11.5 | RGM underground Mineral Resource estimate as of 31 December 2023 |
| Category | Tonnage (Mt) | Au Grade (g/t) | Au Metal (koz) | |||||||||
| Underground | ||||||||||||
| Measured Resources | 1.45 | 2.92 | 136 | |||||||||
| Indicated Resources | 8.20 | 3.99 | 1,052 | |||||||||
| Grand Total | 9.65 | 3.83 | 1,188 | |||||||||
Notes: Mt = million tonnes; Au = gold; g/t = grams per tonne; koz = thousand ounces.
Table 11.6 presents the underground Inferred Mineral Resources reported as at 31 December 2023 on an in-situ basis.
| Table 11.6 | RGM underground Inferred Mineral Resource estimate as of 31 December 2023 |
| Category | Tonnage (Mt) | Au Grade (g/t) | Au Metal (koz) | |||||||||
| Underground | ||||||||||||
| Inferred Resources | 15.83 | 2.61 | 1,328 | |||||||||
| Grand Total | 15.83 | 2.61 | 1,328 | |||||||||
Notes: Mt = million tonnes; Au = gold; g/t = grams per tonne; koz = thousand ounces.
It should be noted that the underground Mineral Resources estimate for the Property is reported exclusive of Mineral Reserves. The Property does not have a current Mineral Reserve. For more details the reader is referred to Section 5.6.
It should be noted that the sands (tailings) Mineral Resources estimate for the Property is not included as part of the Mineral Resources for the Property, as the RGM does not currently possess a processing facility capable of processing the sands (tailings) material.
The Mineral Resources presented in this Section are not Mineral Reserves, and do not reflect demonstrated economic viability. The reported Inferred Mineral Resources are considered too speculative geologically to have the economic considerations applied to them that would enable them to be categorised as Mineral Reserves. There is no certainty that all or any part of this Mineral Resource will be converted into Mineral Reserve.
All figures are rounded to reflect the relative accuracy of the estimates and totals may not add correctly.
| Project No PS213686 | WSP |
| Redwing Mine | January 2025 |
| S-K 1300 Technical Report Summary | Page 53 |
| Bulawayo Mining Company Limited |
Based on the geological results presented in this TRS, supported by the assumptions made by RMC Zimbabwe (presented in Section 11.3), it is the QP’s opinion that the Mineral Resources have RPEE.
Further exploration, and technical studies are required to confirm the economic feasibility of the Property, and to allow the estimation and reporting of a Mineral Reserve.
| 11.5 | Uncertainty in the estimates of Inferred, Indicated, and Measured Mineral Resources |
The QP is satisfied that the stated Mineral Resources classification reflects the appropriate level of confidence and considers those factors relevant to the deposit. The application of resource categories appropriately considers the relevant factors used in the classification process.
Some examples of specific factors that can influence the risk and uncertainty of the Mineral Resources estimates that are considered in the resource classification include:
| — | Interpretation of the mineralisation boundary. |
| — | Drill hole spacing and adequacy in defining geology, mineralisation, structure, and grade. |
| — | Quality of samples, assays, and geological information. |
| — | The Mineral Resource estimation has only been subjected to visual validation. Standard industry practice is to conduct both visual and statistical validation. |
| — | The COG used for Mineral Resource classification (1.30 g/t Au for Felsite ore, and 1.60 g/t Au for MSZ ore) seem reasonable on face value, however; the methodology used for determination of these values has not been clearly reported by RMC Zimbabwe and requires further explanation. |
| — | The nominal estimates for ER are presumably based on historical experience. WSP recommends maintaining a detailed stope file, and accounting for ER (and APF, BF, BCF) on a stope-by-stope basis. This approach may provide a more targeted application based on stoping area, method, orebody disposition and ground conditions. |
| — | WSP recommends reviewing on an individual stope performance basis to test and vary the relatively nominal assumptions. This could include modelling of dilution skins and using block model grades. |
| — | The Mineral Resources estimates have been estimated to two decimal places for gold grade, and to the nearest tonne for tonnage, but have been reported to one decimal place for gold grade, to the neatest ounce for metal content, and to the nearest thousand tonnes for tonnage when reported in summary tables in the Mineral Resources Mineral Reserves (MRMR) technical report (KDM 2018). |
| — | The Mineral Resource estimation has only been subjected to visual validation by RMC Zimbabwe staff. Standard industry practice is to conduct both visual, and statistical validation. |
The Mineral Resources have addressed RPEE, and have considered a mining, metallurgical, and environmental factors.
Mineral Resources confidence is also assessed via independent reviews and internal peer reviews conducted at key stages of the Mineral Resources estimation process.
The Mineral Resources presented are not Mineral Reserves, and do not reflect demonstrated economic viability. The level of geological uncertainty associated with the reported Inferred Mineral Resources is considered too speculative to apply relevant economic, and technical factors to have the economic considerations applied that would enable these to be categorised as Mineral Reserves. There is no certainty that all or any part of the Inferred Mineral Resources will be converted into Mineral Reserves. All figures are rounded to reflect the relative accuracy of the estimates and totals may not sum exactly as a consequence.
| Project No PS213686 | WSP |
| Redwing Mine | January 2025 |
| S-K 1300 Technical Report Summary | Page 54 |
| Bulawayo Mining Company Limited |
| 11.6 | QP’s opinion on factors likely to influence the prospect of economic extraction |
The main factors likely to influence the prospect of economic extraction include:
| — | Orebody definition. |
| — | Assigned dry bulk density. |
| — | Unconstrained estimate. |
| — | Commodity pricing. |
| — | Interpretations of fault geometries. |
| — | Underground geotechnical conditions. |
| — | Dilution considerations. |
| — | Underground dewatering requirements. |
The estimate of Mineral Resources may be materially affected by environmental, permitting, legal, title, socio-political, marketing, or other relevant issues including risks set forth in this TRS.
In the QP’s opinion, all of these factors are adequately considered for the Mineral Resources reported. Based on the body of technical studies completed across the Property, it is the QP’s opinion that the Mineral Resources have RPEE.
In the QP’s opinion, all issues relating to all relevant technical and economic factors likely to influence the prospects for economic extraction, can be resolved with the recommendations for further work outlined in Section 23.1.
| 12 | Mineral Reserves estimates |
Not applicable since this TRS is an Initial Assessment and no Mineral Reserves have been estimated.
Any future estimation of Mineral Reserves and potential recommencement of operations will require the support of an additional drilling and resource definition campaign and at least a pre-feasibility to feasibility level of evaluation.
| Project No PS213686 | WSP |
| Redwing Mine | January 2025 |
| S-K 1300 Technical Report Summary | Page 55 |
| Bulawayo Mining Company Limited |
| 13 | Mining methods |
This section is included to inform an Initial Assessment for the estimation of Mineral Resources.
| 13.1 | Introduction |
Three mining methods are applied at RGM depending on the nature of the orebody and the rock mechanics considerations. The geometry of each stoping block in terms of dip and width and the nature of the mineralisation largely determines the mining method:
| — | Up-Dip Room and Pillar: For stoping of the wide and shallow dipping (+35°) felsite. |
| — | Long Hole Open Stope: Used for the steeply dipping Rezende and Village North reefs (+70° and 65°) respectively. As conditions warrant, used in combination with the underhand mining method. |
| — | Underhand Mining Method: Used for the narrow, steeply dipping Bromley and Kent reefs. |
The mine formerly operated as a rail mine serviced by vertical and underlay (inclined shafts). Level development headings are of relatively small dimension of approximately 2 mW x 2 mH installed on approximately 100 foot (30 m) intervals. The mine is pneumatic powered with rail haulage via lead acid battery powered locomotives hauling rail cars to a shaft where it is hoisted to surface. Mining is conducted using conventional drilling and blasting techniques using handheld jackhammer machines. Minimal support is used, and explosives are manually initiated. Larger long hole stoping and underhand benching has employed larger pneumatic drill rigs secured by bar and arm.
There is no backfill used for stope support apart from opportunistic disposal of development waste.
Further options for mechanising the method to improve productivity could be considered, including alternate decline access and extraction.
| 13.2 | Parameters relative to the design and schedule |
| 13.2.1 | Geotechnical |
SRK conducted a geotechnical and rock engineering review at RGM in 2004.The key findings were listed:
| — | It is recommended to enhanced regular geological mapping of primary development and interrogation of borehole information to obtain better understanding of the rock mass conditions and potential response in mining. |
| — | 20 m maximum stope span be adopted in Felsite and Mineralised Quartz Shear Zone orebody. |
| — | 35 m mining spans be adopted in the Felsite orebody |
| — | Further work should be done to determine the most applicable mining method thru workshop of various mining methods with discussion of their advantages and disadvantages. |
An updated study was conducted still by SRK in 2016 revealing the following key findings:
| — | Previous assessments indicated the rock mass quality ranged from good to fair. However, SRK’s on-site evaluation found varying rock quality, ranging from good to poor. Shallow depth areas are particularly susceptible to deterioration due to weathering and water presence. |
| — | Tunnels generally do not require support for stability, except at intersections with geological features like faults and reef junctions, where support is necessary to maintain stability. |
| — | Stope stability assessments highlighted the need for roof support specifically in areas containing Felsite and Mineralised Quartz reefs. |
| Project No PS213686 | WSP |
| Redwing Mine | January 2025 |
| S-K 1300 Technical Report Summary | Page 56 |
| Bulawayo Mining Company Limited |
The current stope design is acceptable and can be applied at shallow depths. The mining layout comprises the following dimensions:
| — | Rib pillar width of 5 m for the Felsite ore body, |
| — | Sill pillar width of 10 m for the Felsite ore body, |
| — | Rib pillar width of 3 m for the mineralised quartz shear zone, |
| — | Sill pillar width of 10 m for the Mineralised quartz shear zone, |
| — | Dip span of 100 m between sill pillars for both ore bodies, |
| — | Strike span 20 m between rib pillars for both ore bodies. |
Earlier studies relating to pillar design:
| — | Budavari S. July 1991. Some rock mechanics problems experienced at Rezende Mine. University of Witwaterrsrand. Prepared for Independence Mining (PVT) Limited. |
| — | Un-named. November 1991. Rock mechanics investigation: Old West and Redwing Mines. Report No. RW7. |
| 13.2.2 | Hydrogeological |
Based on historical data, Redwing Mine is categorised as relatively wet, necessitating a robust dewatering system to manage both drilling water and groundwater. It is expected that the existing dewatering infrastructure, designed to handle flooded areas, will suffice to address future natural water inflows and drilling water. Most of the water during increased production levels will stem from drilling activities and groundwater from underground aquifers.
Supplementary to stage pumps, submersible spindle pumps will be utilised to drain the shaft bottom, diverting excess water to higher-level sumps. Much of the planned underground mine infrastructure for the proposed production increase is currently submerged, highlighting the critical need for dewatering down to the 18th level. It is estimated that this dewatering process will span approximately 2 years to remove 3.6 million cubic meters of water. This program entails procuring additional dewatering pumps to supplement the existing ones. The dewatering phase will facilitate further exploration of upper-level resources and pave the way for the commencement of production in the upper levels within a 24-month timeframe.
The mine was flooded to the 7 level prior to closure in 2019, and this means that 71% of the resource is currently unavailable due to flooding. The declared resources indicate that the majority lie below 6 level and thus giving only 29% lying above 6 level. The water is currently being pumped at 10,000 cubic metres per month and thus giving a gain of 0.2 m per month.
The mine is currently flooded to approximately 50 m below surface and will require a significant program of mine dewatering to recover access to workings.
| 13.3 | Production parameters |
| 13.3.1 | Production rates |
Production rates for the purpose of an initial assessment have been drawn from a history of previous operation and the QP’s assessment of what is technically achievable. This has considered production ramping up from an average production rate of 30 kt per annum to 1,200 kt per annum.
| 13.3.2 | Expected mine life |
Using the production rate mentioned above, the initial assessment has considered a potential mine life of 18 years.
| Project No PS213686 | WSP |
| Redwing Mine | January 2025 |
| S-K 1300 Technical Report Summary | Page 57 |
| Bulawayo Mining Company Limited |
| 13.3.3 | Mining model |
RGM is in the process of changing from manual reserve estimation techniques to CAD methods using block models. The manual method involves using average stope widths diluted from the minimum mining width multiplied by the plan area of stoping to determine stope volumes and tonnages. Grades are determined by taking a weighted average of local stope and development grades and mineralisation widths and diluting this out to the average stope width. This method is being replaced by the introduction of resource block modelling techniques, interrogated using mineralisation and stope design wireframes.
RGM applies a standard minimum stope width of 90 cm for the purpose of defining stope envelopes for estimating the Mineral Reserve; however, it is evident that the mining width accepted in practice can be considerably wider than the minimum as evidenced by the escalation in BF (hoist versus break) compared to APF (reconciled mill feed versus hoist) (Table 13.1).
| Table 13.1 | Block call factors 2012–2018 (RGM Operations Reports) |
| Au (g) | BCF | |||||||||||||||||||
| Year | Depleted | Broken | BF (%) | APF (%) | APF x BF (%) | |||||||||||||||
| 2012 | 0 | 0 | 0.0 | 0.0 | 0.0 | |||||||||||||||
| 2013 | 0 | 0 | 0.0 | 0.0 | 0.0 | |||||||||||||||
| 2014 | 2,599 | 4,565 | 175.6 | 92.4 | 162.2 | |||||||||||||||
| 2015 | 3,286 | 7,396 | 225.1 | 86.6 | 194.9 | |||||||||||||||
| 2016 | 92,684 | 139,208 | 150.2 | 93.9 | 141.0 | |||||||||||||||
| 2017 | 289,318 | 520,860 | 180.0 | 89.3 | 160.8 | |||||||||||||||
| 2018 | 129,721 | 288,108 | 222.1 | 58.9 | 130.8 | |||||||||||||||
| TOTAL | 517,607 | 960,137 | 185.5 | 82.5 | 153.1 | |||||||||||||||
While there is always a balance to be struck between sufficient width to optimise productivity and minimum width to optimise for low dilution, the object being to optimise metal delivery at minimum cost, WSP recommends reviewing the approach based on the most recent data.
| 13.3.4 | Mining dilution and recovery factors |
A dilution factor has been applied generally based on the orebody dip where wider, steeper orebodies are accorded a lower level of dilution, applied by reef as follows:
| — | 10% at 0.0 g/t Au: for Felsite orebodies. |
| — | 15% at 0.0 g/t Au: for steeply dipping Rezende, Karen, 175 Simbi, 4 Level 345 Area, and Village North reef. |
| — | 20% at 0.0 g/t Au: for narrow reefs on Bromley, Doorstep, Kent and Tyler sections. |
WSP again recommends reviewing on an individual stope performance basis to test and vary the relatively nominal assumptions. This could include modelling of dilution skins and using block model grades.
Further grade factors are applied as a block call factor on grade from reconciliation on a six monthly basis, while global mining recovery factors are applied as an extraction ratio in the following fashion:
Assay Plan Factor (APF):
An APF of 82.9% was applied using FY2015 to June 2018 production performance:
APF = Mineral content accounted for from
ore worked (recovery + residue) x 100%
Mineral content called for based on current sampling
| Project No PS213686 | WSP |
| Redwing Mine | January 2025 |
| S-K 1300 Technical Report Summary | Page 58 |
| Bulawayo Mining Company Limited |
Block Factor (BF):
RGM advise that a BF of 100% was accepted for use in defining the Mineral Resource but that this was not applied for conversion of Mineral Resource to Mineral Reserve. Calculated according to:
BF = Current sampling contents x 100%
Estimated block contents
Further explanation is required to substantiate the use of a BF of 100% when the average estimate for 2014-2018 is 185.5%.
Block Call Factor (BCF)
This is simply a call factor calculated by multiplying APF by BF and was assumed at 100% for conversion of the Mineral Resource to Mineral Reserve. Again, it is not clear nor adequately explained as to why this factor effectively excludes both the APF and BF for the purpose of conversion of resources to reserves. Inspection of block model estimation listings indicate that an APF of 83% and BF of 100% was applied in practice.
Extraction Ratio (ER)
An extraction ratio of 95% was applied for the MSZ and 85% for felsite mineralisation to account for ore locked up in pillars and for ore losses in the stopes (broken but no recovered).
These nominal estimates are presumably based on historical experience. WSP recommends maintaining a detailed stope file and accounting for ER (and APF, BF, BCF) on a stope-by-stope basis. This approach may provide a more targeted application based on stoping area, method, orebody disposition and ground conditions.
| 13.4 | Mining fleet, machinery, and personnel requirements |
The current labour complement at RGM stands at 263 employees for the Care and Maintenance operations working 8 hours per day on two weeks on, two weeks off roster. Dayshift operations comprise Security (55), Process (40), Engineering (17), Mining (Pit Safety, 11), Safety & Environment (3) and Management & Survey (3).
A conceptual plan to recommence operations envisages a total labour workforce of 727, increasing to 872 as production ramps up from 150 ktpa to 1,285 ktpa. Three 8 hour shifts per day are planned.
A current capital equipment list detailing mining and process plant was not provided.
| 13.5 | Scheduling results |
This TRS is an initial assessment for the purpose of estimating Mineral Resources for which mining schedules supported by at least a pre-feasibility or feasibility study have not been prepared.
| Project No PS213686 | WSP |
| Redwing Mine | January 2025 |
| S-K 1300 Technical Report Summary | Page 59 |
| Bulawayo Mining Company Limited |
| 13.6 | Mining unit dimensions |
The mining layout comprises the following dimensions applied at shallow depths:
| — | Rib pillar width of 5 m for the Felsite orebody. |
| — | Sill pillar width of 10 m for the Felsite orebody. |
| — | Rib pillar width of 3 m for the mineralised quartz shear zone. |
| — | Sill pillar width of 10 m for the Mineralised quartz shear zone. |
| — | Dip span of 100 m between sill pillars for both orebodies. |
| — | Strike span 20 m between rib pillars for both orebodies. |
Table 13.2 presents the preliminary mining design parameters.
| Table 13.2 | Preliminary mining design parameters |
| Item | Description | Parameter | ||||
| Dimensions | Mining Width/Height | 2.0 m | ||||
| Room width (Function of Ground Conditions to be confirmed by geotechnical studies) | 7.0 m | Standard | ||||
| 15.0 m | Full Panel |
| 13.7 | Mine layout |
The RGM infrastructure comprises underground workings with headgear hoisting facilities, a processing plant, workshops, on-site assay laboratory and TSF. The general mine layout of the mine is presented in Figure 13.1.
Redwing Shaft is a rectangular shaft with dimensions of 5.0 m x 1.8 m and is used solely for ore hoisting. The shaft is equipped with two 4 t skips and a double drum winder. The temporary loading station for the skips is on the 6 Level.
Old West No2 Shaft, located to the east of the Redwing Shaft is the Old West No.2 Shaft, which is proposed in Virimai (2018) to be up graded to a hoisting shaft to compliment the tonnage going through the Redwing Shaft. The shaft currently extends to the 10 Level and has dimensions of 4.0 m x 1.75 m. The Old West No.2 Shaft is a three-compartment shaft. For the proposed five-year strategy, the shaft will need to be equipped with a double drum winder with two x 2 t skips hoisting from the 10 Level to surface. On surface, ore can be transported by trucks to the processing plant stockpile (Virimai 2018).
| Project No PS213686 | WSP |
| Redwing Mine | January 2025 |
| S-K 1300 Technical Report Summary | Page 60 |
| Bulawayo Mining Company Limited |
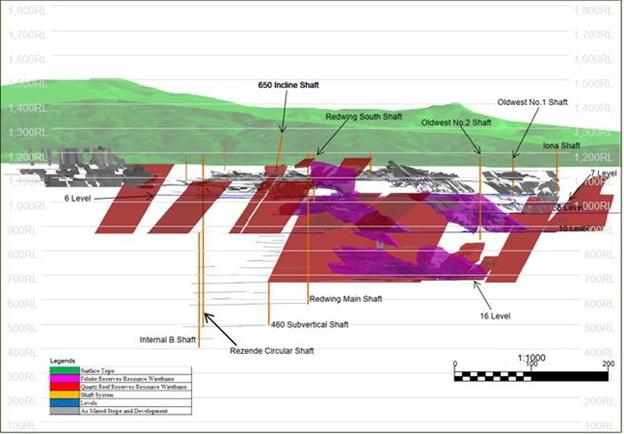
| Figure 13.1 | RGM mine layout looking south |
| 14 | Processing and recovery methods |
This section is included to inform an Initial Assessment for the estimation of Mineral Resources.
| 14.1 | Processing methodologies and flowsheets |
Ore processing involves treatment in stages comprising crushing, milling, gravity separation, flotation, Merril-Crowe Process, CIP, and elution. Gold-silver precipitates are smelted to produce buttons, which are then remelted and cast into bullion ingots. Monthly tailings deposition to the TSF is around 25 thousand tonnes per month (ktpm), which is nearing capacity (2019). Figure 14.1 presents the RGM processing flowsheet.
Virimai (2018) outlines a five-year strategy for RGM, aiming to ramp up production to 200 ktpm within two years upon resuming mining operations. This figure was chosen to achieve a Life of Mine (LOM) of around 10 years.
| Project No PS213686 | WSP |
| Redwing Mine | January 2025 |
| S-K 1300 Technical Report Summary | Page 61 |
| Bulawayo Mining Company Limited |
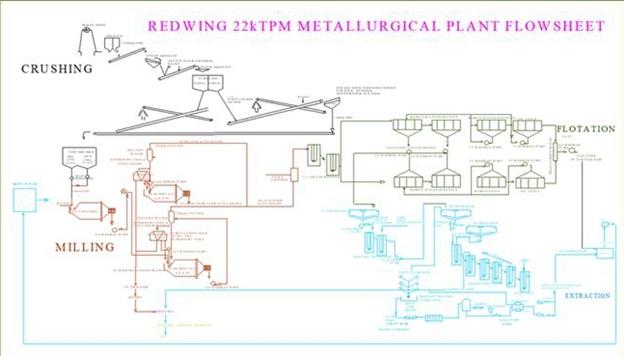
| Figure 14.1 | RGM processing flowsheet (Virimai, 2018) |
| 14.2 | Processing plant throughput and characteristics |
Crushing, milling, gravity, and flotation concentration processes, followed by cyanide hydrometallurgical operations and smelting are employed at the RGM to recover gold, with silver as a by-product. The processing plant has a capacity of up to 22 ktpm. Residue grades have typically been between 0.21 g/t Au (100% felsite ore) and 0.40 g/t Au (100% mineralised shear zone ore) [KDM 2018].
| Project No PS213686 | WSP |
| Redwing Mine | January 2025 |
| S-K 1300 Technical Report Summary | Page 62 |
| Bulawayo Mining Company Limited |
| 14.3 | Primary and secondary crushing |
| 14.3.1 | Primary crushing |
Minus 200 mm (run of mine) ore is reduced to minus 65 mm through a single stage open circuit crushing process employing one 14’’x 24’’ single toggle jaw crusher. The product is screened into minus 40 mm and plus 40 mm size fractions before secondary crushing.
| 14.3.2 | Secondary crushing |
A 41/4 short head Symons crusher operates close circuit with 5’ x 12’ and 4’ x 10’ DD screens respectively to produce a minus 14mm product for primary milling.
| 14.4 | Downhill conveying |
Two conveyors run from fine ore storage bins over Ramsey Series 30 belt weightometers to a belt feeding an 8’ x 12’ rod mill. The primary mill feeds two 6’6’’ x 20’ regrind mills operating in parallel.
| 14.5 | Product sampling |
Mill Feed sample for accounting purposes is collected from the Rod-mill feed conveyor at 15-minute intervals. Currently the rod mill is down, and belt cut sampling is done for plant mill feed grade. A sample is cut every 30 minutes, and a composite sample created every 4 hours. The composite sample is the sent to the assay laboratory for analysis.
| 14.6 | Product stockyard |
No data relevant to this section.
| 14.7 | Offshore tertiary crushing and screening |
No data relevant to this section.
| 14.8 | Energy and water process materials requirements |
| 14.8.1 | Mine power supply |
Power at RGM is sourced from the Zimbabwe Electricity Transmission and Distribution Company (ZETDC) via a 33 kV network encompassing five substations: Redwing, Rezende, Old West, Old West Plant, and Cyanide. The voltage is stepped down to 2.2 kV, 550V, or 380V for distribution. While power supply is generally reliable, it may experience fluctuations during the rainy season. The Redwing substation, serving as the primary source, transforms incoming power from 33 kV to 2.2 kV and 550 V. Two transformers, 3 MVA and 2 MVA, cater to the processing, compressors, and underground machinery. Additionally, two 500 kVA transformers power various facilities, including the crushing plant, milling, flotation plant, and administrative offices.
| Project No PS213686 | WSP |
| Redwing Mine | January 2025 |
| S-K 1300 Technical Report Summary | Page 63 |
| Bulawayo Mining Company Limited |
| 14.8.2 | Mine water management system |
Dewatering requirements for the underground mine are significant and utilised for process requirements in addition to recirculation from the TSF.
Underground water is pumped out of the mine by way of two shafts, namely the Redwing Main Shaft and the Rezende Shaft. A total of 11,200 m3 of water can be pumped per day, depending on availability of power. The Rezende Franklin pump delivers 150 m3/hour at a head of 200 m. The targeted volume per day is 12,000 m3. The current dewatering system consists of four pumps, two Franklin pumps, one Ritz pump and one WKLn 125 pump. The two Franklin pumps pump directly to the surface, whilst the Ritz pump stage pumps to a dam, which the WKLn 125 pump then pumps to surface (RGM Operations Reports).
| 14.9 | QP’s opinion |
The existing process plant for underground ore is in poor condition and utilises old process technology and equipment. It will require re-evaluation of the merits of upgrade or replacement prior to restart of operations.
The mine appears to lack a capital equipment inventory for the C&M operation which will require reconciliation as part of valuation and future feasibility assessment.
| 15 | Infrastructure |
This section is included to inform an Initial Assessment for the estimation of Mineral Resources.
| 15.1 | Rail access |
No rail access to the RGM.
| 15.2 | Port access |
No port access to the RGM.
| 15.3 | Roads |
The mine is linked to major commercial centres by a well-established network of primary asphalt roads and is accessible from the surrounding communities through secondary gravel roads. See Figure 3.1 and Figure 3.2.
| 15.4 | Camp |
Housing/camp mentioned in Section 15.7.
| 15.5 | Tailings |
Tailings pulp from the plant consists of run-of-mine and sands streams, along with CIP feed thickener overflows. This pulp undergoes dewatering in a tailings thickener to approximately 48–50% solids before being pumped via a system of three identical pumping banks to a disposal site (Dam 5) located 2 km away. CIP plant tailings are pumped overland to the tailings dam, with return water collected for reuse. Cyanide and soluble arsenic levels are monitored, with neutralization chemicals available for emergencies. Thickener overflow supplements water at the reclamation site, while Dam 5 penstock water is recycled for plant use.
| Project No PS213686 | WSP |
| Redwing Mine | January 2025 |
| S-K 1300 Technical Report Summary | Page 64 |
| Bulawayo Mining Company Limited |
| 15.6 | Potable water and wastewater |
RGM treats its own portable water and rations it to households, with availability from 06:00 to 16:00 and 17:00 to 06:00 for efficiency, not due to inadequacy. Housing units are provided with communal toilets in one-roomed sections of High-Density Villages (HDV) and individual toilets and bathrooms in other areas of HDV and Low-Density Villages (LDV).
Water for mining and processing is pumped from underground, while domestic water comes from Mountain Home Dam via a canal to the RGM water treatment plant. Water from the Mutare River is diverted to the treatment plant, settled in two 212 m3 tanks with aluminium sulphate, filtered through three sand filter tanks, chlorinated, and stored in a 212 m3 fresh water holding tank before distribution. Temporary treatment is undertaken in Tanks 1, 2, and 3 during maintenance.
Water is distributed through 6-inch and 4-inch lines to various areas including the RGM village, clinic, workshops, administration offices, compressors, and LDV houses. A separate 4-inch line serves Liverpool HDV before branching into a 3-inch line for Rezende houses. The processing capacity is 95 m3/hour.
| 15.7 | Accommodation and offices |
RGM acknowledges the importance of providing decent housing, in line with United Nations recognition of housing as a human need and right. Currently, the mine employs 263 workers and maintains a total of 1,143 housing units. These units vary in size and include single-roomed, 3-roomed, 4-roomed, and 6-roomed units in the High-Density Village, as well as 3-bedroom and 4-bedroom houses in the Low-Density Village. Additionally, the mine offers guest houses on-site and houses in the Low-Density area of Mutare to accommodate middle management employees.
| 15.8 | Non process infrastructure |
No data relevant to this section.
| 15.9 | Information and communications technology (ICT) systems |
Site inspection revealed that phone and internet services are available onsite.
| 15.10 | Other support facilities and utilities |
The project area is fenced and manned security provisions are in place.
First aid and ambulance are available on site.
| Project No PS213686 | WSP |
| Redwing Mine | January 2025 |
| S-K 1300 Technical Report Summary | Page 65 |
| Bulawayo Mining Company Limited |
| 16 | Market studies |
This section is included to inform an Initial Assessment for the estimation of Mineral Resources.
| 16.1 | Nature and material terms of agency relationships |
RGM is 100% owned by BMC Limited, with no agency relationships applicable.
| 16.2 | Results of relevant market studies |
No recent formal market studies have been completed. Gold and silver are sold according to open market prices as mandated by the Zimbabwean government. Analysis is based on historical pricing using a 3-year trailing average, combined with industry forecasts for exchange rate and inflation.
| 16.3 | Commodity price projections |
Pricing assumptions for gold and silver are based on historical spot pricing in an open market for precious metals, government mandated terms for payment, foreign exchange, and inflation recent history.
Trailing three-year average daily gold and silver prices that may be used as the basis for the gold price assumed for pay limit (cut-off grade) and revenue assumptions, as provided in Figure 16.1. At end December 2023, this averaged US$1 848/oz for gold and US$21/oz for silver. Silver in doré is not a material contributor to pay limit revenue estimation. As of May 2024, gold was expected to trade at US$2,410/oz. by the end of June 2024, according to Trading Economics global macro models and analysts’ expectations. Looking forward, it is estimated to trade at US$2,484/oz by the end of June 2025.
A gold price assumption of US$1 850/oz is reasonable and supportable for planning purposes, given spot pricing of US$2,330/oz (May 2024) and the 3-year trailing average price of US$1,848/oz (end December 2023, World Gold Council). A silver price assumption of US$21/oz is also reasonable given the spot price for silver is currently US$24.47/oz whilst the 3-year trailing average price is US$23.56/oz, indicating room to increase assumed pricing. Silver represents approximately 10-15% of doré and 0.2% of value and therefore is not material to revenue.
| Project No PS213686 | WSP |
| Redwing Mine | January 2025 |
| S-K 1300 Technical Report Summary | Page 66 |
| Bulawayo Mining Company Limited |
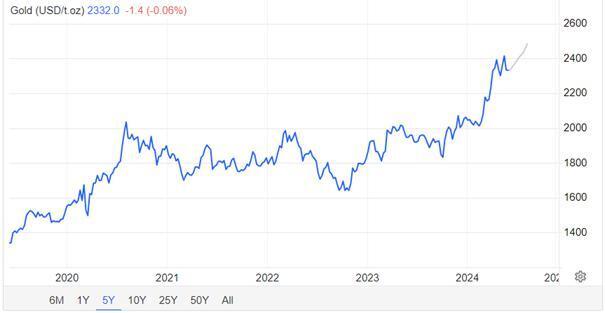
Figure 16.1 Historical (blue) gold spot price and forecast (grey) in US$/oz (Trading Economics 30 May 2024)
Gold proceeds are paid 75% in USD and 25% in local currency with effect from February 2023 (previously 60% USD and 40% in local currency). Sale of gold under these terms has been mandated by the Zimbabwean Government since the start of 2020. The impact of Government controls on gold and silver sales with respect to foreign currency retentions must be considered for the LOM plan. The local ZiG currency was only introduced 5 April 2024, is gold-backed and supported by strict monetary policy controls.
The local currency component of revenue has been employed for in country expenses, however, this value is subject to high inflation (57.5%, April 2024, Table 16.1) and exchange rate risk (Figure 16.2). Under these circumstances prompt expenditure of local currency on local expenses is warranted.
| Table 16.1 | Zimbabwean inflation rate and economic indicators (Trading Economics, 30 May 2024) |
| Indicator | Last | Previous | Highest | Lowest | Units | Date | ||||||||||||||
| Currency | 13.3 | 13.28 | 13.82 | 0 | May-24 | |||||||||||||||
| Stock Market | 102 | 100 | 2962052 | 1.13 | Points | May-24 | ||||||||||||||
| GDP Annual Growth Rate | 4.5 | 6.5 | 22.57 | -17.2 | percent | Dec-23 | ||||||||||||||
| Unemployment Rate | 9.1 | 9.3 | 10.8 | 4.4 | percent | Dec-23 | ||||||||||||||
| Inflation Rate | 57.5 | 55.3 | 786 | -7.5 | percent | Apr-24 | ||||||||||||||
| Interest Rate | 20 | 20 | 200 | 15 | percent | Apr-24 | ||||||||||||||
| Balance of Trade | -184 | -81.4 | 293 | -3958 | USD Million | Mar-24 | ||||||||||||||
| Current Account | 305 | 348 | 920 | -2750 | USD Million | Dec-22 | ||||||||||||||
| Current Account to GDP | 1 | 2.9 | 4.1 | -19.3 | percent of GDP | Dec-22 | ||||||||||||||
| Government Debt to GDP | 92.6 | 66.9 | 248 | 48.44 | percent of GDP | Dec-22 | ||||||||||||||
| Government Budget | -0.9 | -1.7 | 1.3 | -11.2 | percent of GDP | Dec-22 | ||||||||||||||
| Corporate Tax Rate | 24.72 | 24.72 | 30.9 | 24 | percent | Dec-23 | ||||||||||||||
| Personal Income Tax Rate | 41.2 | 41.2 | 51.5 | 36.05 | percent | Dec-23 | ||||||||||||||
| Project No PS213686 | WSP |
| Redwing Mine | January 2025 |
| S-K 1300 Technical Report Summary | Page 67 |
| Bulawayo Mining Company Limited |
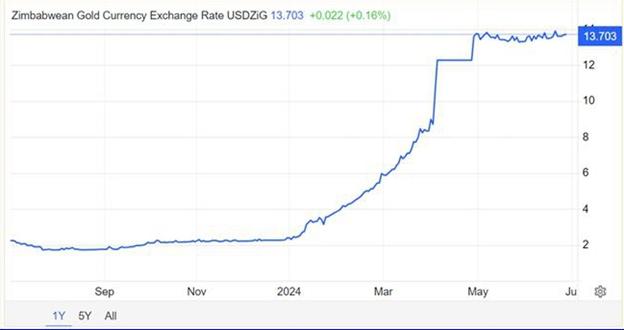
| Figure 16.2 | Zimbabwean gold currency exchange rate ZiG/USD (Trading Economics, 1 July 2024) |
Discounting current gold spot pricing of approximately US$2,350/oz to account for high inflation of 57.5% (April 2024) yields an estimated real value of US$1,936/oz while discounting for exchange rate movements in 2024 (USD:ZiG 2.34 to 13.304) yields an estimated real value of US$1,853/oz. The 12-month forecast price of US$2,484/oz yields discounted values of US$2,061/oz to US$1,971/oz respectively.
This evaluation indicates that a gold pricing assumption of US$1,850/oz for mine planning COG assessment purposes and cashflow modelling is reasonable, provided that inflation and related exchange rate movements for the local currency can be constrained to, or reduced from, current levels and local currency disposed of promptly to cover local costs.
| 16.4 | Mining and processing |
Future mining and processing at RGM are proposed to be conducted on an owner operator basis, consistent with previous practice.
Contract artisanal mining arrangements in place under the previous business administrator have been rescinded and are not material to future plans.
| 16.5 | Product transport and handling |
A gold and silver doré is produced for sale to the Zimbabwean government nominated agent, Fidelity. Gold generally averages 87% by weight. The product is transported by a private professional security company. Fawcetts Security, via armoured car to airport, then airlifted to Harare. Then transported by armoured car to Fidelity, a government owned refining facility via the Motapa Investment Fund (sovereign fund). Gold and silver is valued at spot pricing under the RTGS system on receipt of the doré with Fidelity stipulating allowances for refining charges (US$0.65/oz Au) and government royalty (5%).
| 16.6 | Hedging arrangements |
No hedging arrangements are currently in place.
| 16.7 | Forward sales contracts |
No forward sales contracts are currently in place.
| 16.8 | Contracts with affiliated parties |
No contracts with affiliated parties are currently in place with respect to gold sales.
| Project No PS213686 | WSP |
| Redwing Mine | January 2025 |
| S-K 1300 Technical Report Summary | Page 68 |
| Bulawayo Mining Company Limited |
| 17 | Environmental studies, permitting, and plans, negotiations, or agreements with local individuals or groups |
| 17.1 | Introduction |
The company ownership is per the company structure shared by the company. The Redwing Mining Lease covers approximately 1,254 ha of land.
| 17.2 | Project context |
RGM is located 20 km north-northeast of the city of Mutare in Manicaland Province, in the Mutare Mining District of Zimbabwe (grid reference – 658140). It is about 265 km southeast of the capital city, Harare. The location is at an altitude of about 1,200 amsl.
| 17.3 | Project permitting |
The following permits/licenses were provided to WSP for review:
| — | Environmental Impact Assessment Certificate Surface Mining and Milling – Expired 9 February 2023 |
| — | Environmental Impact Assessment (EIA) Certificate (Redwing Mine Surface Exploration) – Expired 1 August 2018. |
| — | EIA Certificate (Redwing Mine General Waste Landfill) – Expired 1 August 2018. |
| — | EIA Certificate (Redwing Mine Penhalonga EMP) – Expired 1 August 2018. |
| — | EIA Certificate (Redwing Mine General Waste Landfill) – Expired 29 January 2020. |
| — | EIA Certificate (Redwing Mine EMP) – Expired 29 January 2020. |
| — | EIA Certificate (Redwing Mine General Waste) – Expired 29 January 2020. |
| — | EIA Certificate (Surface Mine Exploration) – Expired 29 January 2020. |
| — | Licence for Storage of Explosives – Expired 30 June 2022 |
| — | Licence to Purchase, Acquire and Possess Explosives – Expired 30 June 2022. |
As at 31 December 2023, no certificates and licenses were current. It should be noted that the RGM was placed on C&M on 1 April 2019. All expired permits/licenses will need to be renewed before resumption of operations.
| Project No PS213686 | WSP |
| Redwing Mine | January 2025 |
| S-K 1300 Technical Report Summary | Page 69 |
| Bulawayo Mining Company Limited |
| 17.4 | Environmental and social impact assessment |
| 17.4.1 | Biodiversity and natural resources |
The dominant tree species in the area is Brachystegia spiciformis, a medium to large tree that covers extensive areas with marked dominance at the top. It thrives in a wide range of soils, even on slopes, although some bare patches suggest limitations in root depth. Julbernardia globiflora, a sub-dominant species, occupies the extreme west, which is drier and leeward. This region also hosts the lower-risk species, S. longipedunculata. While no formal survey was conducted, observed mammals in the Redwing vicinity and its environs include cattle, bucks, baboons, monkeys, hares, various small rodents, and snakes.
| 17.4.2 | Managing impacts on water |
The Water Act provides for the development and utilisation of water resources of Zimbabwe, grants of permits for the use of water, control of use of water when water is in short supply, protection of the environment and the prevention and control of water pollution and for the matters incidental to or connected with the foregoing
| 17.4.3 | Acid and metalliferous drainage (AMD) |
No acid and metalliferous drainage (AMD) data provided.
The use of mercury for local extraction of gravity won gold by artisanal miners may need to be considered.
| 17.4.4 | Erosion and protection of soils |
The properties of soils in RGM claims are largely influenced by the underlying parent material and intense weathering and leaching due to high rainfall. These conditions lead to deep soil profiles exceeding 3 to 4 metres, but erosion can cause shallower depths of less than one metre in some areas. The soils are highly acidic, have low cation exchange capacity, extremely low phosphate content, and high levels of free extractable iron due to intense weathering.
| 17.4.5 | Noise and vibration |
Generation of noise from compressed air will be controlled by ensuring planned maintenance schedule is being done and regular inspections will be undertaken. While noise will be regulated under 90dB in compliance with the Mines and Minerals Act Section 192.
| 17.4.6 | Air quality |
Underground Air pollution will be controlled by ensuring proper ventilation procedure is being followed by improving and monitoring ventilation system which included fans and other factors. Fumes will be minimised and contains as well as proper PPE will be provided.
Surface air emissions will be controlled by ensuring planned maintenance schedule is to be conducted to all vehicles.
| 17.4.7 | Local climate impacts |
No information regarding local climate impact was provided.
| 17.4.8 | Greenhouse gas emissions |
No Greenhouse gas emissions data provided.
| 17.4.9 | Resources use and non-mineral waste |
No resources use and non-mineral waste information.
| Project No PS213686 | WSP |
| Redwing Mine | January 2025 |
| S-K 1300 Technical Report Summary | Page 70 |
| Bulawayo Mining Company Limited |
| 17.5 | Project standards |
No project standards provided for review.
The QP assumes that similar quality assurance standards as adopted by BMC at How Mine will be implemented for future operation, including:
| — | Quality Management Systems: | ZWS ISO 9001-2015 |
| — | Environmental Management: | ZWS ISO 1401-2015 |
| — | Mining and Quarying: | IAF Code 2. |
| 17.6 | Stakeholder engagement |
| 17.6.1 | Stakeholder engagement plan |
No stakeholder engagement plan provided for review.
| 17.6.2 | Consultation |
No data relevant to this section.
| 17.7 | Cultural, economic, and social conditions |
| 17.7.1 | Cultural heritage |
The cultural landscape of RGM is intricate and diverse, reflecting its history dating back to the pre-independence era. Workers migrated from neighbouring countries for better opportunities, resulting in a blend of nationalities and ethnic groups such as Tonga, Manyika, Nyanja, Chewa, and Zezuru, each with its own cultural practices. Additionally, a variety of Christian denominations and African Independent Apostolic churches contribute to the cultural tapestry, including Roman Catholic, Methodist, Seventh Day Adventist, Johane Masowe, Johannes Marange, Zion, ZCC, and Pentecostal movements like UFI, ZAOGA, and AFM. These religious groups play a significant role in shaping the social and ethical dynamics of RGM.
| 17.7.2 | Local landscape |
No information regarding local landscape provided.
| 17.7.3 | Contributing to the national and local economy |
The mine operations are poised to contribute significantly to the national economy through various channels. Primarily, incomes earned by mine workers will stimulate domestic spending, ensuring continuous circulation of money within Zimbabwe. Additionally, mineral exports will generate capital through taxes. A comprehensive project appraisal indicates favourable returns for shareholders, management, employees, contractors, and the community. Profitability forecasts demonstrate the potential value addition, especially once the open pit mining operation commences ore production. Moreover, the mine has the capacity to address any environmental and social impacts effectively, underscoring its commitment to sustainability.
| 17.7.4 | Establishing a social management framework |
No information regarding this topic was provided.
| 17.7.5 | Impacts on land use and access |
Current LOM plan for the base case.
| Project No PS213686 | WSP |
| Redwing Mine | January 2025 |
| S-K 1300 Technical Report Summary | Page 71 |
| Bulawayo Mining Company Limited |
| 17.7.6 | Protecting community health and safety |
RGM has a local clinic which caters for the micro-health problems of the mine workers as well as the surrounding community. The clinic also runs a maternity section. To enhance quality provision of health, there is a medical doctor who visits the mine on a weekly basis and the clinic has permanent and highly qualified nurses and support personnel.
Medical surveillance and checkups are done regularly to determine the health of workers and ensure their wellbeing. Because of its proximity to the city of Mutare serious health issues can be hastily transferred to Mutare Provincial General Hospital. It is also vital to note that the mine is proactive in terms of disease prevention, for instance, its waste management policies prevent spread of diseases by vectors such as house flies and cockroaches.
| 17.7.7 | Protecting the workforce |
RGM will comply with relevant Zimbabwean legislation as a minimum.
| 17.7.8 | Commitment to local procurement and hiring |
RGM emphasises equal employment opportunities, refraining from discrimination based on religion, gender, or race. Prioritising local employment fosters mutually beneficial relationships between the mine and residents of Mutasa district and the high-density village. This strategy eliminates the need for transportation and accommodation logistics while ensuring employees enjoy the comfort of working near their families. Such proximity aids in addressing societal challenges like HIV and AIDS. As one of the primary employers in Manicaland Province, with a workforce of 261, RGM significantly contributes to both regional and national economies.
| 17.8 | Mine closure |
Mine closure plans, including remediation and reclamation plans have recently been updated by Enmin Consulting (Private) Limited (Enmin) in June 2024, including a detailed outline of closure requirements and costs.
The Redwing mine is currently on care and maintenance, with planned recommencement of underground mining and processing operations subject to the outcome of a planned prefeasibility study. Consequently, the mine closure plan and remediation works are on hold.
| 17.8.1 | Plan |
The mine closure plan envisages that at the conclusion of mining and processing, the land will be rehabilitated. A mine closure plan has been developed that contemplates site closure that will restore the land to its best future use. Closure planning is an iterative process, and ongoing technical studies as well as consultation with local stakeholders will feed into future refinements of the current closure concepts, prepared on a regular basis by RGM’s selected external consultant. The implementation and success of the plan will be monitored until the site achieves an environmentally and socially acceptable and sustainable state.
The conceptual mine closure plan indicates that closure will be required after completion of mining, although this timeline may vary as a function of conversion of additional Mineral Resources to Mineral Reserves as part of an annual update. Studies are ongoing to determine the potential for further extraction. On exhaustion of reserves, the underground mine will be closed and the ore handling and processing facilities will be decommissioned. This will entail dismantling, demolition and removal of equipment and buildings, reshaping and re contouring of land surfaces and rehabilitation of occupied areas. Dewatering of the underground mine will cease upon completion of mining and allowed to fill with water. As far as practical, the land occupied by the mine and its infrastructure will be returned to its former land use. The mine, plant area and waste emplacements and other works will be made safe for the community including the placement of barriers to discourage people from entering the mined out workings. A public education program on safety issues associated with the mine and any excavated areas will be conducted. A passive water management system will be implemented so that adequate protection for surrounding water resources can be provided without ongoing active management by RGM.
The closure phase will also require the management of social issues including retrenchment of the workforce and managing the implications of loss of local employment and business. To mitigate the social impacts commonly associated with mine closure, the Mine Closure Plan includes components related to social and community impacts. The plan will be developed in consultation with relevant authorities, the workforce and local communities.
| Project No PS213686 | WSP |
| Redwing Mine | January 2025 |
| S-K 1300 Technical Report Summary | Page 72 |
| Bulawayo Mining Company Limited |
| 17.8.2 | Cost |
Mine and social closure costs have recently been updated in June 2024 by Enmin. These costs comprise allowances for environmental rehabilitation, social closure and equipment salvage. The total cost is estimated at US$7.9 M assuming a Planned Closure scenario in accordance with the LOM plan, inclusive of a 12.6% contingency (Table 17.1), while this increases to US$11.3 M assuming an Unplanned closure scenario. Equipment Salvage cost has not been included in the closure liability as this will form part of the RGM cost. Social liability costs will only be borne during Unplanned Closure of the mine. For planned closure, the mine will have the opportunity to give sufficient notice to its employees on the closure of the mine, thus avoiding this additional cost. The Planned Closure cost estimate is adopted for cashflow model evaluation.
| Table 17.1 | RGM present closure obligation (Enmin 2024) |
| Cost (US$) | ||||||||||
| Item No. | Activity | Planned Closure | Unplanned Closure | |||||||
| 1 | Environmental Liability | 6,592,123 | 6,592,123 | |||||||
| 2 | Social Liability | 2,798,877 | ||||||||
| 3 | Equipment Salvage | 100,579 | ||||||||
| Sub-total | 6,592,123 | 9,491,578 | ||||||||
| Administrative and Supervision costs @6% | 395,527 | 569,495 | ||||||||
| 12.6% Contingency | 882,874 | 1,199,240 | ||||||||
| Total Mine Closure Costs | 7,870,524 | 11,260,313 | ||||||||
| 17.9 | Translating the ESIA into environmental and social management |
No data relevant to this section.
| Project No PS213686 | WSP |
| Redwing Mine | January 2025 |
| S-K 1300 Technical Report Summary | Page 73 |
| Bulawayo Mining Company Limited |
| 17.10 | QP’s opinion |
Whilst the mine is currently on C&M, environmental, miscellaneous operational and quality assurance permits, and certification should be renewed in preparation for recommencement of operations.
In the QP’s experience, mine closure costs can be a source of significant variability, generally on the downside. Bond liability requirements are generally a guide that reflects the government liability in the event of company default but do not always reflect the full cost of rehabilitation for the company. It is not unusual to find mine closure more than double the cost of legal compliance estimates.
| 18 | Capital and operating costs |
Not applicable since this TRS is an Initial Assessment and no Mineral Reserves have been estimated.
Any future estimation of Mineral Reserves and potential recommencement of operations will require the support of an additional drilling and resource definition campaign and at least a pre-feasibility to feasibility level of evaluation.
| 19 | Economic analysis |
Not applicable since this TRS is an Initial Assessment and no Mineral Reserves have been estimated.
Any future estimation of Mineral Reserves and potential recommencement of operations will require the support of an additional drilling and resource definition campaign and at least a pre-feasibility to feasibility level of evaluation.
| Project No PS213686 | WSP |
| Redwing Mine | January 2025 |
| S-K 1300 Technical Report Summary | Page 74 |
| Bulawayo Mining Company Limited |
| 20 | Adjacent properties |
Claims within the immediate and surrounding RGM area were consolidated in 2015 to form ML 34 (Section 3.2).
Table 20.1 presents a summary of claims in close proximity to ML 34. These claims are all located within the MGB. These claims cover historical and recent mine workings of various sizes that are of geological and economic interest (KDM 2018).
All claims are held by RMC Zimbabwe, with the exception of Toronto, Monarch, and Champion which have recently been sold by (BCM Limited).
| Table 20.1 | Summary of adjacent claims (Virimai 2022) |
| Claim | Approximate Area (m2) | Year Acquired | Geological Appraisal | ||||||
| RMC Zimbabwe Held Claims | |||||||||
| Hen 4 & 5 | 436,000 | 1974 | Narrow, EW trending quartz reef extending west of Iona section – a contiguous surface expression running along the ridge. No subsurface, drill-hole information available. | ||||||
| Arran | 1,455,000 | 1975 | Narrow quartz-pyrite reef in talcose schist. Highly variable grades. | ||||||
| Bulldog | 1,980,000 | 1978 | Narrow quartz-pyrite reef running sub parallel to the granite-greenstone contact. | ||||||
| Peplow 5 | 261,800 | 1980 | Narrow quartz reef trending EW. | ||||||
| Caliph | 138,000 | 1978 | Narrow quartz veins in sheared schist. Located NE of Redwing and E of Mutare R waterfall in heavily forested hills belonging to Border Timbers. | ||||||
| Nina | 162,000 | 1980 | Located NE of Redwing and E of Mutare R waterfall in heavily forested hills belonging to Border Timbers. | ||||||
| Other Claims | |||||||||
| Toronto | 5,165,000 | 1973 | Closed, flooded narrow quartz reef mine on the NW foot of the Cecil Kopje in the Toronto Residential suburb. Small old dump on site. | ||||||
| Monarch | 605,000 | 1987 | Numerous narrow quartz reefs trending EW & BIF on the Mozambican border – old workings. No recent exploration work records available. | ||||||
| Champion | 2,262,680 | 1987 | Acquired from Anglo-American, no meaningful results from underground drilling, mine closed, sealed & flooded. Reportedly a discontinuous reef with highly erratic values. Old, poorly evaluated dump on site. | ||||||
No data or other information from these historical adjacent properties were used in the preparation of this TRS.
| 21 | Other relevant data and information |
WSP is not aware of any other relevant data or information other than that disclosed in this TRS, that materially affects the information included in this TRS and that all material assumptions and parameters underpinning Mineral Resources and Mineral Reserves estimates continue to apply and have not materially changed.
| Project No PS213686 | WSP |
| Redwing Mine | January 2025 |
| S-K 1300 Technical Report Summary | Page 75 |
| Bulawayo Mining Company Limited |
| 22 | Interpretation and conclusions |
| 22.1 | Mineral Resources interpretations and conclusions |
Based on the information presented in this TRS, the QP’s key conclusions are as follows:
| — | The level of understanding in terms of regional geology, local geology and the nature and controls on mineralisation is high and provides a solid foundation for geological modelling, Mineral Resource estimation and mining geology. |
| — | Location of samples for surface and level-infill drilling are un-reliable due to errors with collar location and downhole survey. |
| — | Mineral Resource estimates are currently transitioning from paper-based estimates to digital estimates. |
| — | Mineral Resource estimates were completed on an unconstrained basis. |
| — | Estimates utilised all available samples i.e., channel, sludge, diamond drill core etc. |
| — | Dry BD of 2.7 t/m3 assigned for all domains. |
| — | Validation of the Mineral Resource estimates has not been reported. Standard industry practice is to conduct both visual and statistical validation of estimates and present the findings of this work in the Mineral Resource report to give the reader an appreciation of the robustness of the estimates. |
| — | Estimation within modelled mineralisation domains (constrained estimate) would likely result in an increase in contained metal. |
| — | Gold price increase have not been reflected in the reporting Au cut-off grade. A lower reporting cut-off grade may lead to an increase in contained metal. |
| — | The on-site assay laboratory is well-equipped and maintained and is considered suitable for the work that it is used for. |
| — | The drilling, sampling, assay and QAQC techniques used for both exploration and resource definition are consistent with standard industry practice and are considered appropriate for the purposes of geological modelling and Mineral Resource estimation. More detailed information on core recovery is however required. |
| — | Data and database management requires further work. |
| — | The COG used for Mineral Resource estimation seem reasonable on face value, however, the methodology used for determination of these values has not been reported and requires further explanation. |
| — | The method used for high-grade cutting is deemed appropriate and consistent with industry practice. |
| — | Validation of the Mineral Resource estimates has not been reported. Standard industry practice is to conduct both visual and statistical validation of estimates and present the findings of this work in the Mineral Resource report to give the reader an appreciation of the robustness of the estimates. |
| — | Mineral Resource estimates used a combination of paper-based estimation methods and digital estimation |
| — | The MRMR technical report developed by RMC Zimbabwe covers a number of areas in sufficient detail, however; a number of areas require more detail to give the reader a more thorough understanding of the work that has been conducted, the results of the work and any inherent risks to the Mineral Resource estimate. |
| — | Mining, processing, and market modifying factors, study assumptions and parameters are used to establish RPEE for the reporting of Mineral Resources. No significant risks exist that could impact the reliability and/or confidence of Mineral Resources estimates. |
| 22.2 | Mineral Reserves interpretations and conclusions |
Not applicable since this TRS is an Initial Assessment and no Mineral Reserves have been estimated.
| Project No PS213686 | WSP |
| Redwing Mine | January 2025 |
| S-K 1300 Technical Report Summary | Page 76 |
| Bulawayo Mining Company Limited |
| 23 | Recommendations |
Based on the results presented in this TRS, and consistent with BMC Limited’s long standing operating practices, ongoing technical work will be performed on the Property as part of studies to improve confidence, decrease risk, and enable the conversion of Mineral Resources to Mineral Reserves. The following items are recommended to sustain Mineral Resources and Mineral Reserves:
| 23.1 | Mineral Resources recommendations |
| — | Data and database management is an area that requires further work. The RGM would benefit from the introduction of a corporate database, with inbuilt validation routines and reporting functionality, to assist with what is a large quantity of geological information. |
| — | Review lithology, structural and mineralisation modelling practices. |
| — | Data analysis is conducted; however, it is recommended that for future Mineral Resource estimates, deposit wide Exploratory Data Analysis (EDA) is undertaken prior to estimation, to ensure data is fit for purpose for geological modelling and Mineral Resource estimation. |
| — | It is recommended that a succinct geological modelling and Mineral Resource estimation process flow is developed and followed for future Mineral Resource estimates. |
| — | It is recommended that Mineral Resource estimation is constrained to modelled mineralisation domain wireframes, using the Au Cut-off Grade (COG) chosen by the QP at the time of estimation and reporting. |
| — | All paper-based estimation techniques should be converted to computer-based (digital) as soon as possible. |
| — | A comparison between BD values determined from underground grab samples, and drill core should be undertaken to ensure that the mean values used for Mineral Resource estimation are appropriate, and that bias is not being incorporated into the Mineral Resource estimate. |
| — | Validation of the Mineral Resource estimates produced, or at least the documentation of validation work undertaken is an area that requires further work. Standard industry practice is to conduct both visual and statistical validation of estimates and present the findings of this work in the Mineral Resource report, to give the reader an appreciation of the robustness of the estimates. |
| — | RPEE have been considered, and the parameters used are considered reasonable. |
| — | Review Mineral Resource classification methodology and block assignment. |
| — | The Mineral Resource report developed covers a number of areas in sufficient detail; however, some areas require more detail to give the reader a more thorough understanding of the work that has been conducted, the results of the work and any inherent risks to the Mineral Resource estimate. |
| — | Mineral Resource reconciliation practices should be reviewed, and a system implemented that provides a measure of Mineral Resource estimate performance. Planned versus actual resource tonnages and grades should be developed and updated each time a Mineral Resource estimate is completed. It is recommended that mined development and production be reconciled monthly, and stope close-out reports be developed for each completed stope. |
| — | A Mineral Resource update, according to industry best practice, should be completed prior to re-establishment of commercial production. |
| — | An underground drilling program, collared from footwall drives, aimed at increasing confidence in the existing resource should be undertaken. |
| — | Subsequent to future MRM updates, a stope optimisation exercise is recommended. Stope optimisation allows for the rapid development of valid stope shapes according to specified criteria. |
| 23.2 | Mineral Reserves recommendations |
Not applicable since this TRS is an Initial Assessment and no Mineral Reserves have been estimated.
| Project No PS213686 | WSP |
| Redwing Mine | January 2025 |
| S-K 1300 Technical Report Summary | Page 77 |
| Bulawayo Mining Company Limited |
| 24 | References |
BMC (Bulawayo Mining Company (Private) Limited) (2023). How Mine, Mineral Reserves and Mineral Resources (MRMR) Estimates, 31 December 2023, Report on file at Metallon Management (Private) Limited, Harare, Zimbabwe.
Budavari S. July 1991. Some rock mechanics problems experienced at Rezende Mine. University of Witwaterrsrand. Prepared for Independence Mining (PVT) Limited.
Golder Associates Pty Ltd (Golder) 2021, Competent Person’s Report for the Redwing Mine, Zimbabwe, Prepared for Metallon Corporation Limited (UK), United Kingdom, Submitted August 2021, 75 pp.
KDM (The King’s Daughter Mining Company (Private) Limited) 2018, Mineral Resources and Mineral Reserves Estimates June 2018, Report on file at Metallon Management Services Ltd., Harare, Zimbabwe.
Meteoblue 2019, Climate Mazowe, Available at:
https://www.meteoblue.com/en/weather/historyclimate/climatemodelled/mazowe_zimbabwe_886384
MGZ (Metallon Gold Zimbabwe (Pvt) Ltd) 2019. Redwing Mine Environmental Management Plan, Report on file at RMC Zimbabwe, Penhalonga, Zimbabwe, 69 pp.
Prendergast, MD 2004, The Bulawayan Supergroup: a late Archaean passive margin-related large igneous province in the Zimbabwe craton, Journal of the Geological Society, vol.161, pp. 431-445.
Peacock, Simpson & Associates (PVT) Ltd 1995, Extractive Metallurgical Testwork on the Redwing Mine Mill Feed, Report No. 41/168/95, Submitted January 1995
RBZ (Reserve Bank of Zimbabwe) 2024, The 2024 Monetary Policy Statement at a Glance, 5 April 202413pp.
RMC Zimbabwe 2025, Memo: Redwing Mine Exploration Final Report, 31 pp.
SRK (SRK Consulting (UK) Ltd) 2012, A Competent Persons’ Report on the Mineral Assets of Metallon Gold Zimbabwe (Private) Limited, Republic of Zimbabwe, Prepared for Metallon Gold Zimbabwe (Private) Limited, Republic of Zimbabwe, Submitted November 2012, 79 pp.
SRKSA (SRK Consulting (South Africa) (Pty) Ltd) 2016, Rock Engineering Review for Redwing Mine, Prepared for Metallon Gold Zimbabwe (Private) Limited, Republic of Zimbabwe, Report Number 493792/1, Submitted February 2016, 62 pp.
Un-named. November 1991. Rock mechanics investigation: Old West and Redwing Mines. Report No. RW7.
Virimai Projects (Virimai) 2022, Redwing Gold Mine Restart High Level Assessment, Prepared for Redwing Mining Company (Private) Limited, Republic of Zimbabwe, Submitted November 2022, 72 pp.
Waterkings Environment Consultancy (Waterkings) 2012, Redwing Gold Mine – General Waste Landfill EIA Report, Submitted April 2012, 126 pp.
| Project No PS213686 | WSP |
| Redwing Mine | January 2025 |
| S-K 1300 Technical Report Summary | Page 78 |
| Bulawayo Mining Company Limited |
| 25 | Reliance on information provided by the Registrant |
Except for the purposes legislated under Canadian/USA securities law, any use of this report by any third party is at that party’s sole risk.
The QPs have wholly relied upon the Registrant for the following:
| — | Macroeconomic trends, data and assumptions, and interest rates (Sections 18 and 19). |
| — | Marketing information and plans within the control of the Registrant (Sections 16, 18, and 19). |
| — | Legal matters outside the expertise of the QPs, such as statutory and regulatory interpretations affecting the mine plan (Sections 3, 13, 15, and 17). |
| — | Environmental matters outside the expertise of the QPs (Section 17). |
| — | Accommodations the Registrant commits or plans to provide to local individuals or groups in connection with its mine plan (Section 17). |
| — | Governmental factors outside the expertise of the QPs (Section 17). |
The QPs consider it reasonable to rely upon the Registrant for the above information, based on the QPs’ past and ongoing interactions with the subject-matter experts in these areas employed or engaged by the Registrant, as well as the Registrant’s considerable experience mining at the Property. Further, the QPs have taken all appropriate steps, in their professional opinion, to ensure that the above information provided by the Registrant is accurate in all material respects and have no reason to believe that any material facts have been withheld or misstated.
| Project No PS213686 | WSP |
| Redwing Mine | January 2025 |
| S-K 1300 Technical Report Summary | Page 79 |
| Bulawayo Mining Company Limited |

| Project No PS213686 | WSP |
| Redwing Mine | January 2025 |
| S-K 1300 Technical Report Summary | Page 80 |
| Bulawayo Mining Company Limited |
This Report is provided by WSP Australia Pty Limited (WSP) for Bulawayo Mining Company Ltd (Client) in response to specific instructions from the Client and in accordance with WSP’s proposal dated 29 May 2024 and agreement with the Client dated 30 May 2024 (Agreement).
Permitted purpose
This Report is provided by WSP for the purpose described in the Agreement and no responsibility is accepted by WSP for the use of the Report in whole or in part, for any other purpose (Permitted Purpose).
Qualifications and assumptions
The services undertaken by WSP in preparing this Report were limited to those specifically detailed in the Report and are subject to the scope, qualifications, assumptions and limitations set out in the Report or otherwise communicated to the Client.
Except as otherwise stated in the Report and to the extent that statements, opinions, facts, conclusion and / or recommendations in the Report (Conclusions) are based in whole or in part on information provided by the Client and other parties identified in the report (Information), those Conclusions are based on assumptions by WSP of the reliability, adequacy, accuracy and completeness of the Information and have not been verified. WSP accepts no responsibility for the Information.
WSP has prepared the Report without regard to any special interest of any person other than the Client when undertaking the services described in the Agreement or in preparing the Report.
Use and reliance
This Report should be read in its entirety and must not be copied, distributed or referred to in part only. The Report must not be reproduced without the written approval of WSP. WSP will not be responsible for interpretations or conclusions drawn by the reader. This Report (or sections of the Report) should not be used as part of a specification for a project or for incorporation into any other document without the prior agreement of WSP.
WSP is not (and will not be) obliged to provide an update of this Report to include any event, circumstance, revised Information or any matter coming to WSP’s attention after the date of this Report. Data reported and Conclusions drawn are based solely on information made available to WSP at the time of preparing the Report. The passage of time; unexpected variations in ground conditions; manifestations of latent conditions; or the impact of future events (including (without limitation) changes in policy, legislation, guidelines, scientific knowledge; and changes in interpretation of policy by statutory authorities); may require further investigation or subsequent re-evaluation of the Conclusions.
This Report can only be relied upon for the Permitted Purpose and may not be relied upon for any other purpose. The Report does not purport to recommend or induce a decision to make (or not make) any purchase, disposal, investment, divestment, financial commitment or otherwise. It is the responsibility of the Client to accept (if the Client so chooses) any Conclusions contained within the Report and implement them in an appropriate, suitable and timely manner.
In the absence of express written consent of WSP, no responsibility is accepted by WSP for the use of the Report in whole or in part by any party other than the Client for any purpose whatsoever. Without the express written consent of WSP, any use which a third party makes of this Report or any reliance on (or decisions to be made) based on this Report is at the sole risk of those third parties without recourse to WSP. Third parties should make their own enquiries and obtain independent advice in relation to any matter dealt with or Conclusions expressed in the Report.
Disclaimer
This report contains the expressions of professional opinions of the Authors based on (i) information available at the time of preparation, (ii) data supplied by RMC [and others], and (iii) the assumptions, conditions, and qualifications set forth in this report. The quality of information, conclusions, and estimates contained herein are consistent with the stated levels of accuracy as well as the circumstances and constraints under which the mandate was performed.
| Project No PS213686 | WSP |
| Redwing Mine | January 2025 |
| S-K 1300 Technical Report Summary | Page 81 |
| Bulawayo Mining Company Limited |